THIS
DOCUMENT
IS
NOT
AN
INVESTMENT
RECOMMENDATION
AND
SHALL
BE
USED
EXCLUSIVELY
FOR
ACADEMIC
PURPOSES
(SEE DISCLOSURES AND DISCLAIMERS AT END OF DOCUMENT)See more information at WWW.NOVASBE.PT Page 1/35
M
ASTERS IN
F
INANCE
E
QUITY
R
ESEARCH
After analysing Galp’s strategy and business prospects, we
present a FY12 price target of €13.81, corresponding to a hold recommendation.
We consider Galp’s E&P segment to be its main source of value. World demand for oil and natural gas is expected to increase,
supporting high oil prices. We also estimate Galp’s necessary
investments for the development of upstream projects in the different geographies where its assets are located.
As the Conversion project moves towards completion, we
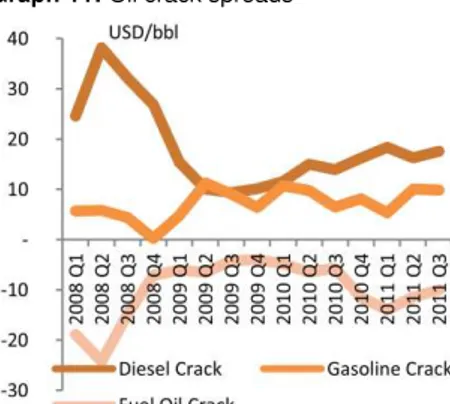
expect Galp’s Refining activities to start generating positive cash-flows, on the back of a better crude diet and better adaption of production to market needs, through diesel, thus benefitting from higher diesel crack spreads. Marketing operations should remain a stable source of cash-flows, as Galp will retain its competitive advantage in the wholesale and retail markets.
In the G&P segment, regulated gas activities continue to provide stability in cash-flows, although liberalized operations will suffer due to the economic crisis. Power business faces uncertainty, as the Troika has pushed for a decrease in feed-in tariffs.
The sale of Brazilian assets to Sinopec enables Galp to continue pursuing business opportunities, as new discoveries in Brazil and Mozambique will require increased capital expenditures. We also provide our view on the structure of this deal.
Company description
Galp Energia is an integrated oil & gas company, whose activities are divided through three main business segments: Exploration & Production (E&P), Refining & Marketing (R&M) and Gas & Power (G&P). Although R&M has historically been its core segment, the focus is now on its E&P portfolio, especially in the Brazilian, Angolan and newly-discovered Mozambican assets. G&P accounts for a
smaller part of Galp’s activities.
G
ALP
E
NERGIA
C
OMPANY
R
EPORT
O
IL
&
G
AS
6
J
ANUARY2011
S
TUDENT
:
J
OÃO
S
ALVAÇÃO
B
ARRETO
[email protected]
The Future is Offshore
Assets sale supports future growth opportunities
Recommendation: HOLD
Price Target FY12: 13.81 €
Upside Potential 12,69%
Price (as of 6-Jan-12) 12.26 €
Reuters: Galp:LS, Bloomberg: Galp:LP
52-week range (€) 11.26-16.97
Market Cap (€m) 10,137.59
Outstanding Shares (m) 829.251
Free Float 25,32%
Source: Bloomberg
Source: Bloomberg
(Values in € millions) 2010 2011E 2012F
EBITDA 1,052 1,159 1,074
EBITDA margin 7% 7% 6%
EBIT 638 702 615
EBIT margin 4% 3% 3%
Net Profit 441 465 303
EPS 0.53 0.56 0.37
ROCE 8.6% 5.8% 4.3%
Net Debt 2,840 (168) 975
Net Debt/Equity 105% (3%) 15%
Net Debt/EBITDA 2.7 (0.15) 0.91
P/E 26.94 20.68 37.83
GALP ENERGIA COMPANY REPORT
THIS
DOCUMENT
IS
NOT
AN
INVESTMENT
RECOMMENDATION
AND
SHALL
BE
USED
EXCLUSIVELY
FOR
ACADEMIC
PURPOSES
(SEE DISCLOSURES AND DISCLAIMERS AT END OF DOCUMENT)PAGE 2/35
Table of Contents
EXECUTIVE SUMMARY ... 3
COMPANY OVERVIEW ... 3
COMPANY DESCRIPTION ... 3
SHAREHOLDER STRUCTURE ... 4
E&P ... 5
MARKET ENVIRONMENT ... 5
BRAZIL ... 7
ANGOLA & MOZAMBIQUE ... 8
CAPITAL EXPENDITURES ... 9
CAPITAL INCREASE IN BRAZIL ... 10
VALUATION ... 11
SENSITIVITY ANALYSIS ... 13
R&M ... 14
MARKET ENVIRONMENT ... 14
EUROPEAN REFINING INDUSTRY ... 15
REFINING ACTIVITIES ... 16
REFINING ASSETS AND UPGRADE PROJECT ... 17
MARKETING ACTIVITIES ... 18
VALUATION ... 19
SENSITIVITY ANALYSIS ... 21
G&P ... 21
MARKET ENVIRONMENT ... 21
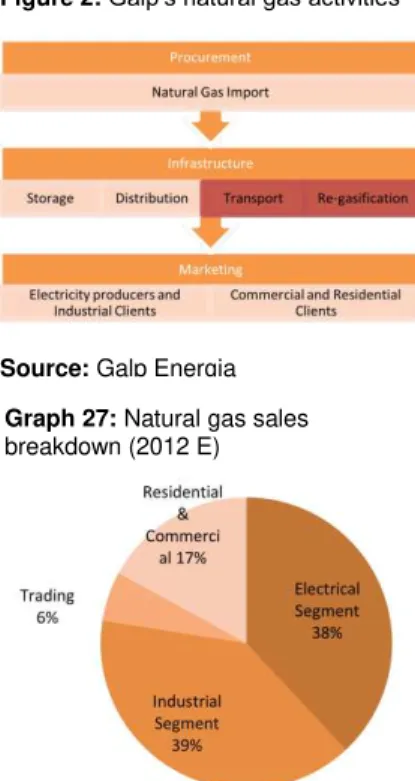
NATURAL GAS ACTIVITIES ... 22
POWER ACTIVITIES ... 24
VALUATION ... 26
SENSITIVITY ANALYSIS ... 27
SUM-OF-THE-PARTS ... 27
SENSITIVITY ANALYSIS ... 29
CONSOLIDATED FINANCIALS ... 31
FINANCIAL STATEMENTS ... 33
APPENDIX ... 34
GALP ENERGIA COMPANY REPORT
THIS
DOCUMENT
IS
NOT
AN
INVESTMENT
RECOMMENDATION
AND
SHALL
BE
USED
EXCLUSIVELY
FOR
ACADEMIC
PURPOSES
(SEE DISCLOSURES AND DISCLAIMERS AT END OF DOCUMENT)PAGE 3/35
Executive Summary
This Company Report has the purpose of developing a thorough analysis of Galp Energia across the different business segments in which it operates, namely E&P, R&M and G&P. Based on our study of the company’s strategy and how it
may interrelate with current and future market dynamics, we provide an investment recommendation. Though there are many risks threatening the
company’s operations, we believe it has a strong growth potential, especially
coming from the E&P segment.
We perceive E&P as the segment from which Galp may extract more value, particularly from its participations in Brazil. Although development projects going ahead will demand large capital outlays from the company, possibly jeopardizing the balance of its capital structure, we expect high returns to be generated by upstream operations.
In what concerns the Refining segment, we believe the conversion project will
gradually enhance the company’s margins and utilization rates, through better adaptability of production to demand. Flexibility in production can be extremely important since European directives may decrease the incentive for diesel consumption. In Marketing activities, we expect Galp to be able to retain its market share and margins, since its priority access to refined oil products imposes a limit on price competition from supermarkets.
Regarding G&P, liberalized commercialization of natural gas may be under pressure during the economic downturn, but should recover from 2013 onwards. Regulated activities are expected to remain stable, as there is no expectation of a change in remuneration rates. The Troika recommendation of decreasing feed-in tariffs for electricity Production under the Special Regime could change the face of the Power segment.
To sum up, we provide a price target FY2012 recommendation of €13.81/share.
Company Overview
Company Description
Galp Energia was founded in 1999, after the merger between Petrogal and Gás de Portugal, a result of the restructuring of the Portuguese energy sector. Nowadays, Galp is one of the most important Portuguese companies and the one Figure 1: Galp’s activities chart
Source: Galp Energia
Upstream activities provide good opportunity for value creation
Risks need to be properly addressed
Investments for development of oil fields may constraint financial flexibility
Conversion project will improve attractiveness of Refining segment
Marketing activities to remain a stable source of cash flow
GALP ENERGIA COMPANY REPORT
THIS
DOCUMENT
IS
NOT
AN
INVESTMENT
RECOMMENDATION
AND
SHALL
BE
USED
EXCLUSIVELY
FOR
ACADEMIC
PURPOSES
(SEE DISCLOSURES AND DISCLAIMERS AT END OF DOCUMENT)PAGE 4/35 with largest market capitalization. As an integrated oil & gas company, its activities cover the whole oil and natural gas value chain, from exploration to direct sale to clients, throughout 13 different countries. Galp’s activities are
broadly divided into three main business segments: Exploration and Production (E&P), Refining and Marketing (R&M) and Gas and Power (G&P).
Galp’s upstream activities comprise the exploration, development and production of oil and natural gas resources, especially in Brazil and Angola, but also in other geographies, such as Mozambique, where the company has recently found a large amount of natural gas. The E&P segment is the one to which Galp expects to dedicate most of its financial resources in the future, since it is also where they expect to extract more value from. Regarding downstream activities, they are composed by the R&M and the G&P segments. R&M consists on the refining of oil products and their sale in the Iberian Peninsula, mainly through the retail and wholesale channels. In the G&P segment, the company sources natural gas, storages and distributes it in the regulated markets and also supplies it in
liberalized markets. Galp’s power business consists of the cogeneration and trading of electricity.
Historically, R&M has been the largest contributor to Galp’s EBITDA, followed by
G&P and lastly the E&P segments. In 2010, R&M activities accounted for 56% of
Galp’s EBITDA, but as the company’s upstream development projects enter the production phase, E&P’s contribution will rise sharply, eventually surpassing R&M’s by 2015.
Shareholder Structure
Galp Energia has three main shareholding blocks, with Amorim Energia and Eni
each controlling 33.34% of the company’s stock, while the Portuguese State
controls 8%, through Parpública (7%) and Caixa Geral de Depósitos (1%), while the remaining 25.32% of shares are freely traded in the Euronext and are mostly controlled by institutional investors. It is also important to stress that Sonangol has an indirect participation of 15% because of its 45% participation in Amorim Energia, through its Esperaza Holding BV.
Until the end of December 2010, Galp’s main investors had agreed on a lock-in period, in which they could not sell their respective share in the company. After the expiry of the agreement, any party may sell its position in block, while the other parties will have preference and tag-along rights in the case of a sale to third parties. Although a year has passed since the end of the lock-in period, no
New focus on Mozambique E&P
Most value coming from upstream activities
Graph 1: Segment Contribution to EBITDA (2010)
Source: Galp Energia, Analyst Estimates
Graph 2: Shareholder Structure as of December 201
Source: Galp Energia
GALP ENERGIA COMPANY REPORT
THIS
DOCUMENT
IS
NOT
AN
INVESTMENT
RECOMMENDATION
AND
SHALL
BE
USED
EXCLUSIVELY
FOR
ACADEMIC
PURPOSES
(SEE DISCLOSURES AND DISCLAIMERS AT END OF DOCUMENT)PAGE 5/35 shareholder has sold its position in Galp. Eni has declared its intention to either sell its stake or gain control over the company and the Portuguese State will also want to sell its position (the entire 8%) during 2012, inserted in its privatization plan1. In spite of Eni’s possible intention to control, it will eventually end up selling
its stake, since Amorim Energia is not willing to sell its position and, moreover, Sonangol has also expressed its intention in having a direct participation in the company, in complement to its actual indirect participation of 15%. Eni’s heavily
indebted capital structure is also an obstacle in its intention to increase control in Galp and can force this sale.
This stalemate in Galp’s shareholder structure is also impacting the company’s
management. The parties have not yet agreed upon a new administration of the company and the current one should have ceased functions in 2010. Although the current CEO, Manuel Ferreira de Oliveira, has shown his availability to continue his leadership at Galp, he allegedly has not been able to gather the support of Sonangol and Eni on a possible re-election.
Regarding Eni’s and the Portuguese State’s selling positions, it can be interesting to assess who could be interested in buying these blocks. As previously mentioned, Sonangol has already shown its interest and Petrobras has also been rumoured to be interested in the process. Other interested parties could come from growing economies, such as Brazil and China, as has already happened in the EDP and REN privatization processes. Chinese companies could have a strategic interest in developing their presence in Brazil (following Sinopec’s
example) and Mozambique, whose newly-discovered natural gas reserves can fuel the growth in the nearby Chinese economy. All in all, we may expect some M&A activity in the following months in respect to these selling blocks.
Exploration & Production (E&P)
Market Environment
Oil is the single most important source of energy in today’s economies,
representing approximately 35% of primary energy supply in 20102. It is a key strategic asset, as it has been a main cause for political dispute and military confrontation for the last couple of centuries. Since oil prices depend on a lot of different factors, from supply and demand dynamics, to political and/or military
1 Memorandum of Understanding on Specific Economic Conditionality. May 2011
2 Source: Organization of the Petroleum Exporting Countries (OPEC). “World Oil Outlook2011”
Stalemate in appointment of new administration
M&A activity in the horizon
Oil is a key strategic asset Capital from growing economies could be in the forefront
GALP ENERGIA COMPANY REPORT
THIS
DOCUMENT
IS
NOT
AN
INVESTMENT
RECOMMENDATION
AND
SHALL
BE
USED
EXCLUSIVELY
FOR
ACADEMIC
PURPOSES
(SEE DISCLOSURES AND DISCLAIMERS AT END OF DOCUMENT)PAGE 6/35 decisions, companies operating in this industry are exposed to a especially volatile environment.
Despite the current economic slowdown in Europe and other developed economies, world energy consumption is expected to increase rapidly in the following years. This increase will be fueled by the strong economic growth in non-OECD countries, namely China, whereas OECD countries’ demand for oil is expected to stabilize around today’s values, as they search for alternative, cleaner sources of energy. The boost in demand from non-OECD countries will be supported not only by their economic growth, but especially by high population growth rates and by the development of their transportation sectors. According to OPEC, total primary energy demand will rise 51% between 2010 and 2035, while during the same period oil demand will also increase from 86.8 mb/d3 (87.2 in 2011) to 93 mb/d in 2015 and finally to 110 mb/d in 2035, a total increase of nearly 28%. The USA remain as the leading oil consuming country, representing 27% of world demand, whereas by 2035 this figure is expected to decrease to 20%, while China will account for 17% (from 10% in 2010). On the supply side, OPEC continues to be responsible for the larger share of world production, amounting to 40%, a situation that is likely to continue for some time since most proven oil reserves (80%) are located in these countries. This also means that the industry’s future is subject to a lot of political risks, since many of the countries where these reserves are located are regarded as unstable. Those are the cases of Iran, Iraq, Libya and Algeria, to name a few. The recent turmoil in
the Middle East and North Africa (“Arab Spring”) has been an important factor
pressing oil prices up and further tensions in Iran or Syria could have an amplifying effect. Nowadays, Deepwater4 oil production accounts to nearly 5% of total production. However, 51% of new oil discoveries between 2005 and 2010 were in deepwater and 62% of those were in Brazil. This segment is expected to grow drastically in the following years, spurred by high oil prices that compensate for the higher extraction costs associated to this type of production. However, last
year’s explosion at BP’s Deepwater Horizon facility and other recent accidents in offshore production facilities, such as Chevron’s leak at the Frade field in Brazil,
have been pushing the industry towards tighter regulation on environmental concerns, which could raise the costs associated to deepwater oil production.
Although Galp’s E&P activities spun through 8 different countries (Venezuela,
Brazil, Uruguay, Portugal, Equatorial Guinea, Angola, Mozambique and East
3 Million barrels per day (Bn Toe = Billion tones of oil equivalent) 4 Water depth > 500 metres
Graph 3: World Primary Energy Demand
Source: BP Energy Outlook 2030
Population growth and transportation driving oil demand
Graph 4: Region Share in Oil Proven Reserves
Source: BP Statistical Review of World Energy June 2011
Graph 5: Deepwater Production 2010
Source: OPEC World Oil Outlook 2011, Wood Mackenzie
Environmental concerns to affect the oil industry
Galp’s upstream activities
GALP ENERGIA COMPANY REPORT
THIS
DOCUMENT
IS
NOT
AN
INVESTMENT
RECOMMENDATION
AND
SHALL
BE
USED
EXCLUSIVELY
FOR
ACADEMIC
PURPOSES
(SEE DISCLOSURES AND DISCLAIMERS AT END OF DOCUMENT)PAGE 7/35 Timor), many of its projects are still in their exploratory phase and therefore little is known about how much value, if any, they can generate. Hence, we will only focus on the projects from which Galp is already extracting value or where development plans are already being considered. These projects are located mostly in Brazil and Angola and, more recently, in Mozambique.
Brazil
Brazil is seen as Galp’s main driver of future growth in oil production, especially
from its assets in the Santos basin. Overall, Galp participates in 22 projects in Brazil, across seven different basins, representing (in 2010) 90% of its contingent resources. Most of these projects are located offshore, either in deep or ultra-deep waters, and only five are onshore. Moreover, since many of the basins where Galp has a presence are still in early exploratory or pre-exploratory phases, there is little information on recoverable reserves. Also, due to the small size of onshore fields, we will only consider the company’s main blocks in the
Santos basin, where most of its development projects have been concentrated. It
is nevertheless important to note that Galp’s role as an operator in several
onshore blocks can be a valuable resource for the company in the future. In what concerns the Santos pre-salt, Galp holds participation in four ultra-deepwater blocks. In every one of these blocks, the company partners with Petrobras (PBR), who acts as the operator. In the BM-S-11, BG Group also holds a 25% participation and in the BM-S-8, Royal Dutch Shell has a 20% holding.
Galp’s Brazilian assets are controlled through Petrogal Brazil, where Sinopec
now has a 30% stake. Up until now the only producing field has been Lula (former Tupi) in the BM-S-11, having started in 2010.
The consortium responsible for the BM-S-11 has already elaborated a detailed development program for the block and submitted it to ANP5, consisting on the
contract of 9 FPSO’s6 and up to 300 producing and injecting wells. The project is expected to reach its peak by 2020, when it will have an installed capacity of 1300 kboepd7. Since this is the only project where we have detailed information on investments needed, we use it as a base case for estimations in other blocks.
5 Associação Nacional do Petróleo
6 Floating production storage and offloading 7 Thousand barrels of oil per day
Table 1: Petrogal Brazil Assets and Partners
Source: Galp Energia
Table 2: Brazil recoverable reserves and production start
Source: Galp Energia, Analyst estimates
GALP ENERGIA COMPANY REPORT
THIS
DOCUMENT
IS
NOT
AN
INVESTMENT
RECOMMENDATION
AND
SHALL
BE
USED
EXCLUSIVELY
FOR
ACADEMIC
PURPOSES
(SEE DISCLOSURES AND DISCLAIMERS AT END OF DOCUMENT)PAGE 8/35
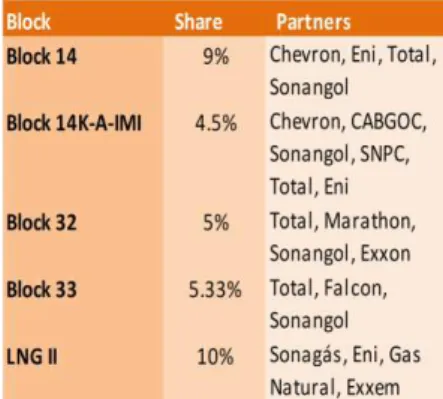
Angola & Mozambique
Angola continues to be Galp’s main source of oil production and, although Brazil is expected to take this place in the coming years, production in Angola is also
expected to increase, reaching its peak by 2020. Currently, Galp’s only producing
block in this geography is Block 14, namely the Benguela-Belize-Lobito-Tomboco (BBLT), Kuito and Tômbua-Lândana fields. The latter is Galp’s biggest project in
this country, contributing significantly to balance the natural decline in the other two fields. It has reached its peak production during the current year, following the completion of the connection of the CPT8 to the subsea centre. Both Kuito and BBLT fields have already entered a declining phase and new development projects to increase their lifetime are under study. Other participations in Angola are in Block 14K-A-IMI (Lianzi), Block 32 and Block 33. Production growth in the country is expected to come from the development of these fields. Similarly to
what happens in Brazil, Galp’s presence in Angola is implemented through joint-participations with other companies. Chevron operates Blocks 14 and 14K-A-IMI and Total operates Blocks 32 and 33. Sonangol is also a partner in all these Blocks. Finally, on top of oil development projects, Galp is also involved in a Liquified Natural Gas (LNG) integrated project which aims at discovering and recovering natural gas reserves in the country and afterwards, if justifiable, the construction of an LNG terminal. The project was named LNG II and is still in its exploratory phase.
Galp’s focus in Angola is now on the development projects for Malange, Lucapa, Negage and Gabela (Block 14), Lianzi (Block 14K-A-IMI) and Kaombo (Block 32). The development plan for Malange and Lianzi consists on a tie-back from subsea centres to the BBLT CPT, in Lucapa the best development alternative is still under consideration and in Kaombo a “split hub” concept was approved,
implying the use of two FPSO’s with joint capacity of 200 kbopd supporting six split development areas.
The recent discovery of a world class natural gas reserve in the Rovuma basin (Area 4) is a very important milestone for the country and for the Eni-operated consortium, in which Galp has a participation of 10%. With estimated reserves of 22.5 tcf9 of natural gas, equivalent to 2.7 Bn boe10, this discovery will support the development of a LNG terminal in Mozambique that will fuel the country’s strong
economic growth prospects and that may also benefit from its proximity to
8 Compliant-piled tower 9 Trillion cubic feet
10 Billion barrels of oil equivalent
Production in Angola to rebound after 2014
Table 3: Galp Angolan Assets and Partners
Source: Galp Energia
Table 4: Angolan recoverable reserves and production start
Source: Galp Energia, Analyst estimates
Mozambique as new geographical focus
GALP ENERGIA COMPANY REPORT
THIS
DOCUMENT
IS
NOT
AN
INVESTMENT
RECOMMENDATION
AND
SHALL
BE
USED
EXCLUSIVELY
FOR
ACADEMIC
PURPOSES
(SEE DISCLOSURES AND DISCLAIMERS AT END OF DOCUMENT)PAGE 9/35 energy-eager Asian markets, namely China. Although this type of project normally takes nearly a decade to develop, Galp has advanced the possibility of production starting before 2020. Eni expects the project to achieve a production rate of 300 kbopd at its peak. Not only does this discovery contribute significantly
to Galp’s gas reserves, but it also diversifies its operations, currently extremely leveraged to Angola and Brazil.
The choice for a LNG facility is due to the fact that conventional transportation of natural gas, through pipeline, is very costly and requires large investments in infrastructure, making it more difficult to reach international markets. This also
translates the global market trend of LNG’s increasing share on total natural gas
supply, as pipeline transportation poses more challenges and constraints and requires for production units to be within a reasonable piping distance to demand centres.
Capital Expenditures
Altogether, we estimate Galp’s total required capital expenditures for the development of the aforementioned E&P projects to amount to c.€26.4 Bn, c.€19.2 Bn of which in Brazil. From this figure, €3.4 Bn are expected to occur until 2015 and c.€14 Bn until 2020, since 2016 and 2019 will be the years when
more investments will be needed in this segment. These values are much higher
than Galp’s accumulated investments of €251 M (by the end of 2009) in Brazil and €759 M in Angola (end of 2010). The estimates were based on a project-by-project analysis, forecasting how much has to be invested in each one of them, considering the amount of recoverable reserves, estimated lifetime of the fields and their geography. The main investments considered for the development of oil
fields were FPSO’s (or other production facilities where applicable), wells,
pipelines and a Liquefied Gas Facility for Mozambique. For Brazilian development projects, we estimated producing well capacity of 30 kbopd with average drilling cost of $200 M and FPSO capacity of 150 kbopd with $1.7 Bn. In Angola, we estimate well drilling costs at $100 M and FPSO capacity at 100 kbopd, due to lower depths of oil location and smaller amount of recoverable reserves, comparing to Brazil. Pipeline average costs are estimated at $1.5 Bn and the LNG facility is expected to cost $14 Bn11 (Eni estimates total investments in Rovuma to reach $50 Bn).
11Estimates based on Kellog Brown & Root’s “LNG Liquefaction –Not all Plants are created equal”
.
Table 5: Mozambican Assets details
Source: Galp Energia, Analyst estimates
LNG facility allows for increased marketability of production
Graph 6: LNG Share in global natural gas trade
Source: IEA World Energy Outlook 2009
Table 6: Galp Capex per Project
Source: Galp Energia, Petrobras, Eni and analyst estimates
Graph 7: Galp E&P Capex 2012-2016
€Million
GALP ENERGIA COMPANY REPORT
THIS
DOCUMENT
IS
NOT
AN
INVESTMENT
RECOMMENDATION
AND
SHALL
BE
USED
EXCLUSIVELY
FOR
ACADEMIC
PURPOSES
(SEE DISCLOSURES AND DISCLAIMERS AT END OF DOCUMENT)PAGE 10/35
Capital Increase in Brazil
Galp’s recent deal with Sinopec has been one of the main events surrounding the Portuguese company during the last couple of months, therefore being worth studying in further detail.
The deal consisted on the sale of 30% of Galp’s position in Petrogal Brazil, the vehicle through which the company controls its Brazilian assets. Galp had long been announcing its intention to sell up to 50% of its position in Petrogal Brazil
for a minimum amount of €2 Bn in order to be able to keep up with the required investments for the development of the Brazilian oil fields where it holds participations, while mitigating its extremely high Net Debt-to-Equity ratio of 105%. After a rather secretive period of negotiations (only additional information was that there were two alternative bidders, one European and other also from the Far East12), Sinopec ended up buying the 30% stake in Petrogal Brazil for a total of $5.19 Bn, divided between a $4.8 Bn capital increase and $390 M used
for the repayment of Galp’s loans to its Brazilian subsidiary. All in all, the deal valued Petrogal Brazil at $17.3Bn and Galp’s stake at $12.11 Bn. It is also worth mentioning that there is no real cash inflow to Galp, other than the $390M loan
repayment. Although the company’s net debt falls sharply, this only happens for accounting reasons, since Galp continues to fully consolidate Petrogal Brazil, meaning that the $4.8 Bn from Sinopec are accounted as minorities (there is no
increase in Galp’s equity).
Much has been said about the outcome of this deal, with most analysts arguing the Chinese company had actually underpaid, when compared to similar deals, such as the Chinese company’s acquisition of a 40% stake in Repsol’s positions
in Brazil, back in 2010. Sinopec paid nearly $7.1 Bn to Repsol, corresponding to $5.68 per barrel13 (bbl). Applying the same approach14 to the Galp-Sinopec deal, we estimate the embedded transaction multiple at $4.34/bbl, a figure way below the $5.43/bbl we would expect from our valuation estimates. The difference between these figures may explain the strong negative reaction from Galp’s
investors to this deal and it is important to go through the possible reasons for this apparent low price. The first possible explanation that immediately arises when analyzing this deal is the fact that Galp appears as a forced seller due to
constraints on its Balance Sheet. “Fire sales” usually come out at lower prices
12Galp Energia’s share capital increase in Brazilian subsidiary conference call
13 3P Reserves, Contingent Resources (3C) and mean estimated risked prospective resources amounting to a total of 2.88 Bn bbl.
14 Methodology based on Howard, Alex W.; and Harp, Alan B., “Oil and Gas Company Valuations”; Business Valuation Review; Volume 28 -
Number 1; American Society of Appraisers; 2003 Funding solution consisting
on the sale of 30% of Petrogal Brazil
Net Debt-to-Equity now below long-term target
Improved financial ratios due to accounting method used for consolidation
$4.8Bn from capital increase accounted as minorities
Deal outcome falls short when compared with similar operations
GALP ENERGIA COMPANY REPORT
THIS
DOCUMENT
IS
NOT
AN
INVESTMENT
RECOMMENDATION
AND
SHALL
BE
USED
EXCLUSIVELY
FOR
ACADEMIC
PURPOSES
(SEE DISCLOSURES AND DISCLAIMERS AT END OF DOCUMENT)PAGE 11/35 when compared to standard negotiations where the seller is not under great financial pressure. Furthermore, Sinopec is buying a non-controlling stake of Petrogal Brazil and the latter is not even a controlling party in most of its projects, since Petrobras operates almost all of them, therefore holding the decision initiative. Hence, there is no control premium embedded in this transaction. Other
issues that may have impacted the value of the deal is Sinopec’s probable
inability to channel a lot of this Brazil-based oil to its domestic oil-hungry
economy and finally, the fact that Galp’s Brazilian oil fields are gassier than Repsol’s ones, meaning that there is less value per barrel to be extracted.
Although these issues, all summed together, could justify the low price paid by Sinopec, there are also matters that work in the opposite direction. To begin with, Brazilian oil appears as a very attractive strategic asset to Sinopec. In the one hand, the Chinese refining giant has limited domestic growth opportunities and, on the other hand, Brazil offshore represents a tremendous driver of future worldwide oil production. In fact, Sinopec (and other Chinese oil operators) have been investing heavily in South American oil production.
To sum up, although the deal appears to have occurred at a low price, Galp did not have much leeway, since it did have the need to improve its financial conditions and alternative sales of other operations did not seem probable to achieve the same outcome, due to the current economic environment in Europe.
Valuation
In our valuation of E&P projects, we followed a Discounted Cash Flow (DCF) approach, using the Adjusted Present Value (APV). This means that we computed free cash-flows generated from each project and discounted them at the unlevered cost of equity, afterwards summing the present value of tax shields. This allows us to separate the value created from operations from the one created through leverage. Although the APV method also accounts for bankruptcy costs15, we regard default as an unlikely scenario and we do not consider these costs in our valuation of upstream operations. Projects are valued
through the operator’s perspective, meaning that, for example, for each field being valued, we use estimated operational costs for the respective operator. From the total value of each field, we allocate the relevant share to Galp, according to its participation in the respective project. Even if Galp does not have the financial flexibility to follow the required investments for the developments of the fields, it will be able to sell its share, expectedly at or near its market price.
15 Bankruptcy costs = Present Value (bankruptcy costs) x probability of default Graph 8: E&P Operating Costs
Source: Petrobras, Chevron, Analyst estimates
Possibility of selling further stakes in the future if in financial need
Forced sale of a
non-controlling stake may justify lower price
Brazil and South America as strategic geographies for Chinese oil companies
Galp’s Brazilian oil has larger percentage of gas
GALP ENERGIA COMPANY REPORT
THIS
DOCUMENT
IS
NOT
AN
INVESTMENT
RECOMMENDATION
AND
SHALL
BE
USED
EXCLUSIVELY
FOR
ACADEMIC
PURPOSES
(SEE DISCLOSURES AND DISCLAIMERS AT END OF DOCUMENT)PAGE 12/35 Free cash-flows were computed taking into account expected time for first oil, lifetime of reserves (assumed 25 years) until exhaustion, future oil prices and operational costs (include lifting and F&D16 costs). We also take into account different types of exploration contracts, namely Concessions (Brazil and Mozambique) and Product Sharing Agreements (Angola)17. We estimate long-term dated Brent prices at $110/bbl. Although current future contracts for dated Brent point towards lower values in the medium-term, the consensus among analysts is that oil prices will increase substantially (Appendix 1). The difference in expectations is due to present uncertainties regarding the world’s economic
performance in the next few years. However, the fact that demand for oil is expected to increase and that this is an increasingly scarce resource supports
both the consensus’ and our own view on the evolution of Brent prices. Brazilian oil should trade at a 5% discount to Brent and Angolan oil at 3%, due to differences in API gravity18. Finally, we forecast operational costs to increase following the peak production in each field, due to greater difficulties in the recovery process.
In what regards the Rovuma project, we estimated natural gas prices on an oil-parity basis. Although usually natural gas is traded through long-term contracts or in the spot markets, oil-parity contracts are very common in Asia, which we expect to be one of the preferential markets to Mozambican gas (LNG represents 90% of gas imports in Pacific Asia). This means that natural gas produced in the Rovuma basin will be sold on an energy-equivalent basis with crude. We assume a constant bbl/mmbtu19 relation and a natural gas - oil parity of 16% (%/mmbtu).
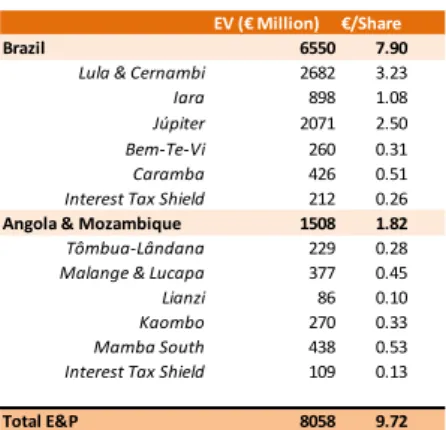
Hence, we value Galp’s E&P assets at €9.72/share20.
16 Finding and development
17 In Concessions, the State is entitled to a percentage of overall production (10%), plus the taxable income and possibly a Special Participation Tax
(SPT), depending on the amounts produced, that can go up to 40%. In PSA contracts, the Concessionaire allows the Contractor to recover part of their costs and capex(cost oil), and the remaining production in shared by the two parties (Profit Oil). An income tax is then paid over Profit Oil.
18 American Petroleum Institute. API gravity measures how heavy or light is oil when compared to water. The higher the API, the lighter is the
petroleum liquid.
19 Million British thermal units
20 Further detail on valuation and discount rates in the Sum-of-the-Parts section of this text
We assume different
discounts to Brent depending on specific API gravity
We frame natural gas production following an oil-parity approach
Graph 9: Galp’s working interest production
Source: Galp Energia, Analyst estimates
Graph 10: Galp’s E&P EBITDA
GALP ENERGIA COMPANY REPORT
THIS
DOCUMENT
IS
NOT
AN
INVESTMENT
RECOMMENDATION
AND
SHALL
BE
USED
EXCLUSIVELY
FOR
ACADEMIC
PURPOSES
(SEE DISCLOSURES AND DISCLAIMERS AT END OF DOCUMENT)PAGE 13/35 Table 7: E&P Valuation Summary
Source: Analyst estimates
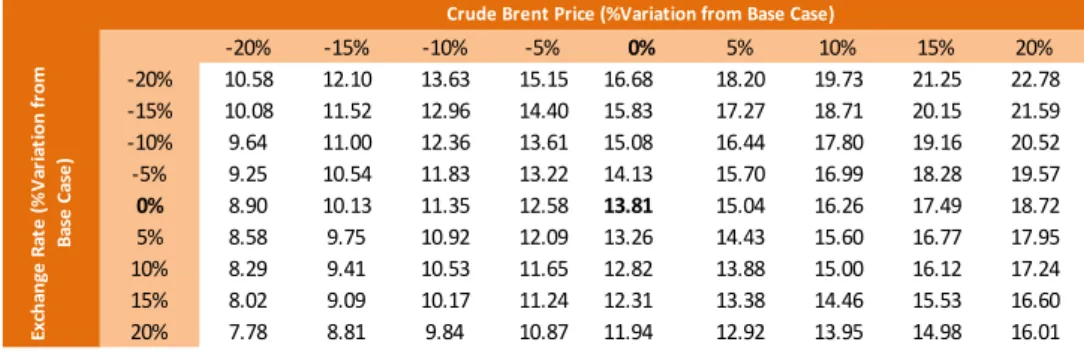
Sensitivity Analysis
In what regards the E&P segment, we consider our assumptions concerning the
future price of Brent crude oil and USD/Euro ($/€) exchange rate as the variables
that have the potential to contribute to a higher change in our price target. These two key variables also affect, on a smaller scale, other segments21, but we reckon it is in the E&P business where they produce more variations.
Upstream projects’ profitability depends a lot on oil prices, since they directly
impact revenues. Since it is extremely difficult to accurately predict future Brent prices, it becomes even more important to perform this type of analysis.
Table 8: Deviations in price target due to changes in Brent price
Source: Analyst estimates
The USD/Euro exchange rate is especially relevant in this segment because most cash flows happen in US dollars, which means that a depreciation of the dollar (increase in exchange rate) leads to a sharp decrease in our price target.
Table 9: Deviations in price target due to changes in USD/Euro exchange rate
Source: Analyst estimates
21 Further analysis on this issue is performed in the Sum-of-the-Parts - Sensitivity Analysis section of this text. EV (€ Million) €/Share
Brazil 6550 7.90
Lula & Cernambi 2682 3.23 Iara 898 1.08 Júpiter 2071 2.50 Bem-Te-Vi 260 0.31 Caramba 426 0.51 Interest Tax Shield 212 0.26
Angola & Mozambique 1508 1.82
Tômbua-Lândana 229 0.28 Malange & Lucapa 377 0.45 Lianzi 86 0.10 Kaombo 270 0.33 Mamba South 438 0.53 Interest Tax Shield 109 0.13
Total E&P 8058 9.72
-20% -15% -10% -5% 0% 5% 10% 15% 20%
8.90 10.13 11.35 12.58 13.81 15.04 16.26 17.49 18.72 Crude Brent Price (%Variation from Base Case)
-20% -15% -10% -5% 0% 5% 10% 15% 20%
16.68 15.83 15.08 14.13 13.81 13.26 12.82 12.31 11.94 Exchange Rate (%Variation from Base Case)
Dated Brent prices and $/€
exchange rate may cause significant deviations in the price target
USD depreciation
corresponds to lower price target
GALP ENERGIA COMPANY REPORT
THIS
DOCUMENT
IS
NOT
AN
INVESTMENT
RECOMMENDATION
AND
SHALL
BE
USED
EXCLUSIVELY
FOR
ACADEMIC
PURPOSES
(SEE DISCLOSURES AND DISCLAIMERS AT END OF DOCUMENT)PAGE 14/35 Finally, the fact that Galp does not operate most of its upstream projects creates an additional level of uncertainty, since the company does not have the power to decide when, where and how much to invest and produce at each moment in time. Therefore, it is important to assess the potential impacts of a postponement or anticipation of development projects by their operators, all else equal.
Table 10: Deviations in price target due to different oilfield development schedules
Source: Analyst estimates
Refining & Marketing (R&M)
Market Environment
The global financial end economic crisis that hit the world in 2008 has caused oil markets to shrink for two consecutive years. In 2011, the oil market continued to recover, with demand returning to pre-crisis levels. The lower demand in recent years, aligned with downstream capacity additions, has lead to declining utilization rates and negative refining margins, causing refining facilities to consistently generate negative cash-flows for companies. The supply surplus is expected to widen in the following years, as developing countries, especially in Asia and in the Middle East, will be growing additional net refining capacity. According to OPEC, refining surplus could approach 10 mb/d by 2015. Therefore, refining margins are expected to remain depressed by low utilization rates of existing and new facilities, since low capacity utilizations are synonymous to low refining margins. An important pattern concerning future demand for oil products is the shift towards middle distillates and light products, reflecting the increasing importance of the transportation sector. By 2035, demand for diesel could reach
36 mb/d, against 2010’s 25 mb/d. Another trend that reinforces this effect is that most additional capacity being created in emerging economies will happen
through NOCs’22 investments, meaning that it is not driven solely by economic returns, but instead by strategic reasons, such as enhancing national energy security (decreased dependence on energy imports) or extending overseas influence (e.g.: China’s investments in refineries in Africa enhances its political
influence in that region). In other cases, such as Brazil, refining capacity
additions are part of an “own the entire barrel” strategy, with countries trying to
22 National Oil Companies
-1 0 1 2 3 4 5
14.33 13.81 13.23 12.71 12.24 11.81 11.42 Oil Field Development Postponement /Antecipation (#Years)
Financial crisis has hit global oil markets
Graph 12: Global oil product demand
Source: OPEC world oil outlook 2011 Galp is subject to operators’
decisions in development projects
Graph 11: Oil crack spreads
GALP ENERGIA COMPANY REPORT
THIS
DOCUMENT
IS
NOT
AN
INVESTMENT
RECOMMENDATION
AND
SHALL
BE
USED
EXCLUSIVELY
FOR
ACADEMIC
PURPOSES
(SEE DISCLOSURES AND DISCLAIMERS AT END OF DOCUMENT)PAGE 15/35 extract the whole value from each barrel produced, instead of recovering the oil, selling it on international markets and then importing transformed oil products. Therefore, low refining margins are not necessarily a deterrent to new capacity formation. Another trend that can be predicted is the fact that additional capacity will be created near demand centers, basically in growing economies, where transportation-led oil demand is expected to increase sharply, mostly in non-OECD countries. Therefore, it will become increasingly difficult for refineries located in Europe to achieve high utilization rates (hence higher margins), since demand for oil in this region is estimated to remain flat.
European Refining Industry
In fact, since 2005 OECD countries’ average refinery utilization has been lower
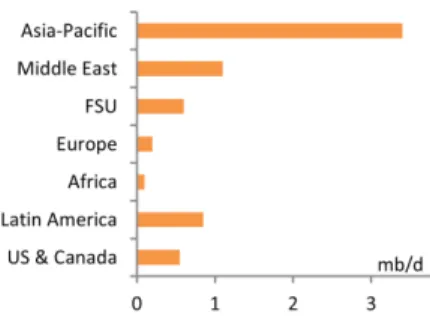
than in emerging markets and Europe follows that pattern. In 2010 average refinery utilizations in OECD and Non-OECD countries were, respectively, 84% and 89%. In 2011, Europe was the largest refined products net importer, with 1,252 kbopd of net imports. Middle East and Former Soviet Union countries remain as the largest net exporters. The dieselization process Europe has been facing is the main cause for it being a net importer of refined products whilst having excess capacity. In fact, although fiscal incentives were created to foster this trend, there has not been a corresponding investment to adapt refining facilities to this reality, eventually creating a mismatch between supply and demand. Illustrating the current dieselization process, we may observe that consumption of light products in the European demand mix has decreased from 27% in 2000 to 22.5% in 2010, while middle distillates have increased from 43% to 50.5% within the same period. The sharp increase of middle distillates is a trend that will be maintained in short-medium term, but could be reversed in the long-term, due to expected higher taxation of diesel products in the EU, justified by higher CO2 emissions per liter. In fact, diesel has been benefitting from “unfair competition” between fuels in Europe, created by the directives that impose minimum taxation of energy products based on volumes. Since gasoline has lower energetic content than diesel, it carries a higher taxation burden, despite generating 22% less CO2 emissions per liter. This type of taxation has led to the current situation, where open market prices of diesel are higher than those of gasoline, but retail prices are reversed. Therefore, the new directive (should enter in effect by 2013), imposes minimum taxation based on CO2 emissions rather than on volumes, possibly reverting the incentive for dieselization. Nevertheless, it is important to stress that the directive imposed minimum taxes, which means Graph 13: Distillation capacity additions
from existing projects 2012-2015
Source: OPEC world oil outlook 2011
Graph 14: Refinery utilization (average)
Source: Galp Energia, Analyst estimates Graph 15: Oil Product demand in Europe
Source: OPEC world oil outlook 2011
Table 11: Gasoline and Diesel characteristics
GALP ENERGIA COMPANY REPORT
THIS
DOCUMENT
IS
NOT
AN
INVESTMENT
RECOMMENDATION
AND
SHALL
BE
USED
EXCLUSIVELY
FOR
ACADEMIC
PURPOSES
(SEE DISCLOSURES AND DISCLAIMERS AT END OF DOCUMENT)PAGE 16/35 that member countries may continue to impose larger taxation on gasoline, as long as they comply with the directive-imposed taxation on diesel. Actually, many European countries are already taxing diesel above this minimum proposed rate and will not have to make changes. Hence, the effect of this directive is expected to be very limited in the medium-term, becoming more perceptible after 2020. Within this context, few capacity additions (0.2 mb/d until 2015) are expected in Europe in the upcoming years, with the focus going to conversion projects aiming at a better adaptation of production to demand.
As for Iberian countries, both are net importers of oil products, especially of diesel, although they are net exporters of gasoline. This is mostly due to the fact that, inserted in the dieselization process in Europe, demand for middle distillates has increased consistently in both Portugal and Spain. The underinvestment in refining facilities has caused an increasing mismatch between the refinery outputs and demand for oil products. In 2009, Portugal imported (net) 23 kb/d of diesel, whereas in 2010 Spain imported the net amount of c.210 kb/d of diesel.
Refining Activities
Iberian refining patterns follow closely what happens at European level, meaning that refining margins have been under pressure lately, following a decrease in demand for oil products caused by the economic downturn. Lower demand has contributed to lower capacity utilizations and consequently lower margins. Nevertheless, Galp has been able to sustain better margins than its benchmarks (Rotterdam cracking refining margins and Rotterdam hydroskimming refining margins), despite the fact that its utilization rates were lower than the European average. This is due to the fact that, although Galp’s margins are influenced by
what happens in international markets (shifts in prices are almost parallel23), there are also other factors that can provide competitive advantages to some refining companies, enabling them to appropriate margins above market standards. In the case of Galp, we identified location as the main factor for its higher margin since, on the one hand, the coastal character of the Portuguese
territory allows for easy access to VLCC’s24 and, on the other, Galp
’s refineries are relatively close to demand centers and the company has exclusive access to oil terminals in the two Portuguese ports with enough capacity to receive large quantities (Sines and Leixões). The lack of cross-border pipelines for the import of oil means there is virtually no other commercially viable way of bringing oil into
23 Source: Autoridade da Concorrência (AdC). 24 Very-large crude carriers
Graph 17: Refining margins
Source: Platts, Galp Energia
Graph 16: Iberian Net Imports/Exports of diesel and gasoline
Source: IEA Oil & Gas Security 2011
Exclusive access to
Portuguese ports’ oil
GALP ENERGIA COMPANY REPORT
THIS
DOCUMENT
IS
NOT
AN
INVESTMENT
RECOMMENDATION
AND
SHALL
BE
USED
EXCLUSIVELY
FOR
ACADEMIC
PURPOSES
(SEE DISCLOSURES AND DISCLAIMERS AT END OF DOCUMENT)PAGE 17/35 the country. Moreover, according to IEA25, Galp holds all the storage capacity of crude oil and around 48% for oil products in Portugal. Although the AdC, in its report about competition in the Portuguese oil market (2008), has provided a recommendation for the Portuguese Government to create conditions for the easier access of other operators to infrastructure (such as port terminals and storage facilities), the agreements between Iberian operators in what respects logistics and supply and their symmetric relationships (supplier – client) in the various markets where they operate simultaneously (e.g.: Galp supplies the three other main operators in Portugal and they supply Galp in Spain), block this intention.
Refining Assets and Upgrade Project
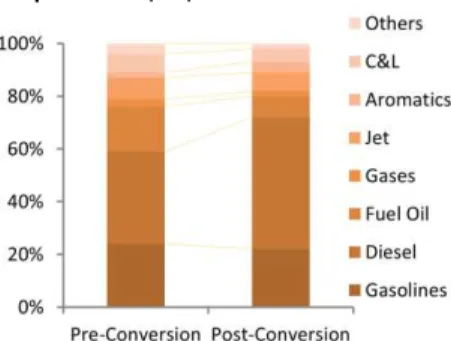
Despite these competitive advantages, refining margins have still been under pressure for reasons already mentioned. In this context, Galp’s conversion
project for its two refineries, Sines and Matosinhos, is an important step towards the improvement of their profitability. This project represents the largest private sector investment ever made in Portugal, amounting to a total of €1.4 Bn, 75% of
which in the Sines refinery and the remainder 25% in Matosinhos. This project
aims at optimizing the refineries’ capacity utilization by achieving a better match between production and demand for oil products or, in other words, to increase production of diesel (and decrease the share of fuel oil). It will also allow for higher flexibility on the choice of crude oils to be processed, which can be considered as a further competitive advantage to the company. Refining margins are expected to improve through higher utilization rates, larger share of medium and heavy crude oil (up to 70%) in the total crude processing and change of production profile, by raising the share of diesel output to 50%. By the end of the project, Matosinhos (Hydroskimming-type facility) and Sines (Cracking typology), will have enhanced NCI’s26 of 10.7 and 7.7, respectively. Although the Sines refinery processes heavier crude, Matosinhos’ produces a superior slate of lighter, higher-value products, such as aromatics and other light and medium distillates and a lower percentage of fuel oils. Also, it enjoys higher flexibility in the choice of output, thus the difference in NCI’s. All in all, refining margins are expected to improve gradually by $3 per barrel (below Galp’s initially estimated
$3.5/bbl) and overall capacity will reach 330 kbopd, corresponding to approximately 18.5% of Iberian refining capacity (Appendix 2). Furthermore, the
25 International Energy Agency
26 Nelson Complexity Index Graph 18: Galp’s product mix
Source: Galp Energia, analyst estimates
Conversion project to improve refining margins
Table 12: Iberian Refining Capacity
Source: Repsol, Cepsa, Galp, BP, analyst estimates
Cross-relationships between largest operators obstructs intention for the sharing of infrastructure
GALP ENERGIA COMPANY REPORT
THIS
DOCUMENT
IS
NOT
AN
INVESTMENT
RECOMMENDATION
AND
SHALL
BE
USED
EXCLUSIVELY
FOR
ACADEMIC
PURPOSES
(SEE DISCLOSURES AND DISCLAIMERS AT END OF DOCUMENT)PAGE 18/35 project will allow Portugal to become a net exporter of diesel, positively impacting
the country’s trade balance. Although the upgrade should be totally operational by the end of 2011, works in Sines have suffered a three month delay. Therefore, impacts on earnings are only expected for the second quarter of 2012.
Marketing Activities
Galp’s marketing of oil products activities are developed mainly in the Iberian
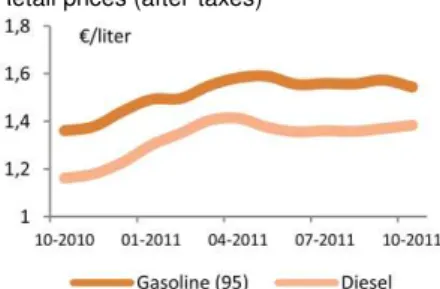
Peninsula and in several African countries, through the wholesale, retail and LPG27 channels. This business segment has the characteristic of being more stable in terms of earnings generation. Since oil-derived products are crucial for consumers’ quality of life (e.g.: transportation), it is difficult for them to adapt and find a suitable substitute, meaning that demand is highly inelastic. Although prices on costumer are subject to fluctuations of oil prices in international markets, there is a time lag (average one week in Portugal28) between a price movement and it being reflected in the price consumers pay. In other words, when crude oil prices change, it takes about a week for the seller to adjust its margin to that movement. Other reason for the inelasticity in demand is that there are no real differentiating factors between the several sellers other than location. In the retail channel, for example, different service stations in the same city may practice different prices, depending on whether they are located in the centre or in the outskirts. Recent studies29 on the Portuguese retail sector show a dominating trend for small refuels instead of larger ones, meaning that people usually seek the nearest service station available and use low-cost retailers30 for larger refuels, namely on weekends. The same studies also indicate that, as austerity policies in Portugal increasingly affect consumers’ individual budgets, demand has been becoming less inelastic, with larger cuts in consumption in response to increases in prices and a shift towards low-cost retailers, now representing c.20% of the retail market.
The Iberian market of oil products is composed of four main players, namely Galp, BP, Cepsa and Repsol. The remainder of the market is composed by Independent retailers and super/hypermarkets, with the latter competing in prices with the 4 integrated oil companies by selling “low-cost fuel”. By setting the lowest prices at the location where they operate, these low-cost retailers appropriate consumers from nearby service stations, especially for large refuels.
27 Liquefied Petroleum Gas
28 Source: Autoridade da Concorrência 29 Kantar Worldpanel (2011)
30 Intermarché, Ecomarché, E.Leclerc, Modelo Continente, Auchan.
Delay in completion of upgrade works postpones
impact on company’s
earnings
Inelastic demand ensures stability in earnings
Location is the most relevant differentiating factor, but price has been gaining importance during the crisis
Graph 20: Galp’s Direct Sales
Source: Galp Energia, analyst estimates Graph 19: Geographic distribution of
Galp’s Direct Sales (2010)
Source: Galp Energia, analyst estimates
GALP ENERGIA COMPANY REPORT
THIS
DOCUMENT
IS
NOT
AN
INVESTMENT
RECOMMENDATION
AND
SHALL
BE
USED
EXCLUSIVELY
FOR
ACADEMIC
PURPOSES
(SEE DISCLOSURES AND DISCLAIMERS AT END OF DOCUMENT)PAGE 19/35 Overall, the Portuguese oil market in 2010 was estimated to amount to 10.3 Mton31, while the Spanish market is much larger, with 58.7 Mton. In 2010, Galp attained a 34% market share in the Portuguese retail market and 6% in Spain, whereas in the wholesale segment, the company had a 15% market share at Iberian level and 50% in Portugal alone. Its presence in the Spanish retail market
has been fostered by the acquisition of Agip and ExxonMobil’s operations in the
country, back in 2008. Both markets have contracted during the first three months of 2011, pressured by the sovereign debt crisis hitting Iberian economies. Whilst the Portuguese oil market suffered a contraction of 6%, the Spanish declined by 2%. This downward trend is expected to continue through 2012. On the same context, a trend of retail consumption towards low-cost oil products may challenge the market positioning of the four integrated oil companies operating in Iberia. Nevertheless, integrated companies have the advantage of refining their own products, which supermarkets cannot, and thus have a higher degree of leverage in managing their retail margins. As supermarkets have to buy refined products from these companies, this price competition is limited. Once it does not compensate for refining companies to sell their products to supermarkets and independents, they may simply cut this supply channel. Hence, there is an incentive towards cooperation.
To sum up, the Marketing segment has been Galp’s “cash cow” over recent years (except for 2008, due to the acquisition of Agip and ExxonMobil’s activites),
since the company has been able to retain an important market share in a fairly stable business. This generation of stable cash flows has been channeled to investments in the E&P segment.
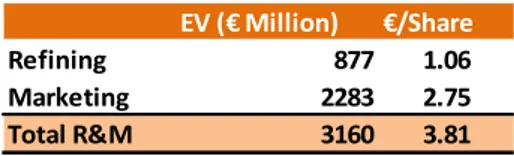
Valuation
In our valuation of Galp’s Refining & Marketing segment, we followed the approach of valuing separately the two activities. Although they make sense as an integrated business, they are subject to different value drivers, which can be better assessed when valuing these activities on a standalone basis. Nevertheless, we use a DCF approach to value both Refining and Marketing activities, using the wacc as a discount rate. An important input that we included in our valuation is a “Country Beta” that amplifies the standard “Market Beta”, reflecting the increase in systematic risk of operating in the Iberian market, heavily constrained by the current financial crisis. Finally, no significant capital
31 Million tonnes
Low-cost fuels challenge
major operators’ positioning,
but price competition is limited
Stable cash-flows from Marketing support investments in upstream
Table 13: Valuation assumptions for R&M
Source: Analyst estimates
Graph 21: Portugal oil products Average Retail prices (after-taxes)
Source: AdC monthly report on oil market
Graph 22: Domestic (PT) demand for motor fuels