Investment determinants at the firm-level: the case of
Portuguese industrial SMEs
Luís Pacheco
REMIT – Research on Economics, Management and Information Technologies Economics, Management and Informatics Department
Universidade Portucalense – Infante D. Henrique
Rua Dr. António Bernardino de Almeida, 541, 4200-072 Porto, Portugal Tel: +351 225572000
Email: luisp@uportu.pt
Abstract
The objective of this paper is to empirically determine the investment determinants at the firm level. Many empirical papers studied the investment determinants from a macroeconomic point of view but the analysis of the main investment determinants from an internal point of view has been less studied. This paper fills that gap, particularly for the case of Portugal, focusing on industrial SMEs. Using a panel data methodology and considering an unbalanced sample of 2456 Portuguese manufacturing SMEs for the period 2011-2015 our results indicate that SMEs with higher profitability, debt and liquidity and of smaller size tend to present higher levels of investment. This exploratory paper gives a contribution to clarify which are the main internal determinants of firms’ investment, which is an important issue not only for managers but for all the stakeholders, particularly the policymakers.
Keywords: Investment determinants, Small and medium enterprises, Panel-data methodology, Investment decisions, Portugal
1 INTRODUCTION
Investment expenditures are crucial to enhance growth and productivity, particularly in economies dominated by the presence of small and medium enterprises (SMEs). Due to the importance of investment to the growth path of the economy, several studies analyzed the investment behaviour from a macroeconomic perspective, often focused on large and developed economies. However, albeit being an undoubtedly important issue for policymakers (e.g., ECB, 2013; European Investment Bank, 2016), studies focused on the firm-level investment performance are scant.
The present paper is not focused on the investment determinants from a macroeconomic point of view but rather on the internal determinants of investments made by SMEs. Though several studies have advanced our understanding of firms’ investment determinants, we think that there is a lack, at least in Portugal, of firm-level analysis linking a set of internal variables and characteristics with investment performance. If a firm financial situation can affect its investment spending, thus at an aggregate level contributing to aggravate recessions or to inhibit economic recoveries, this issue assumes a greater relevance in a context of depressed economic conditions (ECB, 2013).
According to the Free Cash Flow theory (Fazzari et al., 1988; Fazzari and Petersen, 1993), internal financial conditions, particularly cash flow levels, are important determinants of firms’ investments. This importance increases as firms are more restricted in the access to credit, as a consequence of the information asymmetry problems present in the relationship between firm owners/managers and its creditors. The information asymmetries and agency costs thus justify that investment decisions could depend on firm’s internal financial characteristics.
This paper contributes to the research using a panel data methodology and considering an unbalanced sample of 2456 Portuguese manufacturing SMEs for the period 2011-2015, with a total of 108.548 observations. The hypotheses tested in this paper have been sparsely tested in other country contexts and time periods, being this paper one of the first to test them for different sectors of Portuguese industrial firms and differentiating between long-term and short-term debt, concluding that profitability, debt, size and liquidity are relevant determinants of investment intensity.
The rest of the paper is structured as follows. The next section presents a literature review about financial factors’ impact on investment, ending with the justification for choosing Portuguese industrial SMEs. Section three presents the hypotheses to be tested and section four the methodology and data to be used. The fifth section outlines the empirical results, followed by a section with its discussion, and a final section presents some concluding remarks.
2 LITERATURE REVIEW
2.1 Firm level investment determinants
Financial determinants play a limited role in traditional models of investment but the relation between investment and financing decisions constitutes a central issue in corporate finance. According to the neoclassical theory of optimal capital accumulation, firms choose inputs of capital (and labour) in order to maximize the present discounted value of their income streams, with financial factors entering only through the cost of capital, which, in turn, is independent of the way the firm finances itself. This independence arises because capital markets are assumed to be perfect (Modigliani and Miller, 1958), thus, investment is not constrained by the availability of adequate cash flows nor the firm’s financial characteristics influence its cost of capital. There are several reasons to believe that this independence between real and financial factors would not occur in practice. Firms’ financial choices may affect their investment decisions because taxes, issuance costs, agency conflicts and information problems associated with debt and equity will affect the cost of capital, creating a difference between the cost of internal and external funds and changing managers’ incentives to take different types of projects.
Financial factors are generally included in standard investment models through information asymmetries or agency costs. The introduction of these assumptions helps explain how a given level of investment will be funded and how a firm’s financial position will influence its investment (Gertler and Gilchrist, 1994).
Informational asymmetries, where managers have more information about a firm than potential debt or equity holders, turn it difficult for potential creditors and equity holders to evaluate the prospects of different firms. If creditors cannot distinguish between good and poor quality potential borrowers then good quality borrowers would eventually be charged a higher interest rate than they would in a perfect information market (Akerlof, 1970; Greenwald and Stiglitz, 1990). Similarly, new equity issues may trade at a discount to their value implied by the underlying prospects of a firm (Myers and Majluf, 1984). The firm may also face agency costs, that is, costs borne by owners of the firm resulting from potential conflicts between managers, debt holders and equity holders (Jensen, 1986; Harris and Raviv, 1991). The
effect of these information problems is to boost the cost of external finance relative to internal finance (Aggarwall and Zong, 2006). These cost differentials provide some insights into how a given level of investment will be funded, that is, explain the preference for a financing hierarchy where cash flows will be preferred to debt which, in turn, will be preferred to new equity issuance. Thus, the theoretical extent of asymmetric information problems and agency costs can be shown to be a function of the structure of a firm’s balance sheet, which influences its investment decisions, with shocks to the balance sheet altering the evolution of investment over time.
Even firms with access to external funding will rely more heavily on cash flows as a source of finance. There are direct costs involved in raising external funding, such as underwriting and administrative fees and there are also potential financial distress costs associated with using external finance. Finally, issues of taxation, shareholder dilution, control of information, need to maintain flexibility and liquidity may also have an impact on a firm’s financing choices (Eriotis et al., 2007).
As stated by Lewellen and Lewellen (2016), theoretically, the positive influence of cash flow on investment could be explained by three reasons: i) internal funds are less costly than external funds; ii) managers may overspend available internal funds; and iii) cash flow may be correlated with investment opportunities. Thus, the investment-cash flow sensitivity can be interpreted as a consequence of financial constraints (Fazzari et al., 1988; Bond and Meghir, 1994; Schiantarelli, 1996; Alti, 2003; Allayannis and Mozumdar, 2004; Gatchev et al., 2010) or the result of managerial risk aversion to excess debt and managerial discretion and overinvestment (Vogt, 1994; Chirinko and Schaller, 1995; Kaplan and Zingales, 1997; Degryse and De Jong, 2006).
In a study of manufacturing firms in Belgium, France, Germany and the United Kingdom, for the period 1978-1989, Bond et al. (2003) conclude that cash flow is more important for funding investment in UK firms than in the other countries. Thus, economies with market-based financial systems seem to face greater difficulties in canalizing funds to firms’ investment than economies with bank-based financial systems.
As stated by Martínez-Carrascal and Ferrando (2008), several studies have criticized the empirical tests based on the cash flow sensitivity as meaningful evidence on favour of the existence of financing constraints. For instance, Gomes (2001) shows that the existence of financing constraints is not sufficient to establish cash flow as a significant regressor in a standard investment equation, while Ericson and Whited (2000) evidence that the investment sensitivity to cash flow in regressions including Tobin’s Q is to a large extent due to a measurement error in Q. Notice that, regarding Tobin Q theory (Tobin, 1969), if firms’ market value is higher than the value of their assets, i.e., if the Tobin Q ratio is above 1, firms tend to increase the level of investment. If the Tobin Q is below 1, the inverse happens, with firms reducing their level of investment. Finally, Gatchev et al. (2010) develop a multi equation model where firms make financing and investment decisions jointly subject to the constraint that sources must equal uses of cash. Their results evidence that when facing cash flow shortfalls firms maintain their investments by borrowing. Recently, Lewellen and Lewellen (2016) show that for US firms from 1971 to 2009 financing constraints and free cash flow problems are important for investment decisions.
Given that the degree of asymmetric information and agency costs depends on firm characteristics, certain firms may be more sensitive to financial factors than others. For instance, smaller firms are generally considered to be more sensitive to changes in financial conditions. External funds tend to be relatively more expensive to them because providers of finance have less information about their creditworthiness, so that cash flows may be an important and sometimes unique source of funds for investment (Fazzari et al., 1988; Kadapakkam et al., 1998). Nevertheless, larger, thus probably more mature firms may reduce their investment levels, potentially due to the firm’s technological decreasing returns to scale and/or increasing returns to scale in the cost of external financing, thus yielding a negative relation between size and investment (Gebauer et al., 2017).
In this paper we will focus not only on the link between investment and cash flow/profitability but also on other balance sheet indicators. Debt overhang models explain why more or less leveraged firms may be reluctant to use debt, albeit much less empirical work has been done on the analysis that variables such as indebtedness or debt burden have on firm’s investment decisions. Whited (1992) shows that the investment of highly leveraged firms may be more sensitive to cash flows than that of firms with lower leverage. The increased debt servicing obligations resulting from higher leverage mean that the available cash flows are smaller and firms have less of a buffer against disturbances. So, it could be expected a negative relationship between investment and debt servicing. Also, Cantor (1990) shows that investment is more sensitive to earnings for highly leveraged firms and Lang et al. (1996) show that investment relates, respectively, negatively and positively, with leverage and cash flow. On the contrary, Kopcke and Howrey (1994) using balance sheet variables as separate regressors in the investment equation argue that those variables are not important and Chen and Chen (2012) argue that investment-cash flow sensitivities have completely disappeared during the 2007-2009 credit crunch.
Considering that various studies conclude that SMEs financing decisions are in accordance with the predictions of pecking order theory, it could be expected that, when internal cash flow is insufficient SMEs with higher levels of investment depend on debt to fund their investment needs, thus debt may be a determinant factor of small firms’ investment (Fama and French, 2002; Ferreira and Vilela, 2004). The sign for the relationship between investment and leverage is essentially an empirical question.
Vermeulen (2002) shows that leverage is more important in explaining investment during downturns and for small firms. Aivazian et al. (2005) show that leverage is negatively related to investment and that this negative effect is significantly stronger for firms with low growth opportunities than for those with high growth opportunities. In the same line, Hernando and Martínez-Carrascal (2008) indicate that the impact of indebtedness and debt burden on investment is non-linear, becoming relatively more intense when financial pressure exceeds a certain threshold. That threshold is above the one identified by Goretti and Souto (2013), who also find strong negative effects of debt on investment in their sample of euro area firms. Using a large sample of non-financial firms from six euro area countries, Martínez-Carrascal and Ferrando (2008) evidence that indebtedness and debt burden exert a negative impact on investment, while cash flow is positively linked to it. In terms of country differences, the authors find that firms located in the Netherlands and Italy present the highest marginal impact of financial pressure on investment rates, whereas German firms present the lowest sensitivity. Nevertheless, notice that debt may have some desirable properties, allowing financing projects in the absence of internal funds (Gatchev et al., 2010). One of the most comprehensive studies on this subject is Siedschlag et al. (2014), which analyze 22.555 firms from eleven European countries, including Portugal. The authors evidence positive and significant effects of cash flow and leverage on investment, being these effects stronger during the recent financial crisis. Recently, Gebauer et al. (2017), using firm-level data from 2005-2014 for five peripheral euro area countries (also including Portugal), evidence that the investment sensitivity of debt increased after 2008 when financial distress intensified and firms had a lower capacity to finance investment from internal sources of funds.
The majority of these studies were based on listed and large firms, located in highly developed economies and with an easy access to capital markets, with the focus on SMEs and less developed economies being much more recent. Notice that SMEs are in fact those thought to be more vulnerable to asymmetric information problems and hence more likely to face a higher external finance premium (Fazzari et al., 1988).
A recent publication from Banco de Portugal (2016) concludes that, in a general way, financial ratios seem to explain better the investment dynamics than the qualitative answers given by firms in a comprehensive survey. Concerning the investment-financial situation issue, in the last three decades only a handful of empirical papers used data for Portuguese firms. Farinha (1995), using data from 1986 to 1992 concludes that the availability of internally generated funds affects investment decisions of smaller firms. Oliveira and Fortunato (2006) use balance sheet data of manufacturing firms for the period 1990-2001 and find that smaller and younger firms have higher growth-cash flow sensitivities than more mature firms, a result that could be explained by the fact that cash-flow realization is particularly important for those firms, not necessarily indicating the existence of financing constraints. Barbosa et al. (2007) analyze the period from 1995 to 2005 and find that the impact of firm indebtedness on investment depends on firm size, the number of bank lending relationships and credit default history. More recently, Farinha and Prego (2013), using data from 2006 to 2011, evidence that, particularly for smaller firms, the financial position is relevant in explaining investment decisions, with the burden of servicing debt, the cost of capital and leverage all displaying a negative relation with investment, whereas profitability has a strong and positive relationship.
Following this literature, but updating the dataset and considering potential sector differences, the present paper intends to study the investment determinants of the Portuguese industrial SMEs, in the period 2011-2015, trying also to find significant differences between sectors of activity and firm size. This paper brings an innovative approach to this issue, studying a particularly important topic for Portuguese firms, which in the last decade faced a depressed investment environment. Admitting that financial situation can condition firms’ real decisions, excessive debt or a high debt-service burden can have an adverse effect on investment spending, thereby contributing to aggravate recessions or to inhibit economic recoveries (ECB, 2013). So, given the relevance of this issue, it is expected that the empirical evidence resulting from this paper allows making suggestions for policymakers and owners-managers of Portuguese SMEs.
2.2 The Portuguese context
The situation of Portuguese SMEs is particularly interesting since Portuguese firms present higher levels of debt compared to other European firms (IMF, 2015), which implies that Portuguese firms’ risk profiles may be different than the typically observed in other studies about the investment/ firm situation link.
According to the Commission Recommendation 2003/361/EC of 6th May the definition of micro,
small and medium-sized enterprises is as follows:
1. The category of micro, small and medium-sized enterprises (SMEs) is made up of firms which employ fewer than 250 persons and which have an annual turnover not exceeding EUR 50 million, and/or an annual balance sheet total not exceeding EUR 43 million.
2. Within the SME category, a small enterprise is defined as a firm which employs fewer than 50 persons and whose annual turnover and/or annual balance sheet total does not exceed EUR 10 million.
3. Within the SME category, a microenterprise is defined as a firm which employs fewer than 10 persons and whose annual turnover and/or annual balance sheet total does not exceed EUR 2 million.
SMEs hold their position as the backbone of the European economy, representing over 99% of all firms, which corresponds to about 21.6 million firms, employing approximately 88.8 million people and being responsible for almost 60% of the privately generated Gross Value Added (GVA) in Europe. In Portugal, according to the National Statistics Office (INE, 2016), SMEs are the main drivers of employment creation and are recognized as a pillar of the national economy. In 2014, and according to INE, 99,9% of the firms were SMEs, 96,3% of which were micro-firms. Although large firms are responsible for 42% of the turnover and 37% of GVA, SMEs account for about 80% of employment. Also according to the National Statistics Office, Investment accounted for around 15% of the Portuguese GDP in 2014, turning its performance highly influential for the overall economic growth. SMEs, with the exception of micro firms, present slightly lower investment rates than large firms, being nevertheless responsible for 62% of the fixed capital expenditures made by Portuguese firms in 2014. Considering the manufacturing sector, and according to Banco de Portugal (2015), 28% of SMEs belong to the manufacturing sector, a sector representing 22% of GVA and almost 19% of total employment.
3 HYPOTHESES DEVELOPMENT
Following previous authors (e.g., Martínez-Carrascal and Ferrando, 2008; López-Gutiérrez et al., 2015; Gebauer et al., 2017 and Ferrando et al., 2017), the dependent variable – investment rate or INV – is measured as the ratio between the annual change in tangible fixed assets (plus amortizations) and total assets.
The approach based on Tobin’s Q, developed by Fazzari et al. (1988), has the advantage of capturing the market’s valuation of the firm’s investment opportunities, yet that approach is not suitable when using data for SMEs, since it is virtually impossible to apply it to unlisted firms. Nevertheless, investment opportunities will be captured by the inclusion of lagged investment in the regressions. So, concerning the explanatory variables: i) profitability is measured by ROA (return on assets), being expected a positive sign for this variable, since more profitable firms should present higher levels of investment. This is a measure of the efficiency of a firm in generating returns from its assets, without being affected by management financing decisions; ii) the debt level of the firm is measured as total debt (Total liabilities / Total assets) and its subdivision in short-term and long-term debt (respectively, Current Liabilities / Total Assets and Non-current Liabilities / Total Assets). The debt ratios explain how the firm can finance its activity with its own resources and what degree of independence lies with external agents. In line with the stated above, we expect a positive relationship between total debt and investment, with probable differences between long-term and short-term debt. Notice that this subdivision of debt is new on this literature; iii) interest burden affects the firm’s capacity to meet interest payments with the proceeds it generates, thus impacting negatively on investment. It is measured as the ratio of interest payments to EBITDA plus financial revenue, reflecting the impact of changes in interest rates, firm profitability and indebtedness; iv) firm size is measured by the logarithm of total assets being expected a negative relationship with investment, since it is assumed that small firms grow faster than large firms, thus needing to invest more; finally, iv) a measure of total liquidity (the ratio between current assets and current liabilities) is also tested, since it measures the difference between the realization of revenues and the incurrence of expenses, and so how the firm can use the resulting liquidity to finance its investments. This measure of financial vulnerability constitutes and imperfect proxy, so measurement error can bias the results downward.
So, following the literature reviewed in the last section, the following hypotheses are defined: H1: Investment displays persistence
H3: Investment is positively related to indebtedness H4: Investment is negatively related to the debt burden H5: Investment is negatively related to firm size H6: Investment is positively related to liquidity
Therefore, investment rates are assumed to display persistence over time and be a positive function of profitability, leverage and the stock of liquid assets and a negative function of the debt burden and size. Several authors have also argued for the inclusion of sales in this equation (Fazzari et al., 1988; Farinha and Prego, 2013), controlling for demand effects that may be otherwise captured by the cash flow term. Sales would act as an exogenous variable to the firm, where according to the neoclassical theory investment decisions are influenced by demand factors. As argued above, SMEs are more dependent on internal finance due to their greater difficulties in accessing external finance so it is expected that an exogenous variable as sales should be less important in explaining investment decisions. Nevertheless, the inclusion of a sales variable (measured by the log of total sales) was tested but the results were biased due to the strong correlation between sales and size.
Empirical efforts on factors influencing investment decisions have shown that industry classification is a relevant factor, since industries present different financial structures and resources’ demand or different technological or innovation needs. Sector characteristics, as the degree of operating leverage or levels of industry concentration or competition can exert influence on the investment levels. So, this paper also tests for differences between different manufacturing sectors.
4 METHODOLOGY 4.1 Data
This paper uses a sample of Portuguese industrial SMEs where the dependent variable is a measure of investment and the independent variables represent the firm’s investment determinant factors according to the previously stated hypotheses.
After the identification of the hypotheses to be tested as well as the dependent and independent variables, it is necessary to describe the data collection process for the sample characterization over which our empirical study will be made. Our objective is to analyze a sample of SMEs pertaining to 21 industrial sectors, obtained from SABI, a financial database powered by Bureau van Dijk. In preparing the data, firstly the criteria for SME definition were applied and firms with less than 10 employees were excluded, because micro firms tend to present gaps in terms of data and potential anomalous values. Secondly, in order to obtain a robust sample, only firms with a 4 year period of complete data and positive debt ratios or assets greater than liabilities were included. Thirdly, especial attention has also been paid to extreme firm asset variations. In that sense, and following Martínez-Carrascal and Ferrando (2008), firms with investment rates above 1 are excluded, as this is probably a sign of merger and acquisition, and firms that had an increase in fixed assets of more than 500% or a decrease bigger than 75% were removed from the sample. Additionally, in order to eliminate spurious outliers observations, observations below (and above) the 1st (and 99th) percentile were winsorized. After applying all the above
criteria, the data used in this study consists of an unbalanced panel data of 108.548 observations, corresponding to 2456 firms, observed on the period between 2011 and 2015. The use of unbalanced panel data, which allows for both firm’s entry and exit, partially mitigates the potential selection and survivorship biases.
Table 1 presents a detailed description of our sample. The sample accounts for 168.133 employees, a turnover close to 19 billion Euros and total assets over 19 billion Euros in 2015. The sample is almost equally divided between small firms (1.178) and medium firms (1.278) and all relevant sectors are represented. In 2015, firms in the sample invested around 9,5 billion Euros, which represents an investment rate around 4,6%.Table 1 allows to ascertain that exist significant differences between sectors in terms of investment, with some sectors presenting investment rates above 6% (e.g., “paper and paper products” or “rubber and plastic products”) while others present values slightly above 3% (e.g., “wearing apparel”). In sum, as observed in Table 1, the average firm in our sample: (i) invests each year around 4,6% of its assets in tangible fixed assets plus amortizations; ii) presents a profitability under 3%, iii) presents a debt ratio of 61,1%; iv) employs 68 persons and (v) has slightly less than 8 million Euros in sales.
Table 1: Distribution of the sample by industry classifications
Industry Classification (CAE) Nr. of
Firms Invest. rate (%) Profitab. (%) Total Debt (%) Aver. nr. of empl. Average sales (th€) Food products (10) 359 4,75 1,64 63,1 65 10.909
Beverages and tobacco (11/12) 83 4,61 1,02 61,3 41 7.167
Textiles (13) 157 4,69 2,78 58,5 83 8.862
Wearing apparel (14) 179 3,07 3,30 63,8 99 7.892
Leather and related products (15) 161 4,44 5,98 63,7 92 7.224
Wood and of products of wood and cork (16) 133 4,25 1,50 64,6 53 7.612
Paper and paper products (17) 54 6,03 4,28 62,4 75 11.825
Printing and reproduction of recorded media
(18) 65 4,75 3,06 61,0 58 5.302
Refined petroleum, chemicals and man-made
fibers (19/20) 98 3,85 4,29 59,5 44 9.711
Pharmaceutical products (21) 23 5,44 4,89 61,2 92 11.817
Rubber and plastic products (22) 150 6,79 3,50 60,7 66 8.996
Other non-metallic mineral products (23) 185 4,10 0,53 59,5 60 5.690
Basic metals (24) 49 5,00 2,01 57,5 68 10.900
Fabricated metal products (25) 349 4,80 3,68 60,6 65 6.288
Computer, communication and electronic
equip. (26) 26 5,45 5,37 55,2 72 6.938
Electrical equipment (27) 54 4,15 2,07 55,6 65 7.712
Machinery and equipment (28) 125 4,55 4,75 56,9 61 6.427
Motor vehicles, trailers and parts (29) 51 5,10 2,67 69,0 84 10.028
Other transport equipment (30) 17 6,38 1,91 56,2 78 7.802
Furniture (31) 102 4,03 1,46 57,5 68 4.822
Other manufacturing activities (32) 36 5,45 4,52 61,2 64 6.054
2.456 4,64% 2,91% 61,1% 68 7.973 M€
Notes: Sectors 11/12 and 19/20 are aggregated since the sample only comprises a very small number of firms in sectors 12 and 19. Values for 2014, with the exception of the investment rate (2015).
4.2 Econometric methodology
In order to attain our research objective we apply a panel data methodology, which presents several advantages, namely better effects’ detection and measurement, minimization in sample bias and control of individual heterogeneity (Gujarati and Porter, 2010). Panel data can be estimated trough three different regression models: Pooled Ordinary Least Squares (POLS), Fixed Effects Model (FEM) and Random Effects Model (REM). Applying the Wald, Breusch-Pagan and Hausman tests we will choose the most appropriate regression technique. First, comparing between POLS and FEM, the Wald test states the null hypothesis of the constant terms being all equal. Under the null hypothesis, the efficient estimator is the POLS model, indicating the non-existence of a specific effect for each one of the firms. After, the Breusch-Pagan test compares between POLS and REM, where the rejection of the null hypothesis indicates that REM is more appropriate. Finally, the Hausman test compares REM with FEM, where under the null hypothesis the efficient estimator is the REM. If we reject the null hypothesis, the FEM is more appropriate, since the REM would yield biased results.
In order to test the different hypothesis, we perform the following regression: Yi,t = β1 + β2 Yi,t-1 + β3 Xi,t-1 + εi,t
where: Yi,t – Dependent variable (INV) for the i-th firm in year t;
β – Coefficients to estimate;
Xi,t – Vector of independent variables for the i-th firm in year t;
εi,t – Error describing the non-explained effects on Yi,t.
After choosing the appropriate estimation technique, first only lagged investment and profitability are included in the regression being later sequentially added and tested the other dependent variables. All the independent variables are lagged one period to reduce possible endogeneity. Later, it would be tested the impact on investment of firm’s different size, leverage and sector of activity.
5 RESULTS
5.1 Descriptive statistics
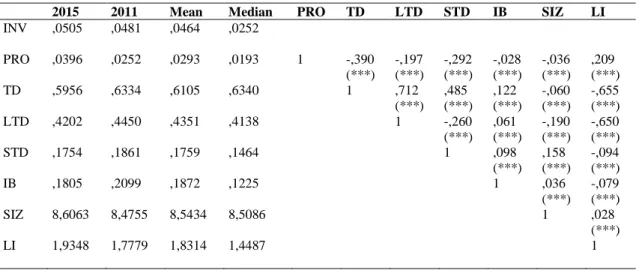
Before estimating the different models we present some descriptive statistics of the variables. Table 2 reports the 2015 and 2011 values for the variables used in the econometric analysis, as well as their mean and median. As can be seen, with the exception of total debt, all variables show a positively skewed distribution, in particular the investment and profitability rates. Also, in recent years, the indebtedness levels decreased slightly and firms present an improvement in profitability and liquidity, reflecting the slight resurgence of economic activity. Also, the debt burden ratio displays a downward trend, possibly reflecting the impact of the reduction in interest rates.
Table 2: Descriptive statistics and correlation matrix between independent variables
2015 2011 Mean Median PRO TD LTD STD IB SIZ LI
INV ,0505 ,0481 ,0464 ,0252 PRO ,0396 ,0252 ,0293 ,0193 1 -,390 -,197 -,292 -,028 -,036 ,209 (***) (***) (***) (***) (***) (***) TD ,5956 ,6334 ,6105 ,6340 1 ,712 ,485 ,122 -,060 -,655 (***) (***) (***) (***) (***) LTD ,4202 ,4450 ,4351 ,4138 1 -,260 ,061 -,190 -,650 (***) (***) (***) (***) STD ,1754 ,1861 ,1759 ,1464 1 ,098 ,158 -,094 (***) (***) (***) IB ,1805 ,2099 ,1872 ,1225 1 ,036 -,079 (***) (***) SIZ 8,6063 8,4755 8,5434 8,5086 1 ,028 (***) LI 1,9348 1,7779 1,8314 1,4487 1
Notes: * p < 0,10; ** p < 0,05; *** p < 0,01. Correlations computed with 2014 values.
Table 2 also presents the coefficients of correlation of the variables used in the model. Problems of correlations between variables that could affect the validity of the econometric results due to multicollinearity are negligible since according to Gujarati and Porter (2010) only when the correlation coefficients are above 50%, the problem of collinearity becomes significant. Observing Table 2, since the variable TD is not going to be used jointly with variables LTD or STD, the problem of collinearity between explanatory variables will not be particularly relevant. However, some caution should be taken when using the variable LI together with debt variables TD or LTD.
5.2 Results for the complete sample
Table 3 presents the results obtained for Pooled OLS (POLS), Fixed Effects Model (FEM) and Random Effects Model (REM) and the different tests to choose the appropriate model. According to the Wald and Breusch-Pagan tests we always reject the POLS model and according to the Hausman test we reject the random effects model, indicating that the fixed effects model is more efficient.
Since the tests reveal that the results under FEM have better explanatory power compared to results under POLS or REM, we estimate again the fixed effects model but sequentially regressing investment on the different dependent variables, in order to capture their individual impact. Table 4 presents the obtained results.
Table 3: Regression models
POLS Sig FEM Sig REM Sig POLS Sig FEM Sig REM Sig
C ,099 (,001) *** ,486 (,038) *** ,137 (,009) *** ,116 (,010) *** ,460 (,037) *** ,131 (,009) *** INV(-1) ,497 (,009) *** ,492 (,007) *** ,497 (,005) *** ,496 (,009) *** ,488 (,007) *** ,497 (,005) *** PRO ,127 (,010) *** ,085 (,012) *** ,089 (,008) *** ,134 (,010) *** ,084 (,012) *** ,087 (,008) *** TD ,005 (,005) -,002 (,001) ,006 (,004) LTD -,013 (,006) ** ,049 (,010) *** ,012 (,005) ** STD ,021 (,005) *** -,040 (,009) *** ,001 (,005) IB -,007 (,001) *** -,000 (,001) -,002 (,001) ** -,007 (,001) *** -,000 (,001) -,002 (,001) ** SIZ -,006 (,001) *** -,053 (,005) *** -,011 (,001) *** -,007 (,001) *** -,053 (,004) *** -,011 (,001) *** LI -,004 (,001) *** ,006 (,001) *** ,003 (,001) -,006 (,001) *** ,013 (,001) *** ,001 (,001)
Wald 5,1369 *** Reject POLS / Accept FEM 5,4863 *** Reject POLS / Accept FEM
Breusch-Pagan 2828,57 *** Reject POLS / Accept REM 2673,14 *** Reject POLS / Accept REM
Hausman 524,969 *** Reject REM / Accept FEM 780,795 *** Reject REM / Accept FEM
Notes: POLS (Pooled Ordinary Least Squares); FEM (Fixed Effects Model); REM (Random Effects Model). Standard-deviations presented in brackets. * p<0,10; ** p<0,05; *** p<0,01
Table 4: Fixed Effects Model results
I Sig II Sig III Sig IV Sig V Sig VI Sig VII Sig
C ,044 (,025) *** ,065 (,005) *** ,045 (,000) *** ,460 (,033) *** ,033 (,002) *** ,460 (,037) *** ,438 (,041) *** INV(-1) ,498 (,006) *** ,498 (,006) *** ,500 (,007) *** ,494 (,006) *** ,498 (,006) *** ,488 (,007) *** PRO ,056 (,010) *** ,084 (,012) *** ,097 (,014) *** LTD -,018 (,008) ** ,049 (,010) *** ,065 (,012) *** STD -,063 (,010) *** -,040 (,009) *** -,035 (,011) *** IB -,000 (,001) -,000 (,001) -,001 (,001) SIZ -,049 (,004) *** -,053 (,004) *** -,052 (,005) *** LI ,007 (,001) *** ,013 (,001) *** ,015 (,002) *** R2 ,77 ,78 ,78 ,79 ,78 ,80 ,47 R2 within ,57 ,57 ,56 ,59 ,57 ,61 ,06 F 4692,0 *** 3167,6 *** 3913,1 *** 5152,2 *** 4740,4 *** 1367,5 *** 87,5 *** DW 1,25 1,25 1,24 1,24 1,24 1,24 1,74
Notes: Standard-deviations presented in brackets. * p<0,10; ** p<0,05; *** p<0,01. DW = Durbin-Watson. 5.3 Results for different firms’ size
Firm size is usually confirmed has an important determinant of financial constraints, since smaller firms could suffer more strongly the effects of market imperfections. Investment projects of smaller firms, often younger and without an operating history, are usually considered riskier, thus increasing financing costs and those firms also tend to be less diversified and have less collateral to guarantee loans. However, some literature shows conflicting results regarding the correlation between size and financial constraints (ECB, 2013). In order to study firms’ size differences the original sample is split in two equal-sized subsamples of firms. One possible alternative procedure would be to use the full sample and introduce
dummy variables to control for firm characteristics. However, this procedure would not allow the direct comparisons available using subsamples. Thus, the first subsample includes firms until the 50th percentile
in terms of assets and the second subsample includes the larger firms. Since larger firms should be less reliant on internal funding than smaller firms, it is expected that investment-cash flow sensitivity decreases with firm size, whereas the debt influence on investment should be greater for larger firms. The regression results indicate that POLS is now the appropriate model, with Table 5 presenting the results.
Table 5: POLS results
Smaller firms Larger firms
C ,061 (,006) *** ,029 (,003) *** ,051 (,005) *** ,033 (,003) *** PRO ,136 (,012) *** ,139 (,012) *** ,128 (,012) *** ,129 (,012) *** LTD -,009 (,007) ,025 (,005) *** -,004 (,006) ,013 (,005) *** STD ,019 (,007) *** ,035 (,006) *** ,015 (,006) ** ,025 (,006) *** IB -,007 (,002) *** -,007 (,002) *** -,006 (,001) *** -,006 (,001) *** LI -,008 (,001) *** -,004 (,001) *** R2 ,04 ,03 ,03 ,02 R2 within ,04 ,03 ,03 ,02 F 43,718 *** 40,417 *** 29,933 *** 32,641 *** DW 1,53 1,54 1,59 1,59
Notes: The two samples include an equal number of firms (1228). Standard-deviations presented in brackets. * p<0,10; ** p<0,05; *** p<0,01. DW = Durbin-Watson.
5.4 Results for different firms’ leverage
Leverage is also confirmed has an important determinant of investment since highly leveraged firms might be expected to be more sensitive to the availability of cash flows to service debt. In order to study the different determinants on investment caused by firms’ leverage differences the original sample is split in four equal-sized subsamples of firms. The first subsample includes firms in the 1st quartile in terms of
the debt ratio, the second subsample includes firms in the 2nd quartile and so on. It is expected that
investment-cash flow sensitivity decreases with leverage. Using again POLS model, the results are presented in Table 6.
Table 6: Regression models
1st quartile Sig 2nd quartile Sig 3rd quartile Sig 4th quartile Sig
C ,073 (,012) *** ,103 (,012) *** ,079 (,013) *** ,122 (,013) *** PRO ,138 (,013) *** ,128 (,017) *** ,189 (,022) *** ,100 (,016) *** IB -,001 (,005) -,011 (,002) *** -,012 (,003) *** -,004 (,002) ** SIZ -,003 (,001) ** -,006 (,001) *** -,003 (,002) * -,008 (,002) *** LI -,004 (,001) *** -,004 (,001) *** -,007 (,002) *** -,003 (,002) * R2 ,06 ,05 ,04 ,03 R2 adjusted ,05 ,04 ,04 ,03 F 38,705 *** 32,916 *** 32,155 *** 20,811 *** DW 1,52 1,57 1,54 1,66
Notes: Each quartile includes an equal number of firms (614) firms. Standard-deviations presented in brackets. * p<0,10; ** p<0,05; *** p<0,01. DW = Durbin-Watson.
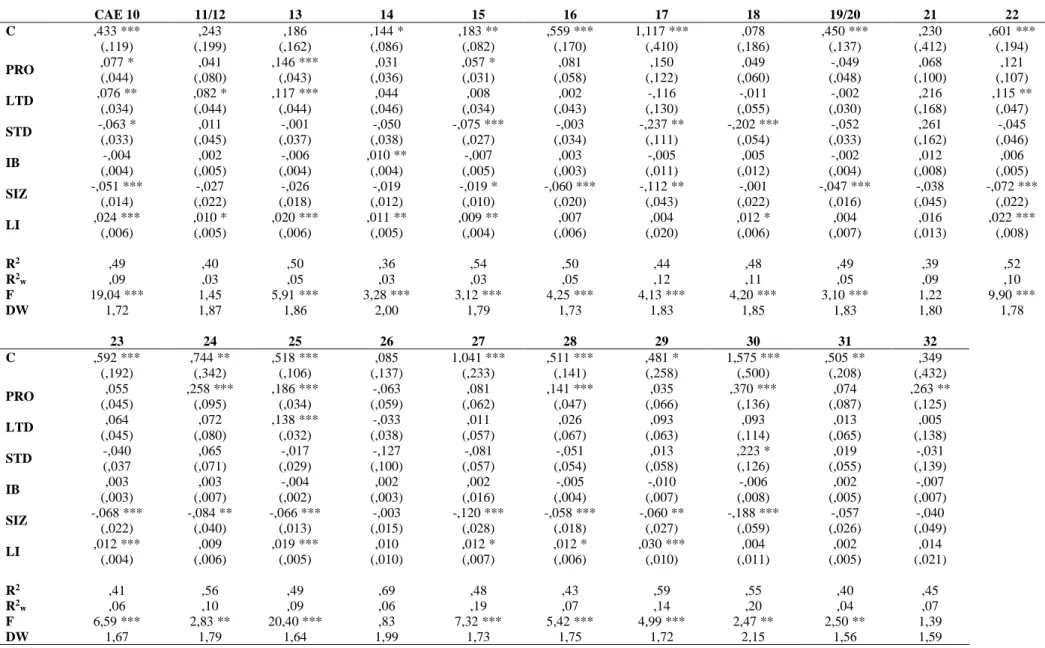
Table 7: Regression (Fixed Effects Model) for the different manufacturing sectors CAE 10 11/12 13 14 15 16 17 18 19/20 21 22 C ,433 *** ,243 ,186 ,144 * ,183 ** ,559 *** 1,117 *** ,078 ,450 *** ,230 ,601 *** (,119) (,199) (,162) (,086) (,082) (,170) (,410) (,186) (,137) (,412) (,194) PRO ,077 * (,044) ,041 (,080) ,146 *** (,043) ,031 (,036) ,057 * (,031) ,081 (,058) ,150 (,122) ,049 (,060) -,049 (,048) ,068 (,100) ,121 (,107) LTD ,076 ** (,034) ,082 * (,044) ,117 *** (,044) ,044 (,046) ,008 (,034) ,002 (,043) -,116 (,130) -,011 (,055) -,002 (,030) ,216 (,168) ,115 ** (,047) STD -,063 * (,033) ,011 (,045) -,001 (,037) -,050 (,038) -,075 *** (,027) -,003 (,034) -,237 ** (,111) -,202 *** (,054) -,052 (,033) ,261 (,162) -,045 (,046) IB -,004 (,004) ,002 (,005) -,006 (,004) ,010 ** (,004) -,007 (,005) ,003 (,003) -,005 (,011) ,005 (,012) -,002 (,004) ,012 (,008) ,006 (,005) SIZ -,051 *** (,014) -,027 (,022) -,026 (,018) -,019 (,012) -,019 * (,010) -,060 *** (,020) -,112 ** (,043) -,001 (,022) -,047 *** (,016) -,038 (,045) -,072 *** (,022) LI ,024 *** (,006) ,010 * (,005) ,020 *** (,006) ,011 ** (,005) ,009 ** (,004) ,007 (,006) ,004 (,020) ,012 * (,006) ,004 (,007) ,016 (,013) ,022 *** (,008) R2 ,49 ,40 ,50 ,36 ,54 ,50 ,44 ,48 ,49 ,39 ,52 R2w ,09 ,03 ,05 ,03 ,03 ,05 ,12 ,11 ,05 ,09 ,10 F 19,04 *** 1,45 5,91 *** 3,28 *** 3,12 *** 4,25 *** 4,13 *** 4,20 *** 3,10 *** 1,22 9,90 *** DW 1,72 1,87 1,86 2,00 1,79 1,73 1,83 1,85 1,83 1,80 1,78 23 24 25 26 27 28 29 30 31 32 C ,592 *** ,744 ** ,518 *** ,085 1,041 *** ,511 *** ,481 * 1,575 *** ,505 ** ,349 (,192) (,342) (,106) (,137) (,233) (,141) (,258) (,500) (,208) (,432) PRO ,055 (,045) ,258 *** (,095) ,186 *** (,034) -,063 (,059) ,081 (,062) ,141 *** (,047) ,035 (,066) ,370 *** (,136) ,074 (,087) ,263 ** (,125) LTD ,064 (,045) ,072 (,080) ,138 *** (,032) -,033 (,038) ,011 (,057) ,026 (,067) ,093 (,063) ,093 (,114) ,013 (,065) ,005 (,138) STD -,040 (,037 ,065 (,071) -,017 (,029) -,127 (,100) -,081 (,057) -,051 (,054) ,013 (,058) ,223 * (,126) ,019 (,055) -,031 (,139) IB ,003 (,003) ,003 (,007) -,004 (,002) ,002 (,003) ,002 (,016) -,005 (,004) -,010 (,007) -,006 (,008) ,002 (,005) -,007 (,007) SIZ -,068 *** (,022) -,084 ** (,040) -,066 *** (,013) -,003 (,015) -,120 *** (,028) -,058 *** (,018) -,060 ** (,027) -,188 *** (,059) -,057 (,026) -,040 (,049) LI ,012 *** (,004) ,009 (,006) ,019 *** (,005) ,010 (,010) ,012 * (,007) ,012 * (,006) ,030 *** (,010) ,004 (,011) ,002 (,005) ,014 (,021) R2 ,41 ,56 ,49 ,69 ,48 ,43 ,59 ,55 ,40 ,45 R2w ,06 ,10 ,09 ,06 ,19 ,07 ,14 ,20 ,04 ,07 F 6,59 *** 2,83 ** 20,40 *** ,83 7,32 *** 5,42 *** 4,99 *** 2,47 ** 2,50 ** 1,39 DW 1,67 1,79 1,64 1,99 1,73 1,75 1,72 2,15 1,56 1,59
12 5.5 Results for the different sectors of activity
Some prior studies show industry to be a significant determinant of investment. So, we now repeat the analysis distinguishing between sectors of activity, with Table 7 presenting the results estimated trough a Fixed Effects Model (FEM), which shows again to be the most adequate model.
6 DISCUSSION
Regarding the effect of firms’ financial variables (Table 4), the results show that those effects generally have the expected signs and are statistically significant, thus confirming the results from previous papers (e.g., Bond et al., 2003; Benito and Hernando, 2007; Barbosa et al., 2007; Hernando and Martínez-Carrascal, 2008; Farinha and Prego, 2013; Gebauer et al., 2017). Notice that, globally, the coefficients remain significant when included in a regression with all the independent variables. Next, at the light of Table 4 results we begin by briefly discussing our different hypotheses:
Hypothesis 1 - Investment displays persistence
The results suggest that there is persistency in firm level investment as the estimated coefficient for lagged investment assumes always a positive and statistically significant value (in line with the results from Barbosa et al., 2007 or Farinha and Prego, 2013, but contrary to Bond et al., 2003; Martínez-Carrascal and Ferrando, 2008 and Mulier et al., 2016). Thus, we undoubtedly do not reject H1, noticing that investment in the previous term can be interpreted as investment opportunities.
Hypothesis 2 - Investment is positively related to profitability
Profitability also has the expected positive and significant coefficient, indicating that firms with higher levels of profitability tend to invest more in the subsequent year. In average, a one percentage point increase in the profitability rate has a 0,08 percentage point effect on the investment rate, thus H2 should not be rejected. This positive and significant coefficient is consistent with studies of investment for other countries (e.g., Hernando and Martínez-Carrascal, 2008; Martínez-Carrascal and Ferrando, 2008; Gebauer et al., 2017), supporting the “investment-cash flow hypothesis”, a highly debated hypothesis in the last decade (e.g., Brown and Petersen, 2009; Chen and Chen, 2012; Mulier et al., 2016). Nevertheless, as has been extensively discussed in the literature on investment and financial constraints, the cash-flow term might be either picking up the relevance of internal finance for investment (given the financial constraints and agency problems) or acting as a proxy for investment opportunities.
Hypothesis 3 - Investment is positively related to indebtedness
Albeit not presented, total debt displays a negative coefficient but is never significant, even when excluding the variable LI. The results are more significant and interesting when dividing total debt in long-term and short-term debt, something that is rather new in the literature. Firms’ short-term indebtedness level shows a negative and significant relationship with investment, suggesting that higher levels of debt might motivate firms to differ or forgone investment projects, possibly due to difficulties in accessing financing. Several authors found that higher levels of debt result in a increased probability of financial distress and the demand for higher returns by potential suppliers of funds, thus displaying a negative relation with investment (Vermeulen, 2002; Hernando and Martínez-Carrascal, 2008; Farinha and Prego, 2013; Gebauer et al., 2017). On the contrary, the positive coefficient found for LTD suggests that firms that invest more are not facing financing limitations, since they seem to easily finance their larger investments issuing more debt. This evidence that capital structure affects investment behaviour, with higher levels of long-term debt resulting in an increased investment rate means that firms may be using their accumulated assets, obtained thanks to debt, in order to increase their investments. Nevertheless, the results for LTD should be viewed with caution, since the high correlation between the debt variables and liquidity could be biasing the results, leading us to globally reject H3.
Hypothesis 4 - Investment is negatively related to the debt burden
With respect to the interest burden variable, the results are not significant. Possibly, these results are due to errors in data gathering given the difficulties in accurately measuring interest paid and financial revenues. Thus, H4 is rejected, being impossible to confirm if the financial pressure of debt servicing is a relevant variable in the analysis of the Portuguese corporate investment activity.
The results evidence a negative and significant relationship between firms’ size and investment decisions, suggesting that larger firms are more mature in their respective life cycle, thus reducing the need to make significant investments in capital accumulation. These results indicate that H5 should not be rejected. Nevertheless, the impact of size on investment rates deserves further attention, so that we will return to this issue.
Hypothesis 6 - Investment is positively related to liquidity
Liquidity presents always a positive and significant coefficient, indicating that firms facing lower liquidity constraints invest more. This result also validates the investment-cash flow hypothesis, thus H6 should not be rejected (Lang et al., 1996; Martínez-Carrascal and Ferrando, 2008).
In general, these results seem to support the hypotheses that financial pressure faced by firms is relevant to explore corporate investment decisions, as profitability, indebtedness, size and liquidity are found to be significant when included in investment equations. Even when lagged investment is excluded from the regression the estimated coefficients maintain their significance, signs and values, evidencing the robustness of the results. In an attempt to further evidence the robustness of the results, we repeated the analysis distinguishing firms in terms of size and leverage.
Regarding the results for different firms’ size (Table 5), it is evidenced that cash flows are more significant for smaller firms thus confirming the results from Oliveira and Fortunato (2006) and Farinha and Prego (2013) and the hypothesis that smaller firms rely more on internal sources of funding when compared to larger firms. So, any disruption to cash flow will thus have a larger impact on investments made by smaller firms. Concerning debt, the coefficients (when significant) are lower for larger firms, thus confirming the hypothesis that the debt influence on investment should be greater for those firms, whereas the debt servicing variable displays similar negative and significant coefficients for both kinds of firms, a result also found by Gebauer et al. (2017) for micro and small firms. So, larger firms evidence lower coefficients, meaning that those firms recur less to debt to finance their investments (and also are less dependent of cash flows, given the smaller values for the coefficients associated with the variable PRO), suggesting that larger firms could have other alternatives to finance their investments. For the variable LI it seems there are no significant differences between the two sets of firms.
The results for different firms’ leverage levels (Table 6) do not seem to evidence clear and progressive differences between firms. Therefore, the considered internal factors do not seem to exert a different statistical influence on investment for firms with higher versus lower debt levels. Albeit not researched here, there seems to exist a non-linear effect of leverage on the investment rate, since firms pertaining to the 3rd quartile in terms of leverage present higher investment sensitivity towards
profitability and interest burden than firms closer to the tails of the distribution. This issue of non-linearities in the debt-investment link was recently addressed by Gebauer et al. (2017).
Analyzing the results for different sectors of activity (Table 7), and considering all the significant results that display the expected sign, we confirm that profitability positively affects investment rates, with significant values appearing in 8 sectors. Long-term and short-term debt only significantly affect investment in 4 or 5 sectors, evidencing large differences between them. The variable “interest burden” continues to be not significant and size and liquidity present, respectively, the negative and positive signs previously found (respectively, for 13 and 12 sectors), but with the different sectors presenting varying coefficients. In sum, concerning the traditional determinants of investment, it appears there are no significant differences between sectors of activity, a result also found by Martínez-Carrascal and Herrando (2008).
Finally, Table 8 presents a comparison between the expected and observed relationships, where we can validate the different hypotheses that were tested in this empirical study.
Table 8: Expected and Observed Relations
EXPLANATORY VARIABLES EXPECTED RELATION OBSERVED RELATION HYPOTHESES ACCEPTED?
H1 Lagged investment + + YES
H2 Profitability + + YES
H3 Debt + NS NO
Long-term Debt + + YES
Short-term Debt + - NO
H4 Interest Burden - NS NO
H5 Size - - YES
H6 Liquidity + + YES
Regarding the main questions addressed in this paper, we can answer that:
i) Industrial SMEs present a positive relationship between firms’ profitability and liquidity with investment;
ii) Long-term debt is positively related to investment and; iii) Firms’ size and investment are negatively related.
So, the results evidence that the structure of a firm’s balance sheet and the availability of adequate sources of funds can influence investment. Higher profitability or liquidity seems to boost investment by providing more and relatively cheap internal funds, thus increasing the collateral backing of the firm. Additionally, contrary to the results typically found in the literature, higher long-term leverage seems to encourage investment. However, the extent to which these factors influence investment appears to vary between firms, with the results suggesting that internal sources of funds are more important for small and highly leveraged firms. The positive coefficient for long-term debt suggests that firms use debt efficiently to fund their investment opportunities. The positive impact of debt on investment is of less importance for larger firms, which together with the negative correlation between profitability and debt suggests that these firms issue debt when internal funds are insufficient to their investment needs. This financing behaviour is in accordance with the predictions of the pecking order theory and suggests that there is no independence between investment and financing decisions. So, the excessive debt levels of Portuguese SMEs can be seen as the result of the need to follow the investment opportunities which could not be financed with internal funds. Also, the fact that the debt burden exerts a negative influence on investment calls for policy measures directed to the creation of mechanisms aiming to reduce firms’ debt levels. The results also evidence that smaller firms present higher levels of investment, probably due to their desire to grow, in order to reach the minimum scale of efficiency, which ensures firm survival. Beyond a certain size, SMEs may curtail investments in order to stabilize their growth.
The results evidence that financing and investment decisions are not independent in SMEs. Besides the investment-cash flow sensitivity, SMEs are dependent on debt, suggesting that creditors recognize their investment opportunities. Also, this behaviour could be a result of the bank-based nature of the Portuguese financial system, where banks invest in long-term relationships with their clients, thus reducing asymmetric information problems (Bond et al., 2003; Valderrama, 2003; Martínez-Carrascal and Herrando, 2008; Buca and Vermeulen, 2017).
The finding that investment of smaller firms is more sensitive to cash flow than that of larger firms suggest that financial constraints arise as a consequence of the imperfect substitutability of internal and external funds due to adverse selection and informational problems. So, as a way to mitigate asymmetric information problems, further developments on information disclosure by firms to potential financing providers are needed. Another potential positive factor for investment could be given by creating incentives for firms to replace short-term debt with long-term debt. Also at the policymakers’ level, given the importance of investment to aggregate economic growth, additional advances in the institutional environment might also be important for minimizing firm’s financial constraints, namely, ensure an easier access of firms to capital markets. In order to allow SMEs to diversify their external sources of financing, we suggest the creation of stock markets with entry and permanence requirements that SMEs can realistically fulfil. This is a highly debated question in the last decade, but the number of European SMEs which successfully entered in SMEs focused stock exchanges is still rather small.
7 CONCLUSIONS
This exploratory paper presents an empirical analysis of the multidimensional concept of investment, adopting a financial point of view, contrary to most studies related to this topic adopting a macroeconomic approach. We constructed an unbalanced sample of 2456 industrial SMEs for a period of 5 years, between 2011 and 2015, with a total of 108.548 observations. The hypotheses tested in this paper have been sparsely tested in other country contexts and time periods, being this paper one of the first to test them for different sectors of Portuguese industrial firms and differentiating between long-term and short-long-term debt. The results allow us to conclude that the degree of investment is influenced by firm-specific characteristics, such as profitability, liquidity, leverage and size.
Some limitations of this study should be mentioned: i) in the first place, firms’ investment decisions are affected by many variables that were not considered (e.g., interest rates, access to finance and collateral, government incentives to invest, political and economic factors or even the firm-bank confidence relationship), meaning that the results should be treated with caution; ii) secondly, a fact limiting the generalization of the results is that the study focuses only on the Portuguese industrial SMEs; finally, iii) the measures of investment used in the literature somehow differ, leaving us with the
question whether our results are dependent on the measures used and on the specific context of the Portuguese firms.
Investment decisions certainly depend on the financial structure of SMEs but also depend on other determinants (internal or not). So, further research should, inter alia, (i) study the existence of non-linear relationships between the financial variables here considered and investment decisions; (ii) perform quantile regressions to test the hypothesis that if a firm is in a different point of the distribution then its financial variables relate differently with investment; iii) the relationship between the firm’s financial conditions and its investment decisions may have changed during the period of financial and economic crisis where access to bank finance and the credit markets in general deteriorated considerably. So, it would be interesting to study the effect of the recent financial crisis on the investment sensitivities and finally, iv) the study of the investment sensitivities in the context of other important types of investment, besides tangible fixed assets, such as inventory investment and R&D spending, is an interesting avenue for future research.
REFERENCES
Aggarwal, R., Zong, S. (2006). The cash flow-investment relationship: International evidence of limited access to external finance. Journal of Multinational Financial Management, 16(1), 89–104. Aivazian, V., Ge, Y., Qiu, J. (2005). The impact of leverage on firm investment: Canadian
evidence. Journal of Corporate Finance, 11(1), 277-291.
Akerlof, G. (1970). The market for lemons: Quality uncertainty and the market mechanism. The Quarterly Journal of Economics, 84(3), 488-500.
Allayannis, G., Mozumdar, A. (2004). The impact of negative cash flow and influential observations on investment–cash flow sensitivity estimates. Journal of Banking & Finance, 28(5), 901-930. Alti, A. (2003). How sensitive is investment to cash flow when financing is frictionless? The Journal of
Finance, 58(2), 707–722.
Banco de Portugal (2015). Análise das empresas do setor exportador em Portugal. Estudos da Central de Balanços, 22, June. Banco de Portugal, Lisboa.
Banco de Portugal (2016). Boletim Económico. October. Banco de Portugal, Lisboa.
Barbosa, L., Lacerda, A., Ribeiro, N. (2007). Investment decision and financial standing of Portuguese firms. Banco de Portugal Economic Bulletin, Winter.
Benito, A., Hernando, I. (2007). Firm behaviour and financial pressure: Evidence from Spanish panel data. Bulletin of Economic Research, 53(4), 283-311.
Bond, S., Meghir, C. (1994). Dynamic investment models and the firm’s financial policy. The Review of Economic Studies, 61(2), 197-222.
Bond, S., Elston, J., Mairesse, J. and Mulkay, B. (2003). Financial factors and investment in Belgium, France, Germany and the United Kingdom: A comparison using company panel data. The Review of Economics and Statistics, 85(1), 153-165.
Brown, J., Petersen, B. (2009). Why has the investment-cash flow sensitivity declined so sharply? Rising R&D and equity market developments. Journal of Banking & Finance, 33(5), 971-984. Buca, A., Vermeulen, P. (2017). Corporate investment and bank-dependent borrowers during the recent
financial crisis. Journal of Banking and Finance, 78(May), 164-180.
Cantor, R. (1990). Effects of leverage on corporate investment and hiring decisions. FRBNY Quarterly Review, Summer, 31-41.
Chen, H., Chen, S. (2012). Investment-cash flow sensitivity cannot be a good measure of financial constraints: Evidence from the time series. Journal of Financial Economics, 103(2), 393-410. Chirinko, R., Schaller, H. (1995). Why does liquidity matter in investment equations? Journal of
Money, Credit & Banking, 27(2), 527-548.
Degryse, H., De Jong, A. (2006). Investment and internal finance: Asymmetric information or managerial discretion? International Journal of Industrial Organization, 24(1), 125-147.
ECB (2013). Corporate finance and economic activity in the euro area. Structural Issues Report 2013. ECB Occasional Paper, 151, August.
Ericson, T., Whited, T. (2000). Measurement error and the relationship between investment and Q. Journal of Political Economy, 108(5), 1027-1057.
Eriotis, N., Vasiliou, D., Ventoura-Neokosmidi, Z. (2007). How firm characteristics affect capital structure: An empirical study. Managerial Finance, 33(5), 321-331.
European Investment Bank (2016). Investment and investment finance in Europe: Financing productivity growth. Economics Department – European Investment Bank.
Fama, E., French, K. (2002). Testing trade-off and pecking order predictions about dividends and debt. Review of Financial Studies, 15(1), 1–33.
Farinha, L. (1995). Investimento, restrições de liquidez e dimensão das empresas: Uma aplicação ao caso português, Economic Bulletin, Banco de Portugal, December.
Farinha, L., Prego, P. (2013). Investment decisions and financial standing of Portuguese firms – recent evidence. Financial Stability Report. Banco de Portugal, May, 105-125.
Fazzari, S., Hubbard, R., Petersen, B., Blinder, A., Poterba, J. (1988). Financing constraints and corporate investment. Brookings Papers on Economic Activity, 1(1), 141–195.
Fazzari, S., Petersen, B. (1993). Working capital and fixed investment: New evidence on financing constraints. The RAND Journal of Economics, 24(3), 328-342.
Ferrando, A., Marchica, M., Mura, R. (2017). Financial flexibility and investment ability across the euro area and the UK. European Financial Management, 23(1), 87-126.
Ferreira, M., Vilela, M. (2004). Why do firms hold cash? Evidence from EMU countries. European Financial Management, 10(2), 295319.
Gatchev, V., Pulvino, T., Tarhan, V. (2010). The interdependent and intertemporal nature of financial decisions: An application to cash flow sensitivities. The Journal of Finance, 65(2), 725-763. Gebauer, S., Setzer, R., Westphal, A. (2017). Corporate debt and investment: a firm level analysis for
stressed euro area countries. European Central Bank Working paper series, 2101, September. Gertler, M., Gilchrist, S. (1994). Monetary policy, business cycles, and the behavior of small
manufacturing firms. The Quarterly Journal of Economics, 109(2), 309–340.
Goretti, M., Souto, M. (2013). Macro-financial implications of corporate (de-)leveraging in the euro area periphery. IMF Working Paper, 13/154.
Gomes, J. (2001). Financing investment. The American Economic Review, 91(5), 1263-1285. Greenwald, B., Stiglitz, J. (1990). Asymmetric information and the new theory of the firm: Financial
constraints and risk behavior. The American Economic Review, 80(2), 160-165.
Gujarati, D., Porter, D. (2010). Essentials of Econometrics. 4th edition. McGraw-Hill International,
New York.
Harris, M., Raviv, A. (1991). The theory of capital structure. The Journal of Finance, 46(1), 297-355. Hernando, I., Martínez-Carrascal, C. (2008). The impact of financial variables on firm’s real decisions:
Evidence from Spanish firm-level data. Journal of Macroeconomics, 30(1), 543-561. INE (2016). Empresas em Portugal – 2014. Instituto Nacional de Estatística, Lisboa.
IMF (2015). Global Financial Stability Report. World Economic and Financial Surveys. April. International Monetary Fund, Washington.
Jensen, M. (1986). Agency cost of free cash flow, corporate finance, and takeovers. The American Economic Review, 76(2), 323-329.
Kadapakkam, P., Kumar, P., Riddick, L. (1998). The impact of cash flows and firm size on investment: The international evidence. Journal of Banking & Finance, 22(3), 293-320.
Kaplan, S., Zingales, L. (1997). Do investment-cash flow sensitivities provide useful measures of financing constraints? Quarterly Journal of Economics, 112(1), 169- 215.
Kopcke, R., Howrey, M. (1994). A panel study of investment: Sales, cash flow, the cost of capital, and leverage. New England Economic Review, (Jan-Feb), 9-30.
Lang, L., Ofek, E., Stulz, R. (1996). Leverage, investment, and firm growth. Journal of Financial Economics, 40(1), 3-29.
Lewellen, J., Lewellen, K. (2016). Investment and cash flow: New evidence. Journal of Financial and Quantitative Analysis, 51(4), 1135-1164.
López-Gutiérrez, C., Sanfilippo-Azofra, S., Torre-Olmo, B. (2015). Investment decisions of companies in financial distress, Business Research Quarterly, 18(3), 174-187.
Martínez-Carrascal, C., Ferrando, A. (2008). The impact of financial position on investment: An analysis for non-financial corporations in the euro area. European Central Bank Working paper series, 943, September.
Modigliani, F., Miller, M. (1958). The cost of capital, corporation finance, and the theory of investment. The American Economic Review, 48(3), 261-297.
Mulier, K., Schoors, K., Merlevede, B. (2016). Investment-cash flow sensitivity and financial constraints: Evidence from unquoted European SMEs. Journal of Banking & Finance, 73(Dec), 182-197.
Myers, S., Majluf, N. (1984). Corporate financing and investment decisions when firms have information that investors do not have. Journal of Financial Economics, 13(2), 187-221.
Oliveira, B., Fortunato, A. (2006). Investment decisions and financial standing of Portuguese firms: A dynamic analysis. Small Business Economics, 27(2), 139-156.
Schiantarelli, F. (1996). Financial constraints and investment: Methodological issues and international evidence. Oxford Review of Economic Policy, 12(2), 70-89.
Siedschlag, I., O’Toole, C., Murphy, G., O’Connell, B. (2014). Access to external financing and firm growth. Background Study for the European Competitiveness Report 2014.
Tobin, J. (1969). A general equilibrium approach to monetary theory. Journal of Money, Credit and Banking, 1(1), 15-29.
Valderrama, M. (2003). The role of trade credit and bank lending relationships in the transmission mechanism in Austria. In Monetary Policy Transmission in the Euro Area, I. Angeloni, A. Kashyap and B. Mojon (eds), Cambridge University Press, Part 2, 221-232.
Vermeulen, P. (2002). Business fixed investment: Evidence of a financial accelerator in Europe. Oxford Bulletin of Economics and Statistics, 64, 213-231.
Vogt, S. (1994). The cash flow/investment relationship: Evidence from US manufacturing firms. Financial Management, 23(2), 3-20.
Whited, T. (1992). Debt, liquidity constraints, and corporate investment: Evidence from panel data. The Journal of Finance, 47(4), 1425-1460.