Do customers’ time and effort on services
affect their repurchase behaviour?
An empirical study in a Call Center setting
By
Marisa Fernandes
Master in Services Management Dissertation
Oriented by:
Professor João F. Proença
ii
BIOGRAPHICAL NOTE
Marisa Fernandes graduated in Modern Languages and Literatures - French and English Studies at the Faculty of Letters of the University of Porto. But she soon started to work in the Customer Service of a Portuguese telecommunications company, where she is for the last nine years, developing a professional background on Management and Marketing issues. Her current position deals with the supervision of a Complaints Management and Service Recovery team.
Along with this function, she has been training people in other companies (IEFP, IESF, Espaço Atlântico, Zona Verde and Atlas).
Her professional interests concern Services Management, Marketing and Quality Management subjects.
iii
ACKNOWLEDGEMENTS
During the development of this project, I could count on some people to whom I would like to thank:
Professor João F. Proença, the supervisor of this work. I would never find someone more inspiring to work with. It was a huge privilege and a rewarding experience;
The telecommunications company which allowed me access to its Customer Service database, providing me substantial data to this research;
Sónia Ferreira da Costa and Pedro V. Sousa who received this project in such a generous way;
Raquel Soares, professor at the University of Aveiro, for all the e-mails we shared;
Boaventura S. Ferreira, who had time, patience and kindness to read and revise the final work.
May you know I am truly thankful to all.
iv
ABSTRACT
The purpose of this study was to test the relationship between service convenience (customers’ time and effort expenditures on services) and customer repurchase behaviour, in a Call Center setting. A database of 133 783 customers and 376 057 contacts were analysed in what concerns four Call Center performance indicators, representative of customers’ time and effort: First Call Resolution (FCR), Average Handling Time, Insistence Calls and Repeated Calls.
First Call Resolution and Average Handling Time were proved to be statistical related to repurchase, but Insistence and Repeated Calls were removed since no significant relationship was found. Customers at early stages of their relationship with the service, low value customers and those participating on loyalty programs, were the most sensitive to time and effort expenditures on services. Gender and age do not seem to differentiate customers on convenience orientation.
Further research may study the importance of service convenience in other types of services and seek to understand who convenience-oriented customers are.
Understanding the impact of customers’ time and effort on repurchase and knowing who are the customers less likely to wait and expend efforts, managers must seek to improve Call Centers performance and to select who are the customers to be answered first.
This study is among few empirical studies on service convenience, which assess real customers’ behaviour instead of behavioral intentions or perceptions. It also demonstrates which contractual characteristics strengthen the relationship between service convenience and repurchase.
Keywords: Convenience; Time; Effort; Call Centers; First Call Resolution; Average Handling Time; Repurchase behaviour.
v
Contents
Biographical notes ... ii Acknowledgements ... iii Abstract ... iv Index of contents ... v Index of figures ... vi Index of tables ... viIntroduction and relevance of the study ... 1
Literature review ... 3
1. Convenience ... 4
2. Convenience multidimensional construct ... 5
3. Call Centers ... 8
3.1 Call Centers as Interaction channels ... 8
3.2 Call Centers metrics ... 9
3.3 Call Centers convenience ... 12
The research ... 14 4. Research objectives ... 15 5. Hypothesis development ... 17 6. Data collection ... 21 7. Data analysis ... 24 8. Results ... 26 9. Discussion ... 33
Conclusions and implications ... 35
10. Conclusions and implications ... 36
11. Limitations and suggestions for future research ... 37
vi
Appendix ... 44
Chi Square tests outputs ... 44
Index of figures
Figure 1: Conceptual model of service convenience and repurchase behaviour in a Call Center setting ... 16Index of tables
Table 1: Convenience dimensions by the stages of the consumption process ... 5Table 2: Relationship between service convenience types and dependant variables ... 7
Table 3: Definition and calculation of database items ... 23
Table 4:Classes of the independent variables ... 25
Table 5: Classes of the dependent variables ... 25
Table 6: Classes of the control variables ... 25
Table 7: Customers frequency distributed by classes ... 26
Table 8: Chi-Square test outputs of FCR and repurchase ... 27
Table 9: Percentages of repurchase distributed by FCR, Average Handling Time, Insistence and Repeated Calls ... 28
Table 10: FCR and repurchase Chi Square test, p-value and Phi and Cramer’s V results ... 29
Table 11: Average Handling Time and repurchase Chi Square test, p-value and Phi and Cramer’s V results ... 30
INTRODUCTION AND RELEVANCE OF THE STUDY
The present work focuses on the study of service convenience in a Call Center setting. Service convenience deals with customers’ time and effort expenditures to purchase or use a service and as convenience increases in a service, time and effort required to customers would decrease.
The huge development of information and communication technologies brought not only ease and speed of access to information and communication, but also new demands from consumers. Marketing gained new challenges. Products and services must be delivered easily and quickly, so that the consumer spends minimal time and effort to obtain them. Services create value through performance (Berry et al., 2002) and convenience in services will add value to consumers by reducing the time and effort they spend (Seiders et al., 2005). This is crucial since time and effort are resources people spend to become consumers (Berry et al., 2002). Thus, convenience may represent a distinctive competitive strategy and several studies have reported positive relations between perceived service convenience and consumer satisfaction (Cowell et
al., 2008; Thuy et al., 2011; Chang et al., 2010; Chang et al., 2012).
Call Centers are fundamental to CRM strategies since they are responsible for 70% of the contacts between the company and the customer (Cheong et al., 2008) and customer overall satisfaction with Call Centers services seems to determine the customer satisfaction with the service itself (Cheong et al., 2008). Therefore, it is decisive to ensure customers satisfaction with Call Centers and to identify which performance indicators weigh on it.
APCC (2011, Portuguese Association of Contact Centers) study shows that Call Centers are concerned about minimizing the time and effort spent by the customers: 56% of the Call Centers inquired are available 24 hours a day, 7 days a week, in order to offer a convenient service to customers; 50% of the respondents answer the call in 16 to 30 seconds; The average call duration, in 82% of the companies, is between 2 to 5 minutes; and 68% stated they resolve over 85% of the requests in the first contact. These indicators show Call Centers are concerned about offering a convenient, fast and effortless service to customers. It is expected, therefore, that understanding how Call Centers increase customer convenience, i.e., reduce time and effort, will increase
2
customer satisfaction (Cowell et al., 2008; Thuy et al., 2011) and their loyalty (Chang
et al., 2010).
This research project aims to: (i) relate the concept of service convenience with Call Centers operations; (ii) determine how Call Centers performance may impact on the service repurchase; (iii) explore the factors which can influence the relation between Call Centers performance and service repurchase.
3
LITERATURE REVIEW
4
1. CONVENIENCE
Convenience concept appeared in the literature, for the first time, in Copeland’s goods categories, i.e., “those customarily purchased at easily accessible stores” (Copeland, 1923, p. 282), requiring minimal time and physical or mental effort to acquire (Copeland, 1923). Their unit price does not justify the searching costs in terms of time, money and effort (Copeland, 1923; Holton, 1958). Marketing has noticed a permanent rise in consumer preference for convenience and attribute this to the socioeconomic changes of the second half of the twentieth century (Berry, 1979; Brown, 1989; Brown, 1990; Seiders et al., 2000; Berry et al., 2002; Seiders et al., 2005; McEnally and Brown, 1998; Brown, 1989), which resulted in changes in consumption patterns and in valorisation of time (Anderson, 1971; Anderson, 1972; Berry, 1979). Consumers’ priorities changed (Anderson, 1972) and their available time is perceived as insufficient. Demanding timesaving solutions (Berry, 1979), consumers opened the doors to a convenience-oriented market, which must fulfil immediate needs or wishes, thus releasing time and effort for other tasks (Anderson, 1971). Consumers effort and time expenditures are acknowledged to be non-monetary costs that influence perceived convenience (Seiders et al., 2000).
Generally, convenience orientation deals with people preference for convenience goods and services (Anderson, 1972; Yale and Venkatesh, 1986; Berry et al., 2002). Convenience-oriented consumer is the one who seeks to "accomplish a task in the shortest time with the least expenditure of human energy” (Morganoski, 1986, p. 37). Since individual consumer characteristics may affect the perceived importance of convenience (Farquhar and Rowley, 2009; Berry et al., 2002), several studies have attempted to establish the socioeconomic and demographic factors, such as age, household income, level of education, socioeconomic status, the presence or absence of children, employed or unemployed wives and role overload, which determine the consumers demand for convenient goods and services (Anderson, 1971; Anderson, 1972; Strober and Weinberg, 1977; Strober and Weinberg, 1980; Reilly, 1982; McEnally and Brown,1998; Morganosky, 1986; Brown et al., 1993). Segmenting convenience-oriented consumers, marketing could assign them convenience solutions (Yale and Venkatesh, 1986). Nevertheless, Aagja et al. (2011) show that clusters cannot
5
be profiled based on the demographic factors of respondents and other research studies presents inconclusive results (Berry et al., 2002; Brown and McEnally, 1993). Reilly (1982) argues that the weak theoretical development of the convenience concept justify the poor conclusions of these studies. Researchers do not provide a definition of convenience (Brown and McEnally, 1993; McEnally and Brown, 1998), having assumed that consumers had a common understanding of this concept (Brown and McEnally, 1993).
2. CONVENIENCE MULTIDIMENSIONAL CONSTRUCT
Convenience was treated as a multidimensional construct by different authors (Yale and Venkatesh, 1986; Brown, 1989; Brown and McEnally, 1993; Gehrt and Yale, 1993; Seiders et al., 2000; Berry et al., (2002). Brown (1989), Brown and McEnally (1993); Seiders et al. (2000) and Berry et al. (2002) defined dimensions of convenience according to the stages in the consumption or use process (Farquhar and Rowley, 2009): search of alternatives, access, acquisition, use and post-purchase, which is consistent with services literature, dealing with the service delivery process (Berry et al. 2002), (see table 1).
Time and effort Stages on the
consumption
Search of
alternatives Access Acquisition Use
Post purchase Brown (1989) - Place dimension Acquisition dimension Use Dimension - Execution dimension Brown and McEnally (1993) - - Time and energy in the Acquisition Time and energy in the Consumption Time and energy in the Disposal Seiders et al. (2000) Search Acess Possession - - Transaction Berry et al. (2002) Decision convenience Access convenience Transaction convenience Benefits convenience Post-benefit convenience
Table 1: Convenience dimensions by the stages of the consumption process. Source: authors.
Time and effort (or energy) expenditures are the two elements of convenience most cited in the literature (Berry et al., 2002) and both are present in the convenience definition of the four studies. All of them show the convenience concept standing for
6
the consumers’ time and effort expenditures in the consumption or use process and product or service convenience will increase as time and energy expenditures decrease. The stages considered by these authors are the great distinction among the studies.
Convenience in the search of alternatives or decision convenience refers to the perceived time and effort spent by consumers while choosing which product or service to buy. A convenient service would have sufficient information available to ease the consumer decision (Berry et al., 2002). It is analysed in Seiders et al., (2000) and Berry
et al., (2002) studies.
Access convenience involves time and effort needed to reach a product or service. It may refer to the location proximity, hours of operation (Berry et al., 2002) or waiting queues on the phone. With the exception of Brown and McEnally (1993) all the studies in table 1 cited it.
Acquisition or transaction convenience deals with the perceived time and efforts spent to purchase and acquire the product or service. It may refer to payment issues, like queues to pay the bill in a restaurant, the acceptance of credit cards or the easiness to arrange an appointment. Convenience in the acquisition is analysed in all studies. Brown and McEnally (1993) started their model in the acquisition stage while Seiders et
al., (2000) finished theirs in this stage, maybe because this study reports on a retailing
context, dealing only with shopping convenience, not with the use of the products. Use convenience refers to consumers’ time and effort expenditures in the use of a product or service, for instance, if they meet the consumer needs (Yale and Venkatesh, 1986) and if little effort is required to obtain its core benefits (Berry et al., 2002). It deals with the service core performance. It is referred in all studies except Seiders et al. (2005).
Post purchase convenience refers to the perceived time and effort spent by consumers in post purchase interactions, implicating consumers’ requests or complaints after sales, i.e., after the purchase. It may refer to the repair or exchange of a product, or to the reminders of a doctor's office to schedule routine visits (Berry et al., 2002). Convenience in post purchase is only cited by Brown and McEnally (1993) and Berry et
7
Only Berry et al. (2002) analysed the complete process, from the search of alternatives until the post purchase phase. Research has shown positive relations between Berry et
al.’s (2002) five service convenience dimensions and consumer satisfaction (Cowell et al., 2008; Thuy et al., 2011), perceived quality (Thuy et al., 2011; Chang et al., 2013),
repurchase intentions (Seiders et al., 2007; Aagja et al., 2011; Chang et al., 2012; Chang et al., 2013) and service repurchase (Seiders et al., 2005). Although these relations were proved positive, the five types of convenience can have different importance in the perceived service convenience. Table 2 shows the positive relation between Berry et al.’s (2002) five service convenience dimensions and other dependent variables. Service convenience Study Dependent variables Decision convenience Access convenience Transaction convenience Benefits convenie nce Post benefits convenience Seiders et al. (2005) Repurchase behavior Proved Seiders et al. (2007) Repurchase
intentions Proved Not proved Proved Proved Proved Repurchase
visits Proved Proved Not tested
Not
tested Not tested Repurchase
spending Not tested Not tested Proved
Not
proved Not proved Cowell et al.
(2008) Satisfaction Proved Not proved Not proved Proved Proved Chang et al. (2010) Loyalty Proved THUY et al. (2011) Satisfaction Weak relationship Proved Weak
relationship Proved Proved Aagja et al.
(2011)
Repurchase
intentions Proved Proved
Weak relationship Proved Weak relationship Chang et al. (2012) Repurchase
intentions Not proved Not proved Not proved Proved Proved Chang et al. (2013) Repurchase intention Weak relationship Weak relationship Proved Not
proved Not proved
Table 2: Relationship between service convenience types and other dependant variables. Source: authors
According to Chang et al. (2013) consumers give different importance to the convenience dimensions, depending on the nature of the service involved. Cowell et al. (2008) proved that access and transaction convenience are not relevant to consumer satisfaction, in the context of mobile phone and Internet services. Thuy et al. (2011)
8
showed weak effects of decision and transaction convenience on consumers’ satisfaction of the Vietnam domestic airlines. Chang et al. (2012) found that decision, access and transaction convenience do not have a positive relationship with consumer satisfaction. Aagja (2010) found decision, access and benefits convenience were the most significant in the Indian retail context. Positive relations between service convenience as a whole and repurchase intentions (Seiders et al., 2005) and loyalty (Chang et al., 2010) were also tested.
3. CALL CENTERS
3.1. CALL CENTERS AS INTERACTION CHANNELS
In recent years, the great development and the decreasing costs of telecommunications and information technologies (Feinberg et al., 2000; Aksin et al., 2007) and the importance of developing CRM strategies have up scaled the need of Call Centers by companies (Cheong et al., 2008; Aksin et al., 2007; Jaiswal, 2008). Call Centers may be the core of successful CRM strategies (Michell, 1998; Mattila and Mount, 2003), representing an opportunity for high-volume, low-cost service (Robinson and Morley, 2006; Abdullateef et al., 2010), delivery via telephone-related technology, which has resulted in the enormous worldwide growth of Call Center numbers (Anton, 2000; Dean, 2007).
Important benefits both to companies and customers came with the increase of Call Centers. First, acting as an interaction channel and as an important source of customer-related information (Burgers et al., 2000; Ruyter and Wetzels, 2000; Spencer-Mathews and Rao, 2003), which can be used to improve customer contact service (Spencer-Mathews and Rao, 2003), they play a crucial role in the development and improvement of long-term relationships with customers (Feinberg et al., 2000; Aksin et al., 2007; Abdullateef et al. 2010; van Dun et al., 2011), in the customer loyalty and overall satisfaction control (Cheong et al,. 2008). Second, companies can serve more customers, anytime, with fewer necessary staff (Bennington et al., 2000), decreasing
9
companies’ costs. Third, Call Centers allow customers to access the services more immediately (Betts et al., 2000), through Call Centers’ free numbers (Mattila and Mount, 2003) meeting their convenience demand and working as a competitive advantage when compared to firms only physically available during limited hours (Feinberg et al., 2000). Fourth, Call Centers allow companies to listen to the voice of the customer, which has been defended in marketing theory and practice (Ruyter and Wetzels, 2000), contributing to transform Call Centers in customer-centric organizations (Jaiswal, 2008). They also represent an important channel for customer complaints and customer service recovery (Mount and Mattila, 2000; Mount and Mattila, 2002; Burgers et al., 2000; Matilla and Mount, 2006), since after a service failure; customers expect a speedy and convenient resolution (Mattila and Mount, 2003). Thus, organizations need to manage customer contacts more effectively (Gilmore and Moreland, 2000). Riam (2005) defends that Call Monitoring, i.e., listening and studying customer phone calls, is an important tool to improve service quality, increase firms understanding of their customers, develop employees, and improve service encounters.
Customer satisfaction with a Call Center service is believed to determine the customer satisfaction with the company itself (Anton, 2000), since they represent the main customer-facing channel for many firms (Aksin et al., 2007; Dean, 2004a; Marr and Neely, 2004). Accordingly to Anton et al. (2004) 92% of customers have their opinion about a firm formed by their experience with Call Centers. So, managing customers’ experiences in Call Centers encounters is likely to have important implications for companies’ success (Dean, 2007).
3.2.
CALL CENTERS METRICS
The standard operations and metrics of Call Centers can be summarized as follows: When a customer call arrives, it will be answered or it will be put on hold and asked to wait (average waiting time), but some customers will hang-up before being answered (average abandonment rate). Once answered, the call will have a duration (average talk time), during which the agent may need to put the customer on hold in order to answer or resolve the customer request/complaint (hold time). The customer issue may be
10
resolved on his/her first call and does not need further contacts to resolve the previous reason of calling (Abdullateef et al., 2010) (First Call Resolution) or needed to be analysed by other teams and cannot be closed at that moment. The time it takes to be resolved is called average handling time. When the customer needs to call back again to ask for his/her answer/resolution, while the question is still under analyse, there is an insistence call. But if the customer request/complaint is already closed and the customer calls back for the same reason, there is a repeated call.
Traditional Call Centers have evolved into contact Centers which manage multiple customer communication channels, such as fax, e-mail and Web (Acey, 2002; Cheong
et al., 2008). Despite their exponential growth, little is known about customer
satisfaction (Bennington et al., 2000; Miciak and Desmanais, 2001; Kolar, 2006), customer expectations (Burgers et al., 2000) or perceived customer quality (Jaiswal, 2008; Miciak and Desmanais, 2001; Kolar, 2006) with Call Centers performance, which Anton (1997) suggests combining in two types of indicators.
The first are qualitative, intangible metrics, which measure caller perceptions of the interaction with the Call Center agents (Gilmore and Moreland, 2000). Call Centers agents competencies, were proved to have impact on customers’ satisfaction (de Ruyter and Wetzels, 2000; Mount and Matilla, 2002), on customers’ affective commitment and loyalty (Dean, 2007), on customers’ expectations (Dean, 2004b) and on repurchase intentions (Pontes and Kelly 2000). While dimensions of listening behaviour (de Ruyter and Wetzels, 2000; Mount and Mattila, 2002), such as attentiveness and perceptiveness (Mount and Mattila, 2002), and Call Centers agents’ customer orientation (Dean, 2007), proved to have a positive impact on customers’ satisfaction, lack of authority to make decisions, on the contrary, has a significant negative impact on customer satisfaction (Mount and Mattila, 2000). Adaptiveness, assurance, empathy, authority (Burgers et al., 2000) and customer feedback and focus (Dean, 2004a) are customers’ expectations about Call Centers agents behaviour. Dean (2004b) study distinguished individual and business customers’ expectations regarding the interaction with Call Centers and found that individual customers gave preference to friendly, helpful staff and Call Centers agents’ competencies, attitudes and knowledge, while business customers’ emphasis was on rapid outcomes and efficient problem resolution.
11
The second are quantitative metrics, which focus mainly on operational indicators, such as waiting time, hold and average talk time, and are known as key performance indicators (KPIs). They are critical for the success of Call Centers (Jouini et al., 2013) and performance evaluation is frequently done on their basis (Jaiswal, 2008). See Anton (1997), Feinberg et al. (2000) and Jaiswal (2008) for common Call Centers KPIs. There is no suggestion in the Call Center research literature of what performance indicators influence consumer satisfaction (Feinberg et al., 2000), but Anton (1997) provided a list of indicators which measures the quality of the Call Center services. From these indicators, Feinberg et al. (2000) demonstrated that only percentage of calls closed on first contact and average abandonment rate were determinants of customers satisfaction. The percentage of calls blocked (calls that received the busy tone), average speed of answer (average time it takes for the call to be picked up), and service level (calls answered within a specified number of seconds) were the factors that determine customer satisfaction in Cheong et al. (2008) research. Operational Call Center indicators, however, proved to have little impact on customer satisfaction (Feinberg et
al., 2000; Feinberg et al., 2002; van Dun et al., 2011) and to be little related to
customers’ perception about service quality (Jaiswal, 2008). Other variables must determine customer satisfaction with Call Centers (Jaiswal, 2008; Dean, 2004b) and other research should seek to determine what will satisfy customers on the Call Centers setting (Robinson and Morley, 2006).
Many Call Center agents are, in fact, pressed between maintaining quality service standards and meeting productivity goals (Robinson and Morley, 2006; Gilmore and Moreland, 2001). Several authors have claimed that Call Center managers are focused on operational measures believing they determine customers satisfaction with the service (Marr and Neely, 2004; Miciak and Desmanais, 2001), and missing the real factors influencing customers satisfaction with Call Centers. Managers appear to focus in productivity, rather than customer demands (Staples, 2002) or ability to improve customer service (Robinson and Morley, 2006) and a production line (Staples, 2002; Robinson and Morley, 2006) or Tayloristic approach (Marr and Neely, 2004) seems to be utilized in Call Centers management, since operators are often required to answer a
12
great number of calls (Staples, 2002). Call Centers are cost/production-oriented and are not responding to a demanding customer-oriented approach (Kolar, 2006).
3.3. CALL CENTERS CONVENIENCE
Although several studies have stated that quantitative metrics of Call Centers do not represent customer service goals (Robinson and Morley, 2006) or customer satisfaction with the service (Feinberg et al., 2000), they are representative of consumers’ time and effort expenditures and literature has found clues of their impact on consumers’ satisfaction with Call Centers services.
Kolar (2006) found that one of the criteria to achieve excellence in Call Centers quality, as it focuses on customers’ expectations, is the customer sacrifice minimization, such as time, efforts and psychological costs. The most important benefit of telephone interactions is speed (which saves time) and the fact that they simplify customers’ life (Kolar, 2006), reducing customers’ effort, which is consistent with convenience literature. In fact, customers seem to be concerned with speedy services and are less likely to be tolerant with time based problems (Dean, 2004b). Bennington et al. (2000) defend that from the customer's perspective, the main Call Center benefits are convenience, flexibility and customization. Almost all Call Centers are active 24 hours a day, 365 days a year (Lau and Chan, 2012), meeting consumers convenience demand. Having reached parity in price and quality “the paradigm shift is definitely towards customer accessibility” (Anton, 2000, p.124). Consumers appreciate timely accessibility (Anton, 2000; van Dun et al., 2011) and access to information at any time, from anywhere, in any form, and for free (Anton, 2000). Timeliness to resolve a customer issue is an important determinant of customer satisfaction with Call Centers (Matilla and Mount, 2006) and satisfaction will be lower when the delay is perceived as unnecessary than when such a delay is justified in the customer’s mind (Matilla and Mount, 2006). Van Dun et al. (2011) found evidence of customer perceived contact Center quality in seven dimensions. Four of them concern qualitative issues (empathy, customer knowledge, customer focus, user friendliness of the voice response unit), but the other three (reliability, waiting cost and accessibility) meet quantitative metrics,
13
related to consumers’ time and effort. The reliability of the Call Center depends on whether customers need to call more than once (First Call Resolution) to receive an accurate answer (van Dun et al. 2011). Waiting costs deal with the time customers must wait when they contact the Call Centers (Time in queue, Average talk time; Hold). Accessibility, consisting of hours of operation and easy to find the number customers need to dial (van Dun et al., 2011).
In the context of Call Centers, service quality (Dean, 2002) and customer satisfaction (Lau and Chan, 2012) were proved to have impact on customer loyalty. Since consumers are less satisfied with Call Center services than they are with office-based in-person services (Bennington et al., 2000), research need to analyze which Call Center factors directly affect consumers overall satisfaction and loyalty.
14
THE RESEARCH
15
4. RESEARCH OBJECTIVES
The exponential growth of Call Centers due to their importance as communication channels and their crucial role in CRM strategies (Cheong et al., 2008) brought attention to their performance. Call Centers are now concerned about offering a convenient, fast and effortless service to customers, in order to ensure their satisfaction.
Literature has shown that in the Call Centers context, service quality (Dean, 2002) and customer satisfaction (Lau and Chan, 2012) affects customer loyalty. Nevertheless, there is no consensus about which metrics impact on consumers overall satisfaction and not always research has found positive relations between all Call Center performance indicators and customer satisfaction (Feinberg et al., 2000; van Dun et al., 2011; Jaiswal, 2008), therefore, other research should seek to determine what will satisfy customers on the Call Centers setting (Robinson and Morley, 2006). In fact, there is a lack of studies, in the Call Centers setting, concerning the relationship between service convenience and customers’ satisfaction or repurchase behaviour.
Convenience in services adds value to consumers by reducing the time and effort they spend (Seiders et al., 2005). Research shows the consumers preoccupations about time and effort expenditures on their interactions with Call Centers, namely in what concerns accessibility (Anton, 2000), timeliness (Mattila and Mount, 2006), and Call Center agents’ responsiveness on first contact (van Dun et al., 2011).
We aimed to explore service convenience in a Call Center setting through four performance indicators, representative of customers’ time and effort expenditures on their interactions with Call Centers: First Call Resolution, Average Handling Time, Insistence Calls and Repeated Calls (see literature review, section 3.2.), and their relation with repurchase behaviour.
The objectives of this study are as follows:
16
- To focus on Call Centers indicators which represent consumers’ time and effort expenditures, namely First Call Resolution, Average Handling Time, Repeated Calls and Insistence Calls.
- To analyze the relationship between service convenience, measured through First Call Resolution, Average Handling Time, Repeated Calls and Insistence Calls, and customers repurchase behaviour.
- To analyze the relationship between service convenience (measured through First Call Resolution, Average Handling Time, Repeated Calls and Insistence Calls), and customers repurchase behaviour, in different groups, according to:
a) demographic factors (age and gender), b) customer-service relationship age, c) loyalty programs participation, d) customer value.
Figure 1 represents the research model.
Figure 1: Conceptual model of service convenience and repurchase behaviour in a Call Center setting (the metrics of
“First Call Resolution”, “Average Handling Time”, Insistence Calls” and “Repeated Calls” are presented below, see Table 3). Source: authors
A Call Center database was used for collecting the data. We expect the research will contribute to the identification of how Call Centers performance - in what concerns customers’ time and effort expenditures - may impact on the service repurchase.
17
5. HYPOTHESIS DEVELOPMENT
The research model was established and the hypotheses were formulated. The hypotheses refer to the relationship between Call Center indicators and customers’ repurchase behaviour. According to Seiders et al. (2005), repurchase may mean repeating visits to the service and/or increasing the amount spent on the service. This research will consider repurchase behaviour as the repeated use of service, i.e., if the customer keeps the service active, in opposition to deactivation, considering that we use a database of customers with contractual relations, involving the repeated use of the service, for more or less long periods. Literature has shown positive relations between perceived service convenience and consumer satisfaction (Cowell et al., 2008; Thuy et
al., 2011; Chang et al., 2010; Chang et al., 2012), perceived quality (Thuy et al., 2011;
Chang et al., 2013), repurchase intentions (Seiders et al., 2007; Aagja et al., 2012; Chang et al., 2012; Chang et al. 2013) and service repurchase (Seiders et al., 2005). Service convenience has also proved to have a positive moderating effect on the relationship between satisfaction and repurchase behaviour (Seiders et al., 2005).
As stated before, in a Call Centers setting, consumers show preoccupations about time and effort expenditures on their interactions with this service, namely in what concerns accessibility (Anton, 2000), timeliness (Mattila and Mount, 2006), and Call Center agents’ responsiveness on first contact (van Dun et al., 2011). In fact, First Call Resolution (Feinberg et al., 2000; van Dun et al., 2000) and timeliness in response, i.e, Average Handling Time (Mattila and Mount, 2006) were proved to be determinants of customers’ satisfaction. A SQM study reports that increasing 1% of FCR would increase 1% of customers satisfaction (SQM, 2007) and states that FCR is the most important Call Center metric for customers. Insistence and Repeated Calls result of the inability to resolve customers’ issues at their first call. As these four metrics are representative of customers’ time and effort to have their requests or complaints resolved, we expect they have impact on customers repurchase behaviour.
18 H1 a) There is a positive relationship between FCR and customers repurchase behaviour. This means that high FCR rates are expected to imply higher repurchase
behaviour.
H1 b) There is a positive relationship between Handling Time and consumers repurchase behaviour. This means that low Average Handling time is expected to imply
higher repurchase behaviour.
H1 c) There is a negative relationship between Insistence Calls and repurchase behaviour. This means that high percentages of Insistence Calls are expected to imply
low repurchase behaviour.
H1 d) There is a negative relationship between Repeated Calls and consumers repurchase behaviour. This means that high percentages of Repeated Calls are expected
to imply low repurchase behaviour.
Research showed demographic factors which explain the demand for convenience (Anderson, 1971; Anderson, 1972, McEnally and Brown, 1998; Morganosky, 1986). Demographic factor of age (McEnally and Brown, 1998) was proved to be determinant of convenience oriented customers. Morganosky (1986) stated that consumers below 30 years of age were more likely to convenience products (such as disposable diapers or prepared food). Anderson (1971) research showed that families between 25 to 40 years were more convenience-oriented than those under 24 or above 60 years. Chang et al. (2012) call for research analyzing demographic factors in the preference for convenience and Seiders et al. (2005, p.30) state that “customer characteristics explain variations in the satisfaction–repurchase“, so we expect the same is true for convenience–repurchase behaviour. Therefore, the second group of hypotheses is formulated:
H2 a) The relationship between FCR and repurchase behaviour is higher on younger customers.
H2 b) The relationship between Average Handling Time and repurchase behaviour is higher on younger customers.
H2 c) The relationship between Insistence Calls and repurchase behaviour is higher on younger customers.
19 H2 d) The relationship between Repeated Calls and repurchase behaviour is higher on younger customers.
Literature lacks research in what concerns gender convenience orientation. Several studies analyzed housewives and mothers convenience orientation, since female
increasing employment may lead to perceptions of increasing time pressure (Strober and Weinberg, 1977; Morganosky, 1986) and, therefore, to demand for convenient products and services. But males were excluded from these researches. McEnally and Brown (1998) included the variable of gender in their study about convenience oriented customers and yet found weak relations between gender and convenience orientation. We expect, then, to fulfil this shortage. As men employment rates are higher than women’s, so time pressure and convenience orientation are expected to be. Therefore, the third group of hypotheses is formulated:
H3 a) The relationship between FCR and repurchase behaviour is higher on male customers.
H3 b) The relationship between Average Handling Time and repurchase behaviour is higher on male customers.
H3 c) The relationship between Insistence Calls and repurchase behaviour is higher on male customers.
H3 d) The relationship between Repeated Calls and repurchase behaviour is higher on male customers.
“Relational characteristics represent formal and informal bonds between the firm and its customers” (Seiders et al., 2005, p.30). They can work as switching barriers, creating competitive advantages to the companies (Seiders et al., 2005), since loyalty programs participants will be more willing to purchase in the companies with which they have ties (Seiders et al., 2005). Relationship age and loyalty programs participation are both relational characteristics, which represent “customers’ investments in building or formalizing relationships with a specific firm” (Seiders et al., 2005, p.30). Both had a moderating role in the relationship between satisfaction and repurchase behaviour, in a context of contractual services (Seiders et al., 2005). We will consider the two relational
20
characteristics separately since loyalty programs participation usually implies contractual relations, with penalties supported by the customer in case of abandonment, so an exit barrier, while relationship age seems to increase the customers willingness to expend time and effort in their relationship with the service (Chang et al,. 2012). We expect, therefore, that customers with shorter relationships with the service would be less willing to expend time and effort on services. As customers participating on loyalty programs have greater barriers to exit, we expect that those who don’t will be more sensitive to time and effort expenditures on services. So, the fourth and fifth groups of hypotheses are formulated:
H4 a) The relationship between FCR, and repurchase behaviour is higher on customers with shorter relationship age with the service.
H4 b) The relationship between Average Handling Time and repurchase behaviour is higher on customers with shorter relationship age with the service.
H4 c) The relationship between Insistence Calls and repurchase behaviour is higher on customers with shorter relationship age with the service.
H4 d) The relationship between Repeated Calls and repurchase behaviour is higher on customers with shorter relationship age with the service.
H5 a) The positive relationship between FCR and repurchase behaviour is higher on customers not participating in loyalty programs.
H5 b) The relationship between Average Handling Time and repurchase behaviour is higher on customers not participating in loyalty programs.
H5 c) The relationship between Insistence Calls and repurchase behaviour is higher on customers not participating in loyalty programs.
H5 d) The relationship between Repeated Calls and repurchase behaviour is higher on customers not participating in loyalty programs.
Families with higher incomes were proved to be more convenience-oriented that those with lower average incomes (Anderson, 1971) and as income increases, so does convenience preference (McEnally and Brown, 1998). Armistead and Kiely (2003) state that richer customers were expected to pay more for what meets their convenience
21
needs, i.e., when richer customers are time poor they will be willingly to pay for convenience. Considering that healthier customers are those who spend more, so high value customers for the firm, and those who will be willing to pay for convenient services, we formulate the sixth group of hypotheses:
H6 a) The relationship between FCR and repurchase behaviour is higher on high value customers.
H6 b) The relationship between Average Handling Time and repurchase behaviour is higher on high value customers.
H6 c) The relationship between Insistence Calls and repurchase behaviour is higher on high value customers.
H6 d) The relationship between Repeated Calls and repurchase behaviour is higher on high value customers.
6. DATA COLLECTION
Chang et al. (2012) call for research on the repurchase behaviour rather than behavioural intentions, since it is hard to assess future customer behaviour and behavioural intentions do not always prove to be in accordance with the actual behaviour (Seiders et al,. 2005; Chang et al., 2012). This research discusses customer behaviour through Call Center data analysis. We collected the data from a Portuguese Call Center database, in the telecommunications industry, to test our research model. The selection of a telecommunications setting was done by convenience of database accessibility and because telecommunications are one of the leading sectors using Call Centers to provide customer service. The telephony market where this Call Center operates is a highly competitive one, and providing good service to customers constitutes a competitive strategy (Aguir, 2004).
The objective of our study is to focus on customers who have contacted the telecommunications company’s Call Center for a specific period of time (the first semester of 2012, i.e., between the 1st of January 2012 and the 30th of June 2012),
22
examine their calls and the Call Center performance handling them, in what concerns customers’ time and effort expenditures to have their issues resolved, and the impact of this performance on service repurchase, using a longitudinal study. The performance of the Call Center dealing with these interactions was analyzed concerning four metrics: First Call Resolution, Handling time, Insistence calls, and Repeated calls. These four metrics were chosen because they are representative of customers’ time and effort expenditures to have their questions resolved. Exploratory interviews to four Call Center managers asked them to list Call Center performance indicators which may represent consumers’ time and effort expenditures. Other metrics in the customers’ interactions with Call Centers also came up as representative of time and effort (average
time in queue, average abandonment rate, average time before abandoning, hold time, talk time), but they were withdrawn from our research model because the database
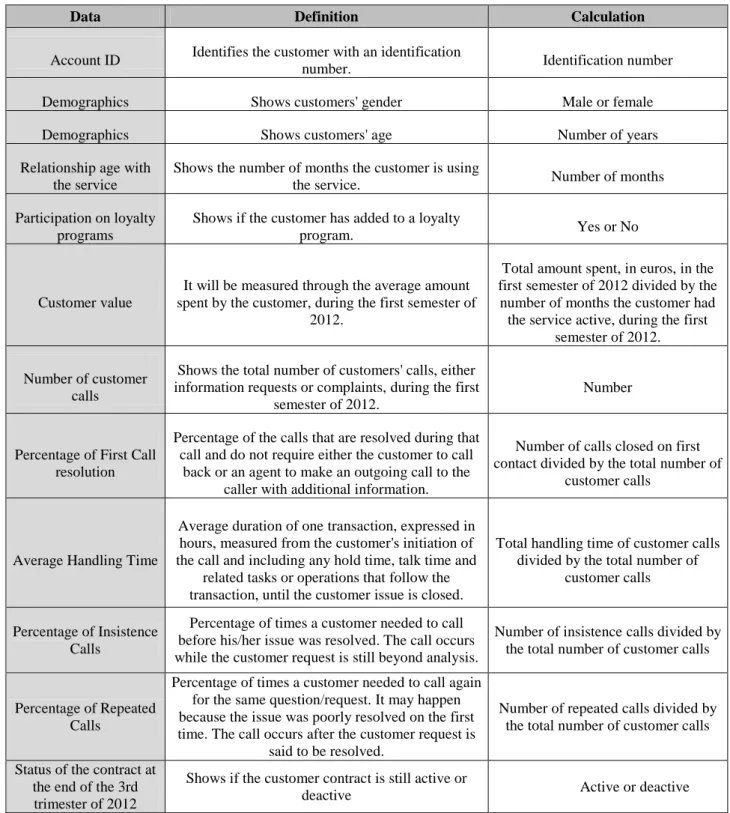
could not provide customers details before the call was answered. Repurchase behaviour will be measured three months after the contacts occurred: at the end of the third trimester of 2012. The database has a sample of 133 783 customers who all together did 376 057 contacts to the Call Center (an average of 2.8 calls per customer), during the first semester of 2012. The control variable of age will use a shorter database, of 17 857 customers, because the company lacks this information for a great part of its customers. Table 3 shows the available data for each customer in our database, their definition and calculation.
23
Data Definition Calculation
Account ID Identifies the customer with an identification
number. Identification number Demographics Shows customers' gender Male or female Demographics Shows customers' age Number of years Relationship age with
the service
Shows the number of months the customer is using
the service. Number of months Participation on loyalty
programs
Shows if the customer has added to a loyalty
program. Yes or No
Customer value
It will be measured through the average amount spent by the customer, during the first semester of
2012.
Total amount spent, in euros, in the first semester of 2012 divided by the number of months the customer had the service active, during the first
semester of 2012.
Number of customer calls
Shows the total number of customers' calls, either information requests or complaints, during the first
semester of 2012.
Number
Percentage of First Call resolution
Percentage of the calls that are resolved during that call and do not require either the customer to call
back or an agent to make an outgoing call to the caller with additional information.
Number of calls closed on first contact divided by the total number of
customer calls
Average Handling Time
Average duration of one transaction, expressed in hours, measured from the customer's initiation of the call and including any hold time, talk time and
related tasks or operations that follow the transaction, until the customer issue is closed.
Total handling time of customer calls divided by the total number of
customer calls
Percentage of Insistence Calls
Percentage of times a customer needed to call before his/her issue was resolved. The call occurs while the customer request is still beyond analysis.
Number of insistence calls divided by the total number of customer calls
Percentage of Repeated Calls
Percentage of times a customer needed to call again for the same question/request. It may happen because the issue was poorly resolved on the first time. The call occurs after the customer request is
said to be resolved.
Number of repeated calls divided by the total number of customer calls
Status of the contract at the end of the 3rd trimester of 2012
Shows if the customer contract is still active or
deactive Active or deactive
24
7. DATA ANALYSIS
Database analysis was performed as follows. A Chi Square test was performed to assess if there is a relationship between our variables and how this relationship varies across classes of customers.
Chi-Square is sensitive to sample size, which means that having a higher Chi-Square value (X²) does not represent a more significant association between variables, because the sample size is taken in account (Pestana e Gageiro, 2003). A α <.05 was adopted for all the statistical tests, so a p-value less than .05 will reject the null hypothesis (H0: The
variables are independent) and confirm a relationship between variables (H1: The variables are dependent). Whenever we had a statistically significant p-value (<.05),
we also performed the Phi or Cramer’s V coefficient, which is analyzes the relative strength and direction of a statistically significant relationship between variables (Hinkle et al., 2003). Phi is not affected by sample size and therefore is useful in situations where we have statistical significant Chi-Square between two variables but we suspect it was the result of large sample size instead of any substantive relationship between the variables. In fact, Chi-square test just says whether the variables are dependent, does not states the degree of association (Pestana e Gageiro, 2003). The Phi and the Cramers V ranges in value from -1 to+1. Values close to 0 indicate a very weak relationship, and values close to +1 indicate a very strong relationship. If the row and column variables are qualitative (i.e., categorical or nominal), the sign of phi is not meaningful and any negative Phi values can be changed to positive values without affecting their meaning (Hinkle et al., 2003). According to Hinkle et al., (2003) a Phi value of .10, .30, and .50 represent small, medium, and large effect sizes, respectively. However, what is a small versus a large Phi should be dependent on the area of investigation. Phi is only used on 2x2 contingency tables, if the table has more than two levels Cramer’s V coefficient rescales Phi coefficient.
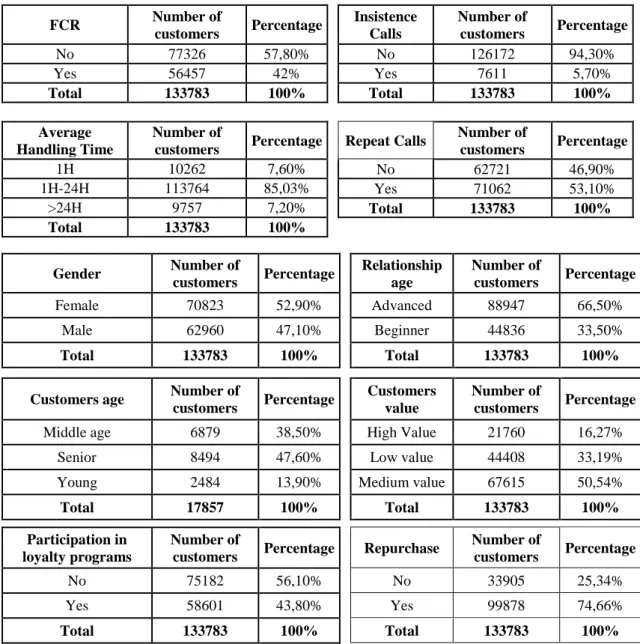
In order to measure the impact of the predictive indicators on repurchase behaviour, customers were divided into classes, see table 4 for independent variables classes, table 5 for dependant variable classes and table 6 for control variables classes. Table 7 shows the frequency of each class, in number of customers and percentages.
25
Independant
variables Class Description
FCR (First Call Resolution)
FCR Yes
Customers who had 100% of their contacts with FCR, meaning they always had their requests/complaints resolved at their first contact.
FCR NO Customers who had less than 100% of FCR, meaning they did not have their resolution at first contact, at least once.
Average Handling Time
1hour Customers whose requests/complaints average handling time was up to an hour.
1-24h Customers whose requests/complaints average handling time was between 1 to 24 hours.
>24h Customers whose requests/complaints average handling time was more than 24 hours.
Insistence Calls
Insistence Calls Yes Customers who had to call again for the same request/complaint at least once.
Insistence Calls No Customers who never had to call back for the same request/complaint.
Repeated Calls
Repeated Calls Yes Customers who had to repeat the call at least once. Repeated Calls No Customers who never had to repeat the call.
Table 4: Classes of the independent variables. Source: authors
Dependant variable Class Description
Repurchase
Repurchase Yes
Customers who had the service active at the end of third trimester of 2012.
Repurchase No Customers who did not have the service active at the end of third trimester of 2012.
Table 5: Classes of the dependent variables. Source: authors
Control variables Class Description
Age
Young 0-45 years Middle age 46-65 years Senior >65 years Gender Female Female customers
Male Male customers
Relationship age
Beginner Customers who are using the service up to 24 months. Advanced Customers who are using the service for more than 24
months. Participation in
Loyalty Programs
Loyalty Programs Yes Customers who belong to a loyalty program. Loyalty Programs No Customers who do not belong to a loyalty program.
Customer value1
Low value Customers who spend, in average, the minimum amount of the rate plan.
Medium value Customers who spend, in average, between the minimum and twice the amount of the rate plan.
Senior value Customers who spend, in average, more than twice the amount of the rate plan.
Table 6: Classes of the control variables. Source: authors
1
Customer value classes were defined according to the service rate plans. The amount of 12,50EUR was considered as the minimum amount of the rate plan to define customer value classes.
26 FCR Number of customers Percentage Insistence Calls Number of customers Percentage No 77326 57,80% No 126172 94,30% Yes 56457 42% Yes 7611 5,70% Total 133783 100% Total 133783 100% Average Handling Time Number of
customers Percentage Repeat Calls
Number of customers Percentage 1H 10262 7,60% No 62721 46,90% 1H-24H 113764 85,03% Yes 71062 53,10% >24H 9757 7,20% Total 133783 100% Total 133783 100% Gender Number of customers Percentage Relationship age Number of customers Percentage Female 70823 52,90% Advanced 88947 66,50% Male 62960 47,10% Beginner 44836 33,50% Total 133783 100% Total 133783 100% Customers age Number of
customers Percentage
Customers value
Number of
customers Percentage
Middle age 6879 38,50% High Value 21760 16,27% Senior 8494 47,60% Low value 44408 33,19% Young 2484 13,90% Medium value 67615 50,54%
Total 17857 100% Total 133783 100% Participation in
loyalty programs
Number of
customers Percentage Repurchase
Number of
customers Percentage
No 75182 56,10% No 33905 25,34% Yes 58601 43,80% Yes 99878 74,66%
Total 133783 100% Total 133783 100%
Table 7: Customers frequency distributed by classes. Source: authors
8. RESULTS
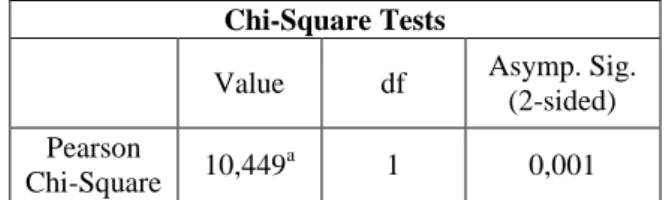
Table 8 shows the Chi Square test outputs: X², p-value and Phi’s and Cramer’s V coefficients, for the associations between FCR, Average Handling Time, Insistence Calls and Repeat Calls and Repurchase. Analyzing the p-value, which is <.05, we confirm all the associations. Nevertheless, when we look at Phi’s or V’s coefficients we realize the associations are weak. Note that we used V’s coefficient on the association
27
between Average Handling Time and repurchase, because it is not a 2x2 contigency table, as Average Handling Time has 3 classes. FCR and Handling time are the variables with a stronger relationship with repurchase.
Repurchase
Chi Square p-value Phi Cramer’s V
FCR X²=1022,079 p=.000 .087
Handling Time X²=2349,599 p=.000 .133 Insistence Calls X²=10,449 p=.001 -.009
Repeat Calls X²=490,606 P=.000 -.061
Table 8: Chi Square test outputs of FCR and Repurchase. Source: authors
Despite the weak Phi’s and V’s values, they are representative to our study.
The relationship between FCR and Repurchase got a Phi’s =.087, statistically supporting the hypothesis: H1 a) First Call Resolution has a positive relationship with
consumers repurchase behaviour. Though it is a small association, if we analyze table
9, we realize that Repurchase increased from to 71.4% to 79.1%, when we distinguished from FCR No to FCR Yes.
Average Handling Time got the highest V’s value (.133), statistically supporting the hypothesis: H1 b) Handling Time has a positive relationship with consumers
repurchase behaviour. As handling time reduced from more than 1 day to less 1 hour,
repurchase increased 20,9%. Note that Repurchase increased along with the reduction of Average Handling Time (>24H = 55,9%, 1-24H=66,7% and <1H=76,8%), what reinforces the statistical result.
Insistence Calls X² value (X² =10,449) was significantly lower than with the other variables and Phi value = -.009 was almost null. We rejected H2 c) There is a negative
relationship between Insistence Calls, and repurchase behaviour, and withdraw
Insistences Calls from our research model.
Since Phi’s values show a very weak relationship (= -.061) in the association between Repurchase and Repeated Calls, we also rejected the hypothesis H1 d) There is a
28
FIRSTCALLRESOL * REPURCHASE INSISTENCECALLS * REPURCHASE
REPURCHASE Total REPURCHASE Total NO YES NO YES FCR NO 28,60% 71,40% 100% Insistence Calls NO 25,2% 74,8% 100% YES 20,90% 79,10% 100% YES 26,9% 73,1% 100% Total 25,30% 74,70% 100% Total 25,3% 74,7% 100%
HANDLING TIME * REPURCHASE
REPURCHASE Total REPEATCALLS * REPURCHASE NO YES REPURCHASE Total Handling Time 1H 23,20% 76,80% 100% NO YES 1H-24H 33,30% 66,70% 100% Repeat Calls NO 22,50% 77,50% 100% >24H 44,10% 55,90% 100% YES 27,80% 72,20% 100% Total 25,30% 74,70% 100% Total 25,30% 74,70% 100%
Table 9: Percentages of repurchase distributed by FCR, Handling time, Insistence and Repeat Calls. Source: authors
The following Chi Square tests were performed adding a third variable. We are still examining the relationship between the independent variables and the dependent variable, but now using a variable of control. The complete outputs of the performed Chi-Square tests can be seen on the appendix 1 to the appendix 14.
First Call Resolution * Repurchase
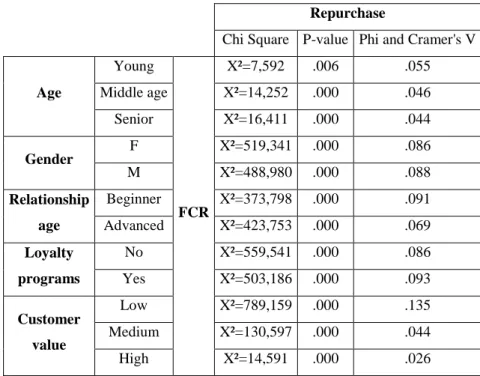
Table 10 shows the results of Chi Square, p-value and Phi or Cramer’s V, on the association between our four independent variables and Repurchase, using gender, customer’s age, relationship age with the service, participation on loyalty programs and customers’ value as control variables. Again, P-values <.05 confirmed the association between variables in all cases.
The strength of the association between FCR and Repurchase decreases with age (young V=.055, middle age V=.46 and senior V=.044), confirming the hypothesis: H2
a) The relationship between First Call Resolution and repurchase behaviour is higher on younger customers. However the difference is too little to be significant. Remember
that X² values are lower in what concerns age since the sample is quite lower too (only 17 857 customers versus 133 783 in the other control variables). The relationship between FCR and Repurchase was almost the same between genders, though a little higher on males (V=.088) than on females (V=0.86). Nevertheless, the difference (.002)
29
is too little, rejecting our hypothesis H3 a) The relationship between First Call
Resolution and repurchase behaviour is higher on male customers.
In what concerns relationship age with the service, beginner customers (V=.091) are more sensitive to FCR than advanced customers (V=.069). Our hypothesis H4 a) The
relationship between First Call Resolution and repurchase behaviour is higher on customers with shorter relationship age with the service, is supported. Note (Appendix
8.1: Crosstabulation of FCR*Repurchase*Relationship age) that repurchase increases 9% on beginner customers, as we move from FCR No to FCR Yes and only 5,6%, on advanced customers.
Repurchase
Chi Square P-value Phi and Cramer's V
Age Young FCR X²=7,592 .006 .055 Middle age X²=14,252 .000 .046 Senior X²=16,411 .000 .044 Gender F X²=519,341 .000 .086 M X²=488,980 .000 .088 Relationship age Beginner X²=373,798 .000 .091 Advanced X²=423,753 .000 .069 Loyalty programs No X²=559,541 .000 .086 Yes X²=503,186 .000 .093 Customer value Low X²=789,159 .000 .135 Medium X²=130,597 .000 .044 High X²=14,591 .000 .026
Table 10: FCR and repurchase Chi Square test, p-value and Phi and Cramer’s V results. Source:authors
Customers who participate on loyalty programs (V=.093) are, as well, more sensitive to FCR than those who don’t (V=.086). We then reject the hypothesis H5 a) The
relationship between First Call Resolution, and repurchase behaviour is higher on customers not participating in loyalty programs. Repurchase with FCR Yes increased
7,6% moving from customers who don’t participate in loyalty programs to those who do, what is significant in our database (Appendix 7.1: Crosstabulation of FCR*Repurchase*Participation on Loyalty Programs). The abandon of the service (Repurchase No), for customers participating on loyalty programs increased 7,6% (from
30
16,6% to 24,2%), when there are not FCR. This reinforces the statistical result which shows customers participating on loyalty programs are more sensitive to convenience. At last, low value customers show the highest association between FCR and Repurchase (V=.133). In fact, as customer value increases the strength of this association seems to decrease (low value V=.133; medium value V=.044; high value V=.026), what rejects the hypothesis: H6 a) The relationship between First Call Resolution, and repurchase
behaviour is higher on high value customers. Even if we had predicted a different
orientation, this is an important finding. Note (Appendix, Table 9.1: Crosstabulation of FCR*Repurchase*Relationship age) that repurchase increases 13% (representing 17391 customers) in low value customers moving from FCR No to FCR Yes, 3,1% in medium value customers and only 2,5% in high value customers.
Handling time * Repurchase
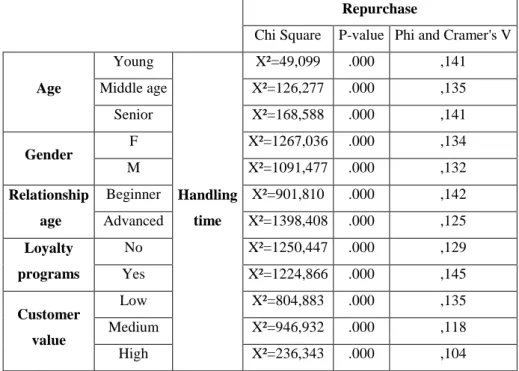
The relationship between Handling time and Repurchase was already confirmed in table 4 with a p-value <.05 and a Phi=.133, the highest we got. We present now this relationship adding our control variables. P-values <.05 confirmed the dependence of all the variables (see table 11). Despite that, we need to analyze Cramer’s values, to confirm the association between variables.
Repurchase
Chi Square P-value Phi and Cramer's V
Age Young Handling time X²=49,099 .000 ,141 Middle age X²=126,277 .000 ,135 Senior X²=168,588 .000 ,141 Gender F X²=1267,036 .000 ,134 M X²=1091,477 .000 ,132 Relationship age Beginner X²=901,810 .000 ,142 Advanced X²=1398,408 .000 ,125 Loyalty programs No X²=1250,447 .000 ,129 Yes X²=1224,866 .000 ,145 Customer value Low X²=804,883 .000 ,135 Medium X²=946,932 .000 ,118 High X²=236,343 .000 ,104
Table 11: Handling time and repurchase Chi Square test, p-value and Phi and Cramer’s V results. Source: authors
31
Young and senior customers had the same V’s coefficient (.141) rejecting the hypothesis H2 b) The relationship between Average Handling Time and repurchase
behaviour is higher on younger customers.
V’s for males (.134) and females (.132) were almost the same rejecting also the hypothesis H3 b) The relationship between Average Handling Time and repurchase
behaviour is higher on male customers.
Relationship age with the service, however, found different values. Beginner customers had a higher V’s (.142) than advanced customers (.125), supporting the hypothesis H4
b) The relationship between Average Handling Time and repurchase behaviour is higher on customers with shorter relationship age with the service. We must notice
(Appendix 12.1: Crosstabulation AHT*Repurchase*Relationship Age.) that in beginner customers, repurchase increased 23,5% as we move from more than 24H of Average Handling Time to 1H. In advanced customers the increase is only of 19,1%.
The participation on loyalty programs (V=.145 versus V=.129) seems to increase the importance of the association between Average Handling Time and Repurchase. Since we predicted the opposite, the hypothesis H5 b) The relationship between Average
Handling Time and repurchase behaviour is higher on customers not participating in loyalty programs was rejected.
As customers value increases, the importance of this relationship (Average Handling Time and Repurchase) seems to decrease (low value customers V=.135, medium value customers V=118, high value customers V=104). In fact, low value customers demonstrated the highest V’s value, rejecting the hypothesis H6 b) The relationship
between Average Handling Time and repurchase behaviour is higher on high value customers. In spite of having predicted the opposite, this is an important finding.
Appendix 14.1 shows an increase of 21,1% in low value customers repurchase, as Average Handling Time reduces from more than 1 day to less than 1 hour. In high value customers the increase is of 18,1%.