1 Introduction
Family farms are the most prevalent form of agriculture in the world (more than 570 million farms in the world), with estimates that suggests that they occupy around 70–80 percent of farm land and produce more than 80 percent of the world’s food (FAO 2014). The notion of family farming is imprecise, but most definitions refer to small farms, family owned and operated, and relying primarily on family labour. The size of family farms is variable, but typically stands under 3.5 ha (Lowder 2016).
In order to contribute to local food availability, job creation, income and local economy diversification, family farmers depend on several key factors, such as agro-ecological conditions and territorial characteristics; access to land and natural resources; access to training, technology and extension services; demographic, economic and socio-cultural conditions (Suess-Reyes and Fuetsch 2016).
In fact, family farmers are in general less able to shift from a traditional production system to new approaches that enable the adoption of innovation and at the same time that contribute to the renouncement of unsustainable practices such as the use of intensive tillage or pesticides. Lack of education, training and technical support, farm dimension and age are among the reasons that make such changes difficult (Fertö and Forgács 2010: 15; Ngowi et al. 2007; Soule 2001; Whitford et al. 2006).
These factors might limit what family farmers can achieve on their own, especially the adoption of sophisticated technologies, which are the basis of sustainable farming systems, such as organic farming. Organic farming, which is an agricultural system that attempts to make the best use of local natural resources and excludes external inputs, especially the synthetic ones, might create new opportunities for family farmers to improve their agricultural practices. Adoption of organic practices allows them to produce quality food, and at the same time, reduce their impacts on the environment and health (Correia et al. 2017; Mungai et al. 2016).
Few studies have focused on identifying which factors may contribute to the adoption of organic https://doi.org/10.1515/opag-2018-0041
received February 22, 2018; accepted August 2, 2018
Abstract: This research intended to evaluate to what extent the managers in family farms tend to adopt practices of organic farming and identify the possible factors that might be associated with those choices. For that, a survey was undertaken in Portuguese and Spanish municipalities. The participation, by direct interview, was voluntary and 125 valid responses were obtained distributed as: 30 in Viseu (PT), 30 in Braga (PT), 30 in Barcelos (PT), 16 in Pontevedra (SP) and 19 in Padrón (SP). For the treatment of the data, basic descriptive statistics tools were used in combination with crosstabs and chi square tests. Also tree classifications were conducted following the Classification and Regression Trees algorithm. In all tests a level of significance of 5% was considered. The results identified factors that influenced the behaviour of the managers in family farms towards an approximation to organic farming practices, which were the level of education and municipality, found as major determinants of the level of compliance with organic farming practices. Also, other factors like age or gender influence, although to a lesser extent, the compliance with organic farming. These results were the same for the chi-square tests or the tree classification analysis, and they thus indicate that improvements could be achieved towards a more expressive adoption of organic farming practices if planned to target the influential factors identified.
Keywords: organic agriculture, cultural practices, classification, family agriculture, soil preparation
Research Article
Raquel P. F. Guiné*, Cristina A. Costa
Compliance of agricultural practices used in family
farms with those recommended in organic farming
*Corresponding author: Raquel P. F. Guiné, Quinta da Alagoa, Estrada de Nelas, ranhados, 3500-606 Viseu, Portugal, E-mail: raquelguine@esav.ipv.pt
Raquel P. F. Guiné, Cristina A. Costa, CI&DETS/ESAV, Instituto Polité-cnico de Viseu, 3500-606 Viseu, Portugal
Raquel P. F. Guiné, Cristina A. Costa, CERNAS, Instituto Politécnico de Viseu, 3500-606 Viseu, Portugal
2.2 Sample and Data Collection
The sample consisted of 125 farm managers, and the farms were selected by convenience according to type, dimension (with a size of up to 2.5 hectares) and place. Furthermore, the farms should use mostly household labour and the farming activity should contribute to the major part of the household income. The farms were distributed in the Centre North of Portugal (Viseu – 30, Braga – 30, Barcelos – 30) and the province of Galicia in Spain (Pontevedra – 16, Padron – 19). The data collection took place between November 2015 and February 2016, and direct interview was used to assess participant’s responses.
2.3 Statistical Analysis
In order to measure the compliance with the practices of organic farming a variable (CPOF) was created accounting for the sum of the practices used. For each question 1.1 to 5.7, a value was attributed according to the type of answer, as indicated:
– Questions related to practices recommended in organic farming were coded as: one if the answer was yes and zero if the answer was no;
– All other questions were coded as: zero if the answer was yes and one in the answer was no.
In this way the scale for the variable CPOF varied from a minimum value of 0 to a maximum value of 22, which could be interpreted as follows: [0–4] farmers not at all compliant with organic farming practices; [5–9] farmers not compliant with organic farming practices; [10–13] farmers moderately compliant with organic farming practices; [14–18] farmers compliant with organic farming practices; [19–22] farmers fully compliant with organic farming practices.
The level of compliance with organic farming was further separated into two variables: compliance
with organic farming regarding soil management and preparation (CPOF-S) (groups II and III) and compliance with organic farming regarding cultural interventions
(CPOF-C) (groups I, IV, V). For variable CPOF-S, the range was from 0 to 9, with the following intervals: [0–1] not at all compliant; [2–3] not compliant; [4–5] moderately compliant; [6–7] compliant; [8–9] fully compliant. For variable CPOF-C, the range was from 0 to 13, with the following intervals: [0–2] not at all compliant; [3–5] not compliant; [6–7] moderately compliant; [8–10] compliant; [11–13] fully compliant.
farming by family farmers or other small holders (Burton et al. 2003; Genius et al. 2006; Serra et al. 2008). Age and access to education, training and information are the most common drivers towards the adoption of organic farming practices.
Nevertheless, family farms already adopt several agricultural practices that are included in the organic technical itineraries, such as crop rotation, choice of local varieties, composting, mulching, use of cultural practices that reduce pests and diseases and increase products’ quality, among others (Muimba-Kankolongo 2018; Mungai et al. 2016). Also, organic farming helps to improve soil and yield, thus providing better profitability to the farmers and reducing the production costs with chemical products. Furthermore, organic crops tend to adapt to their own to climatic conditions, and hence help farmers deal with climate change. So, to understand which sustainable practices, included in the organic technical itinerary that have already adopted by family farms and which farmers’ characteristics are facilitating the decision-making process, the essential design of supporting actions, programs and policies that are intend to promote the adoption of sustainable farming practices by family farms must be studied.
The aim of the present work was to evaluate to what extent the family farms tend to, or not to, adopt practices that are recommended for organic farming as well identifying the possible factors that might be associated with those choices.
2 Materials and Methods
2.1 Instrument
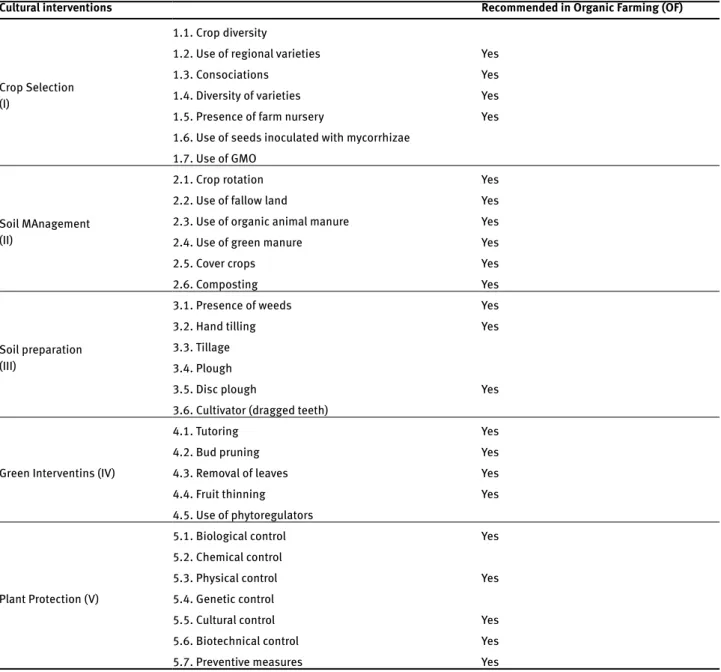
This study was based on the application of a survey instrument in the form of checklist prepared for small farmers who fit into the concept of family farming, and which was formulated to identify the procedures adopted in such farms. The checklist was based on the technical itinerary adopted on organic farms, complemented with information present in literature (Amaro 2007; Strohbehn 2015). The questions, which were related to the agricultural practices, were structured in five parts: I) Crop selection, II) Soil management, III) Soil preparation, IV) Green interventions, V) Plant protection. Table 1 shows the variables included in the checklist.
The checklist was meant to apply in municipalities in Portugal and Spain, and therefore it was written in both languages.
Also, the variables were subjected to a tree classification analysis for evaluation of the relative importance of each of the possible influential variables: gender, age group, level of education and municipality. The analysis followed the CRT (Classification and Regression Trees) algorithm with cross validation and the minimum number of cases considered for parent or child nodes was 8 and 4, respectively.
For all data analysis, the software SPSS from IBM Inc. (version 25) was used and the level of significance considered was 5%.
Ethical approval: The conducted research is not related to either human or animal use.
All the procedure described so far was the authors’ own work, created specifically for this study and in view of the developed instrument, not being for that reason yet cited in literature.
In the data analysis, basic descriptive statistics were used for an exploratory evaluation of the data. Furthermore, to investigate the associations between the variables defined and the sociodemographic variables, crosstabs and chi square tests were used. The Cramer’s V coefficient was used to evaluate the strength of the relations, and varies from 0 to 1 so that for V ≈ 0.1 the association is considered weak, for V ≈ 0.3 the association is moderate and for V ≈ 0.5 or higher the association is strong (Witten and Witte 2009).
Table 1: Variables included in the checklist
Cultural interventions Recommended in Organic Farming (OF)
Crop Selection (I)
1.1. Crop diversity
1.2. Use of regional varieties Yes
1.3. Consociations Yes
1.4. Diversity of varieties Yes
1.5. Presence of farm nursery Yes
1.6. Use of seeds inoculated with mycorrhizae 1.7. Use of GMO
Soil MAnagement (II)
2.1. Crop rotation Yes
2.2. Use of fallow land Yes
2.3. Use of organic animal manure Yes
2.4. Use of green manure Yes
2.5. Cover crops Yes
2.6. Composting Yes
Soil preparation (III)
3.1. Presence of weeds Yes
3.2. Hand tilling Yes
3.3. Tillage 3.4. Plough
3.5. Disc plough Yes
3.6. Cultivator (dragged teeth)
Green Interventins (IV)
4.1. Tutoring Yes
4.2. Bud pruning Yes
4.3. Removal of leaves Yes
4.4. Fruit thinning Yes
4.5. Use of phytoregulators
Plant Protection (V)
5.1. Biological control Yes
5.2. Chemical control
5.3. Physical control Yes
5.4. Genetic control
5.5. Cultural control Yes
5.6. Biotechnical control Yes
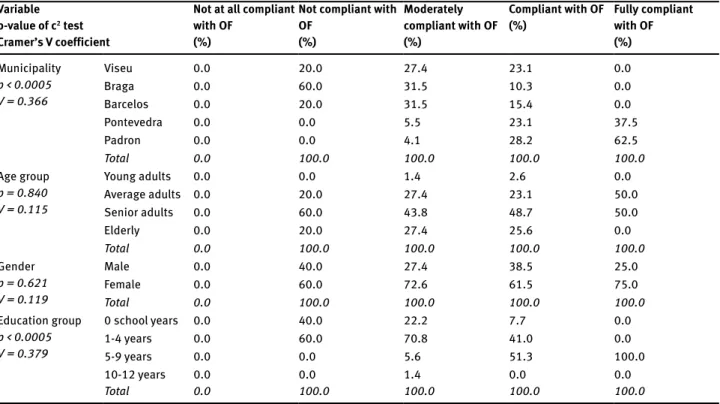
variables are presented in Table 2. The results indicated that municipality (where the farms stand) and education level significantly influenced the compliance with OF practices regarding the soil operations (p-value less than 0.0005 in both cases), with moderate associations according to the values of Cramer’s V coefficients (0.366 and 0.379, respectively). As for municipality, the farmers that do not comply with organic farming practices were from Braga (60.0%), while those in Padron and Pontevedra show the highest compliance with OF soil operations. Regarding education, farmers with up to 4 years of school showed the lowest compliance with organic farming (not compliant with organic farming). As for age or gender, no significant associations were found (p-value > 0.05), and the Cramer’s V values were within the limits of weak associations.
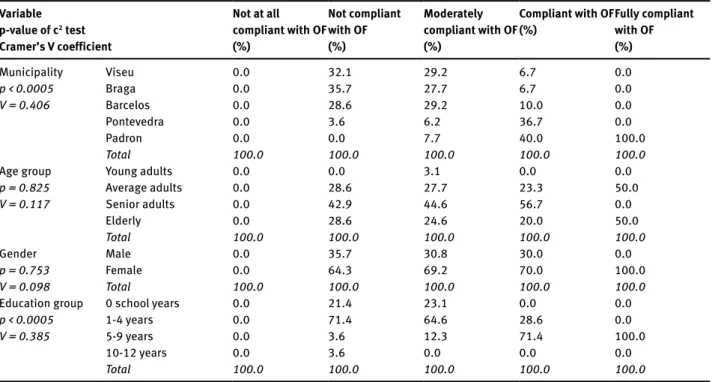
Table 3 shows the associations between the variable ‘compliance with organic farming regarding cultural
interventions’ (CPOF-C) and the socio-demographic
variables. The results indicated again that municipality and education level significantly influenced the compliance with organic farming practices regarding the cultural interventions (p-value < 0.0005 in both cases), with moderate associations (Cramer’s V of 0.379 and 0.343, respectively). All interviewed farmers from Portugal (Viseu, Braga and Bercelos) do not comply or moderately comply with organic farming practices while those in Padron and Pontevedra show some compliance
3 Results and Discussion
3.1 Socio-demographic characteristics
This study included 125 participants, of which the majority were men (68.8%). The participants were distributed by four age groups as: 1.6% of young adults (18-30 years), 27.2% of average adults (31-50 years), 46.4% of senior adults (51-65 years) and 24.8% of elderly (age ≥ 66 years).
The level of education was in general low, with an important part of the respondents having no education at all (17.1%), or between 1 and 4 years of school (56.9%), against a smaller group (25.2%) who had between 5 and 9 years of school, and a minority (0.8%) that had between 10 and 12 years of school.
The distribution of farmers was 72.0% for Portugal and 28.0% for Spain, distributed by municipality as: 24% for Viseu, Braga and Barcelos, 12.8% for Pontevedra and 15.2% for Padrón.
3.2 Associations between compliance with
organic farming and socio-demographic
variables
The associations between the variable ‘compliance
with organic farming regarding soil management and preparation’ (CPOF-S) and the socio-demographic
Table 2: Associations between the variable compliance with OF regarding soil management and preparation (CPOF-S) and the socio-demo-graphic variables
Variable p-value of c2 test
Cramer’s V coefficient
Not at all compliant with OF
(%)
Not compliant with OF (%) Moderately compliant with OF (%) Compliant with OF
(%) Fully compliant with OF (%) Municipality p < 0.0005 V = 0.366 Viseu 0.0 20.0 27.4 23.1 0.0 Braga 0.0 60.0 31.5 10.3 0.0 Barcelos 0.0 20.0 31.5 15.4 0.0 Pontevedra 0.0 0.0 5.5 23.1 37.5 Padron 0.0 0.0 4.1 28.2 62.5 Total 0.0 100.0 100.0 100.0 100.0 Age group p = 0.840 V = 0.115 Young adults 0.0 0.0 1.4 2.6 0.0 Average adults 0.0 20.0 27.4 23.1 50.0 Senior adults 0.0 60.0 43.8 48.7 50.0 Elderly 0.0 20.0 27.4 25.6 0.0 Total 0.0 100.0 100.0 100.0 100.0 Gender p = 0.621 V = 0.119 Male 0.0 40.0 27.4 38.5 25.0 Female 0.0 60.0 72.6 61.5 75.0 Total 0.0 100.0 100.0 100.0 100.0 Education group p < 0.0005 V = 0.379 0 school years 0.0 40.0 22.2 7.7 0.0 1-4 years 0.0 60.0 70.8 41.0 0.0 5-9 years 0.0 0.0 5.6 51.3 100.0 10-12 years 0.0 0.0 1.4 0.0 0.0 Total 0.0 100.0 100.0 100.0 100.0
associated with CPOF-C (p-value > 0.05, and weak values of V).
Table 4 highlights the associations between the variable accounting for the global compliance with
the practices of organic farming (CPOF) and the
socio-demographic variables. The results showed exactly the same trends as observed previously for variables CPOF-S and CPOF-C, i.e., with the variables municipality and or fully compliance with organic farming cultural
interventions, confirming the trend observed for the soil operations. As for education, again the farmers with less than 4 years of school showed the lowest compliance with organic farming (not compliant with OF), while highest education levels were associated with highest levels of compliance with OF practices. Once more the variables age or gender, were not found significantly
Table 3: Associations between the variable compliance with OF regarding cultural interventions (CPOF-C) and the socio-demographic variables Variable p-value of c2 test Cramer’s V coefficient Not at all compliant with OF (%) Not compliant with OF (%) Moderately compliant with OF (%) Compliant with OF
(%) Fully compliant with OF (%) Municipality p < 0.0005 V = 0.379 Viseu 0.0 41.7 18.5 15.6 0.0 Braga 0.0 30.6 27.8 12.5 0.0 Barcelos 0.0 25.0 33.3 9.4 0.0 Pontevedra 0.0 2.8 9.3 31.3 0.0 Padron 0.0 0.0 11.1 31.3 100.0 Total 100.0 100.0 100.0 100.0 100.0 Age group p = 0.548 V = 0.145 Young adults 0.0 0.0 3.7 0.0 0.0 Average adults 0.0 22.2 31.5 21.9 66.7 Senior adults 0.0 52.8 40.7 53.1 0.0 Elderly 0.0 25.0 24.1 25.0 33.3 Total 100.0 100.0 100.0 100.0 100.0 Gender p = 0.639 V = 0.116 Male 0.0 33.3 33.3 28.1 0.0 Female 0.0 66.7 66.7 71.9 100.0 Total 100.0 100.0 100.0 100.0 100.0 Education group p < 0.0005 V = 0.343 0 school years 0.0 13.9 27.8 3.3 0.0 1-4 years 0.0 80.6 53.7 40.0 0.0 5-9 years 0.0 2.8 18.5 56.7 100.0 10-12 years 0.0 2.8 0.0 0.0 0.0 Total 100.0 100.0 100.0 100.0 100.0
Table 4: Associations between the variable compliance with the practices of OF and the socio-demographic variables Variable p-value of c2 test Cramer’s V coefficient Not at all compliant with OF (%) Not compliant with OF (%) Moderately compliant with OF (%) Compliant with OF
(%) Fully compliant with OF (%) Municipality p < 0.0005 V = 0.406 Viseu 0.0 32.1 29.2 6.7 0.0 Braga 0.0 35.7 27.7 6.7 0.0 Barcelos 0.0 28.6 29.2 10.0 0.0 Pontevedra 0.0 3.6 6.2 36.7 0.0 Padron 0.0 0.0 7.7 40.0 100.0 Total 100.0 100.0 100.0 100.0 100.0 Age group p = 0.825 V = 0.117 Young adults 0.0 0.0 3.1 0.0 0.0 Average adults 0.0 28.6 27.7 23.3 50.0 Senior adults 0.0 42.9 44.6 56.7 0.0 Elderly 0.0 28.6 24.6 20.0 50.0 Total 100.0 100.0 100.0 100.0 100.0 Gender p = 0.753 V = 0.098 Male 0.0 35.7 30.8 30.0 0.0 Female 0.0 64.3 69.2 70.0 100.0 Total 100.0 100.0 100.0 100.0 100.0 Education group p < 0.0005 V = 0.385 0 school years 0.0 21.4 23.1 0.0 0.0 1-4 years 0.0 71.4 64.6 28.6 0.0 5-9 years 0.0 3.6 12.3 71.4 100.0 10-12 years 0.0 3.6 0.0 0.0 0.0 Total 100.0 100.0 100.0 100.0 100.0
3.3 Tree classification
The three variables accounting for compliance with
organic farming practices (CPOF-S, CPOF-C and CPOF)
were subjected to a tree classification analysis by CRT algorithm, which searched for all possible variables and values that correspond to the best split, i.e., those that split the data into two parts with maximum homogeneity.
The tree obtained for variable ‘compliance with organic
farming regarding soil management and preparation’
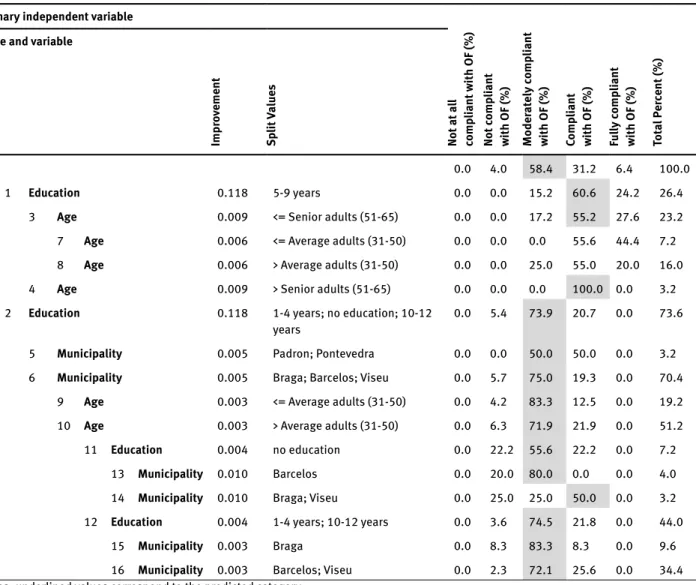
(CPOF-S) had 5 levels, 17 nodes, from which 9 were terminal nodes. The risk estimated with cross-validation was 0.320 with a standard error of 0.042. The best predictor for CPOF-S was education, followed by age for the participants with 5 to 9 years of school and municipality for those with up to 4 or between 10 and 12 years of school (Table 5 and Supplementary Figure S1). Only 6.4% of the participants were in the highest category (fully compliant with organic farming) but 31.2% were compliant with organic farming. education level significantly influencing the compliance
with organic farming practices (CPOF) (p-value < 0.0005; with moderate values of V, 0.406 and 0.385), while the variables age or gender, having no significant association with the variable CPOF. In general, the farmers from the Portuguese municipalities did not comply with organic farming practices while those in Spanish municipalities tended to adopt more practices recommended in organic farming. Also the trend for approximation to the organic farming practices was higher for more educated farmers.
These results reveal that age or gender were not important determinants in conditioning the behaviour of the managers of family farms, and that education plays a major role in increasing consciousness to adopt healthier and more environmental friendly agricultural practices. Also, the influence of the region and country was evidenced, highlighting the role of the governmental and/ or local authorities’ measures to educate and promote OF as a sustainable way of producing agricultural goods.
Table 5: Tree table for variable compliance with OF regarding soil management and preparation (CPOF-S) Primary independent variable
No t a t a ll comp liant w ith OF (%) Not comp liant with OF (%) Moder at ely comp liant with OF (%) Comp liant with OF (%) Fu lly comp liant with OF (%) Tot al P er cent (%)
Node and variable
Impr ov ement Sp lit V alue s 0 0.0 4.0 58.4 31.2 6.4 100.0 1 Education 0.118 5-9 years 0.0 0.0 15.2 60.6 24.2 26.4
3 Age 0.009 <= Senior adults (51-65) 0.0 0.0 17.2 55.2 27.6 23.2 7 Age 0.006 <= Average adults (31-50) 0.0 0.0 0.0 55.6 44.4 7.2 8 Age 0.006 > Average adults (31-50) 0.0 0.0 25.0 55.0 20.0 16.0
4 Age 0.009 > Senior adults (51-65) 0.0 0.0 0.0 100.0 0.0 3.2
2 Education 0.118 1-4 years; no education; 10-12
years 0.0 5.4 73.9 20.7 0.0 73.6
5 Municipality 0.005 Padron; Pontevedra 0.0 0.0 50.0 50.0 0.0 3.2 6 Municipality 0.005 Braga; Barcelos; Viseu 0.0 5.7 75.0 19.3 0.0 70.4
9 Age 0.003 <= Average adults (31-50) 0.0 4.2 83.3 12.5 0.0 19.2 10 Age 0.003 > Average adults (31-50) 0.0 6.3 71.9 21.9 0.0 51.2
11 Education 0.004 no education 0.0 22.2 55.6 22.2 0.0 7.2
13 Municipality 0.010 Barcelos 0.0 20.0 80.0 0.0 0.0 4.0
14 Municipality 0.010 Braga; Viseu 0.0 25.0 25.0 50.0 0.0 3.2 12 Education 0.004 1-4 years; 10-12 years 0.0 3.6 74.5 21.8 0.0 44.0
15 Municipality 0.003 Braga 0.0 8.3 83.3 8.3 0.0 9.6
16 Municipality 0.003 Barcelos; Viseu 0.0 2.3 72.1 25.6 0.0 34.4 Notes: underlined values correspond to the predicted category
Table 6: Tree table for variable compliance with OF regarding cultural interventions (CPOF-C) Primary independent variable
No t a t a ll comp liant w ith OF (%) Not comp liant with OF (%) Moder at ely comp liant with OF (%) Comp liant with OF (%) Fu lly comp liant with OF (%) Tot al P er cent (%)
Node and variable
Impr ov ement Sp lit V alue s 0 0.0 28.8 43.2 25.6 2.4 100.0 1 Municipality 0.072 Padron; Pontevedra 0.0 2.9 31.4 57.1 8.6 28.0 3 Education 0.010 5-9 years 0.0 3.2 25.8 61.3 9.7 24.8 7 Gender 0.008 Female 0.0 4.3 30.4 52.2 13.0 18.4 13 Municipality 0.006 Padron 0.0 0.0 33.3 41.7 25.0 9.6 14 Municipality 0.006 Pontevedra 0.0 9.1 27.3 63.6 0.0 8.8 8 Gender 0.008 Male 0.0 0.0 12.5 87.5 0.0 6.4 4 Education 0.010 1-4 years; no education 0.0 0.0 75.0 25.0 0.0 3.2
2 Municipality 0.072 Braga; Barcelos;
Viseu 0.0 38.9 47.8 13.3 0.0 72.0 5 Education 0.023 5-9 years; no education 0.0 22.7 72.7 4.5 0.0 17.6 9 Gender 0.017 Female 0.0 6.7 86.7 6.7 0.0 12.0 10 Gender 0.017 Male 0.0 57.1 42.9 0.0 0.0 5.6 6 Education 0.023 1-4 years; 10-12 years 0.0 44.1 39.7 16.2 0.0 54.4 11 Municipality 0.022 Barcelos 0.0 28.0 60.0 12.0 0.0 20.0
15 Age 0.007 <= Average adults
(31-50) 0.0 50.0 50.0 0.0 0.0 6.4
16 Age 0.007 > Average adults
(31-50) 0.0 17.6 64.7 17.6 0.0 13.6
19 Gender 0.005 Female 0.0 0.0 60.0 40.0 0.0 4.0
20 Gender 0.005 Male 0.0 25.0 66.7 8.3 0.0 9.6
12 Municipality 0.022 Braga; Viseu 0.0 53.5 27.9 18.6 0.0 34.4
17 Age 0.005 <= Senior adults
(51-65) 0.0 61.5 23.1 15.4 0.0 20.8
21 Municipality 0.022 Braga 0.0 33.3 41.7 25.0 0.0 9.6
22 Municipality 0.022 Viseu 0.0 85.7 7.1 7.1 0.0 11.2
18 Age 0.005 > Senior adults
(51-65) 0.0 41.2 35.3 23.5 0.0 13.6
23 Municipality 0.022 Braga 0.0 100.0 0.0 0.0 0.0 3.2
24 Municipality 0.022 Viseu 0.0 23.1 46.2 30.8 0.0 10.4
Notes: underlined values correspond to the predicted category
indicates that, regarding the soil operations, most of the family farm managers tend to adopt practices of organic farming.
The tree obtained for variable ‘compliance with
organic farming regarding cultural interventions’
(CPOF-C) also had 5 levels, but included more nodes, 25, from For most levels, the majority of the participants stood
in the moderately compliant or compliant categories. There were no incidences in the lowest category (not at all compliant with organic farming) and the percentages in the category not compliant with organic farming were also very low (Table 5 and Supplementary Figure S1). This
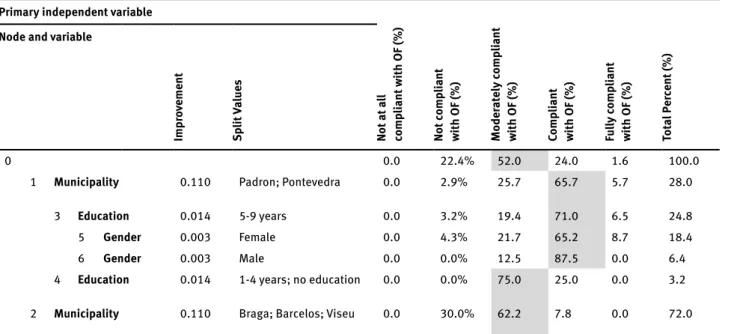
Table 7: Tree table for variable compliance with the practices of OF (CPOF) Primary independent variable
No t a t a ll comp liant w ith OF (%) Not comp liant with OF (%) Moder at ely comp liant with OF (%) Comp liant with OF (%) Fu lly comp liant with OF (%) Tot al P er cent (%)
Node and variable
Impr ov ement Sp lit V alue s 0 0.0 22.4% 52.0 24.0 1.6 100.0
1 Municipality 0.110 Padron; Pontevedra 0.0 2.9% 25.7 65.7 5.7 28.0
3 Education 0.014 5-9 years 0.0 3.2% 19.4 71.0 6.5 24.8
5 Gender 0.003 Female 0.0 4.3% 21.7 65.2 8.7 18.4
6 Gender 0.003 Male 0.0 0.0% 12.5 87.5 0.0 6.4
4 Education 0.014 1-4 years; no education 0.0 0.0% 75.0 25.0 0.0 3.2 2 Municipality 0.110 Braga; Barcelos; Viseu 0.0 30.0% 62.2 7.8 0.0 72.0 Notes: underlined values correspond to the predicted category
practices moderately compliant with organic farming, although that percentage increased for those from Spanish municipalities, and particularly for those with higher levels of education (5-9 years), regardless of gender.
The results of the tree classification confirmed the associations between the variables at study and the socio-demographic variables, i.e., that municipality and level of education (5-9 years) were major factors determining the adopted practices of the managers of family farms. This is important to plan interventions aimed at promoting changes in behaviour and encouraging the adoption of organic agricultural practices, despite being not recognized by means of certification.
4 Discussion
These findings, using two different statistical methods, indicate that at least a part of the Portuguese and Spanish farmers are able to shift from a traditional production system to organic farming, through the adoption of more sustainable farming practices, and identified some factors that might be used to influence this change towards innovation.
Both methods (exploratory and tree classification analysis) showed that education is a socio-demographic variable determinant in the process of changing the farmers’ options in general, but also in relation to practices related to soil operations and cultural interventions, such as crop rotation, green interventions or crop protection practices.
which 13 were terminal nodes. The risk estimated with cross-validation was 0.488 with a standard error of 0.045. Table 6 and Supplementary Figure S2 reveal that the best predictor for CPOF-C was municipality, followed by education, regardless of the group in level 1. The results indicated that only 2.4% of the participants were in the highest category (fully compliant with organic farming) but 25.6% were compliant and 43.2% were moderately compliant with organic farming. For some levels, the majority of the participants stood in the moderately compliant or compliant categories, although there were many exceptions, like in nodes 6, 10, 12, 15, 17, 18, 22 and 23, in which the majority was in the not compliant category, indicating that farmers with 4 years or 10-12 years of education, with 51-60 years old in the municipalities of Braga and Viseu have more tendency to be not compliant with organic farming. Still, there were no incidences in the lowest category (not at all compliant with organic farming). This leads to the conclusion that in cultural interventions, the family farmers are not so close to organic farming practices as with the soil operations.
The tree obtained for variable compliance with the
practices of organic farming (CPOF) had only 3 levels, 7
nodes, from which 4 were terminal. The risk estimated with cross-validation was 0.432 with a standard error of 0.044. Table 7 and Supplementary Figure S3 show that the best predictor for CPOF was municipality, followed by education for the participants from Spain (Padron, Pontevedra). Most of the farmers, 52.0%, showed overall
5 Conclusions
The present work identified the factors that influenced the behaviour of the managers in family farms towards adoption of organic farming practices. It was observed through the chi-square tests that the level of education and municipality, and consequently country, had a major role in determining the level of compliance with organic farming practices, either in general or regarding soil preparation operations or cultural interventions. Furthermore, the results of the tree classification confirmed the observed trends, thus indicating that improvements could be achieved if incentives for adoption of healthier and more environmental friendly practices could be planned according to those factors that were identified in this work.
Innovation presupposes a capacity to innovate, initially, at the individual level. The skills and capacities of famers must be upgraded through education and training at all levels, in order to allow innovating in family farming. Better education and knowledge, especially regarding sustainable production practices, are identified as necessary components to support family farms in adapting to a world that is globalizing and becoming more competitive.
Moreover, if policy makers wish to encourage organic farming adoption among family farmers, then policy measures should address the improvement of farmer education, and also the development of farming information channels and networks (including extension services).
Acknowledgments: Thanks to Polytechnic Institute of Viseu and CI&DETS, financed by Foundation for Science and Technology (FCT), under project UID/ Multi/04016/2016.
Thanks to the Project PROJ/CI&DETS/CGD/0006: “Pontes entre Agricultura Familiar e Agricultura Biológica”, financed through the partnership between the Polytechnic Institute of Viseu and Caixa Geral de Depósitos.
Thanks to the Centro de Estudos Ibérico, through the attribution of the Award CEI IIT -Investigação, Inovação e Território, in 2017.
Conflict of interest: Authors declare no conflict of interest.
Younger and highly educated farmers tend to acquire and assimilate information straightforwardly, facilitating the adoption of new and more sustainable practices, as those inherent to organic farming systems (Fertö and Forgács 2010; Genius et al. 2006; Soule 2001). Soule (2001) found that higher educated farmers expect to cope with difficulties in more sophisticated agricultural practices, such as soil and nutrient management in organic farming, better than less educated farmers.
This trend was similar for the three groups of variables: soil operations, cultural interventions and practices of organic farming, reinforcing the importance of the level of education in the definition of programs that intend to promote the conversion to organic farming of these small family farms.
Municipality, but especially country, also differentiated farmers concerning the adoption of organic farming practices. Spanish farmers, who were generally more educated and professionally trained (European Union 2013), showed more keenness in embracing practices that will easily lead them to organic producing, when compared to the Portuguese farmers.
The tree classification suggested that age also has some importance in the compliance with organic farming regarding soil management and preparation, especially among farmers that have longer periods of education. Fertö and Forgács (2010) suggested that the willingness to change to organic farming might be related with a more conservative position of the older farmers that are therefore more resistant to organic farming, than younger ones.
The set of soil operations adopted by this sample of family farms is closer to organic farming, when compared to cultural interventions, probably because there is a wider perception that intensive tillage is costly and a major cause of land degradation. Wang et al. (2016) indicate that Chinese small farmers showed a tendency to adopt sustainable soil management practices because they feel that it is the right thing to do to protect the natural environment and guaranteeing long-term agricultural production of future generations.
Finally, in the present study, gender was not an important determinant for the adoption of the considered soil and cultural practices, although these show some influence when associated with other variables like, municipalities and education. Gender does not show a constant trend among studies, as, for example, Burton et al. (2003) found a significant influence of gender on the adoption of organic farming practices in the United Kingdom.
Mungai L.M., Snapp S., Messina J.P., Chikowo R., Smith A., Anders E., et al., Smallholder Farms and the Potential for Sustainable Intensification, Front. Plant. Sci., 2016, 7, https://www. frontiersin.org/articles/10.3389/fpls.2016.01720/full Ngowi A.V.F., Mbise T.J., Ijani A.S.M., London L., Ajayi O.C.,
Pesticides use by smallholder farmers in vegetable production in Northern Tanzania, Crop. Prot., 2007, 26, 1617–1624 Serra T., Zilberman D., Gil J.M., Differential uncertainties and risk
attitudes between conventional and organic producers: the case of Spanish arable crop farmers, Agric. Econ., 2008, 39, 219–229
Soule M.J., Soil Management and the Farm Typology: Do Small Family Farms Manage Soil and Nutrient Resources Differently than Large Family Farms?, Agric. Resour. Econ. Rev., 2001, 30, 179–188
Strohbehn C., Mississippi Farm Food Safety Checklist - Adapted from the “Checklist for Retail Purchasing of Local Produce, Iowa State University, Ames, Iowa, United States, 2015
Suess-Reyes J., Fuetsch E., The future of family farming: A literature review on innovative, sustainable and succession-oriented strategies, J. Rural Stud., 2016, 47, 117–140
Wang N., Gao Y., Wang Y., Li X., Adoption of eco-friendly soil-management practices by smallholder farmers in Shandong Province of China, Soil Sci. Plant Nutr., 2016, 62, 185–193
Whitford F., Storm J., Mysz A., Alexander B., Acquavella J., Buhler W., et al., Farm Family Exposure to Pesticides, Purdue University, 2006
Witte R.S, Witte J.S., Statistics, 9th ed., Wiley, New Jersey, 2009
Supplemental Material: The online version of this article (DOI: 10.1515/opag-2018-0040) offers supplementary material.
References
Amaro P., 7o Relatório de Progresso “Os indicadores ambientais
para avaliar a prática da protecção integrada, da produção integrada e da agricultura biológica e o uso sustentável de pesticidas em Portugal” (AGRO 545), Instituto Superior de Agronomia, Lisboa, Portugal, 2007, (in Portuguese) Burton M., Rigby D., Young T., Modelling the adoption of organic
horticultural technology in the UK using Duration Analysis, Aust. J. Agric. Resour. Econ., 2003, 47, 29–54
Correia H., Gaião D., Correia P., Guiné R., Teixeira D., Costa C., ECONEWFARMERS: Construir pontes entre agricultura familiar e biológica através da formação vocacional, Rev. Ciên. Agrár., 2017, 40, 125–131
European Union, Rural development in the EU, Statistical and economic information report, European Commission/ Directorate-General for Agriculture and Rural Development, Brussels, 2013
FAO, The State of Food and Agriculture, Innovation in family farming, Food and Agriculture Organization of the United Nations, Rome, 2014
Fertö I., Forgács C., Is organic farming a chance for family farms to survive? Presented at the IAMO Forum 2010, 16–18 June, Halle, Germany, 2010
Genius M., Pantzios C.J., Tzouvelekas V., Information Acquisition and Adoption of Organic Farming Practices, J. Agric. Resource. Econ., 2006, 31, 93-113
Lowder S.K., Skoet J., Raney T., The Number, Size, and Distribution of Farms, Smallholder Farms, and Family Farms Worldwide, World Dev., 2016, 87, 16-29
Muimba-Kankolongo A., Food Crop Production by Smallholder Farmers in Southern Africa: Challenges and Opportunities for Improvement, Academic Press, 2018