Economic Evaluation of Generation and Storage
Solutions in Low Voltage End User Installations
Rúben A. Soares
INESC TEC Campus da FEUP, Rua Dr. Roberto Frias, 378 4200 – 465 Porto, Portugal [email protected]João Tomé Saraiva
INESC TEC and FEUP/DEEC
Fac. Engenharia da Univ. do Porto
Rua Dr. Roberto Frias, 378 4200 – 465 Porto, Portugal
[email protected] Abstract— Storage technologies are expected to assume an
increasing relevance in the next few years, given the widespread number of available options, the possible applications and the reduction of investment costs. Therefore and apart from the well-known hydro pumping stations, the installation of storage is being considered as an increasingly viable option namely in distribution networks and also in end user installations. This paper reviews the recently passed Portuguese legislation on self-consumption and details a model to evaluate the economic interest of installing batteries together with PV panels according to several possible business models. The simulations suggest that the tariffs currently applied and the investment costs turn these options still not attractive so that a final simulation was developed to evaluate the break even value of the tariffs to turn the investments on storage paid in a reasonable horizon. Index Terms—Self-Consumption, PV, Storage, Lithium-ion Battery, Economic feasibility, NPV.
I. INTRODUCTION A. Energy Storage Evolution
According to the number 1 of article 16 of the Directive 2009/28/EC of the European Parliament and the Council of April 23, 2009, on the Promotion of the Use of Energy from Renewable Sources, the “Member States shall take the appropriate steps to develop transmission and distribution grid infrastructure, intelligent networks, storage facilities and the electricity system, in order to allow the secure operation of the electricity system as it accommodates the further development of electricity production from renewable energy sources …” [1]. Despite having been passed in 2009, it was only in recent years that we have been witnessing an increasing interest on issues more directly related to energy storage regarding both technical issues and legal and regulatory aspects. This growing interest is clear from generation and distribution companies, system operators, retailers, manufacturers, researchers and state agencies. This Directive and the developments that have occurring in power systems in recent years suggest that in the near future power systems will evolve to more decentralized approaches and to
the increase of the local energy autonomy together with a larger emphasis on demand side management tools.
In recent years Portugal has been involved in several initiatives together with other European countries in order to promote energy sustainability. The technological evolution that has been witnessed regarding energy storage systems and microgeneration systems has been reducing the price of these equipments so that their deployment in several countries has been increasing namely where self-consumption is allowed from a legal point of view (e.g., Germany, Spain, Italy). In Portugal, legislation allowing self-consumption has been recently passed so that it becomes increasingly important to evaluate both from a technical and an economic point of view the feasibility of increasing the number of storage devices namely in end user installations. According to these ideas, this paper describes a study that was conducted in cooperation with a Portuguese utility in order to evaluate from an economic point of view the interest of installing PV systems together with storage equipments in low voltage (LV) end user installations. Therefore we analyzed several scenarios related with different business models related with the installation of PV panels, of PV panels together with storage and the possible use of storage equipment for price arbitrage purposes. In general, we concluded that the current applicable LV tariffs are not enough to justify the installation of storage equipments. Therefore, a final simulation was done to evaluate the break even tariff that should be in force so that the investment in these equipments could be justified.
Apart from this initial Introduction, this paper is structured as follows. The next paragraphs detail the recently passed Portuguese legislation in self-consumption and Section II briefly describes the energy storage solutions currently available as well as their typical application fields. Section III describes the methodology that was adopted to conduct the economic evaluation mentioned above and Section IV describes the obtained results. Finally, Section V outlines the main conclusions.
B. Portuguese Self-consumption Legislation
The rules regarding self-consumption in Portugal were passed in the October 20, 2014, according to the Decree no. 153/2014. The most relevant of them are listed below [2]:
The energy generated in the installation where the Unit for Self-Consumption Generation, USCG, is located can be consumed locally and eventual excessive energy regarding local demand can be injected in the distribution network (article 7);
The USCG shall be designed so that the generated energy is close to the local demand (article 8);
The instantaneous excessive generated energy can be injected in the distribution network and shall be paid at the wholesale market price considering a reduction of 10% in order to compensate the costs due to the injection of energy in LV networks (article 24); The knowledge of these basic rules is important in order to understand several assumptions taken in the simulations to be detailed in Sections III and IV.
II. STORAGE SOLUTIONS
The most relevant objective to achieve when installing storage equipments in power systems is to turn its operation and management more flexible, storing energy when the demand is more reduced or there is excess of generation for instance from sources having volatile nature so that it can be used in larger demand periods or to supply ancillary services. Pumping hydro is the most traditional storage technology and still the one that has the largest capacity share. However, there is currently a wide range of storage technologies that convert electricity in other types of energy (e.g., mechanic, chemical, electrochemical, and thermal), that is then converted back to electricity. In the next few years it is expected that emerging storage technologies get sufficiently mature to enable their widespread deployment and also that new technologies are developed and brought to the market.
Storage devices have a wide range of applications namely for price arbitrage, to provide reserve services, to enable the larger the integration of units that use volatile primary resources (as wind and PV units), to defer investments in distribution networks and to help managing these networks namely reducing losses and improving the voltage profile [3]. However, storage technologies have very different characteristics (in terms of unit investment and operation costs, response time, discharge rate, number of cycles, …) so that it is important to clearly identify the advantages and disadvantages of each technology having in mind its possible application area and objectives to achieve. Therefore, storage technologies can be grouped in three main areas as follows:
- Large scale storage (LS), devices directly connected to the transmission system;
- Small scale storage (SS), devices directly connected to the distribution system or end user installations; - Large and small scale storage (LSS), equipments
that can be connected both to the transmission or distribution networks and to end user installations.
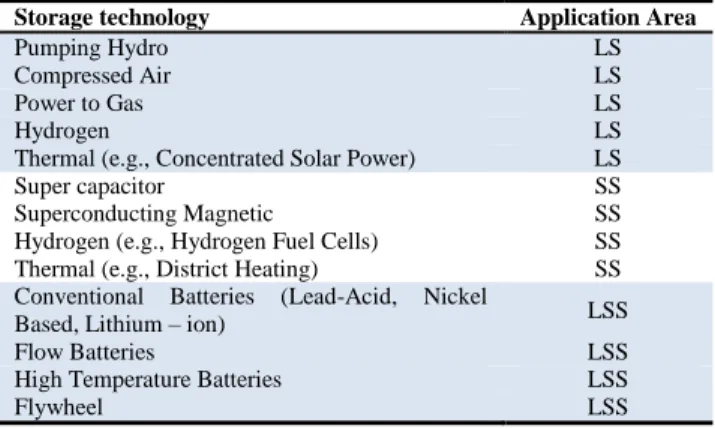
Table I lists the most common storage technologies currently available indicating for each of them its most typical application area (LS, SS or LSS) as defined above.
TABLE I. Energy storage technologies and correspondent application area Storage technology Application Area
Pumping Hydro LS
Compressed Air LS
Power to Gas LS
Hydrogen LS
Thermal (e.g., Concentrated Solar Power) LS
Super capacitor SS
Superconducting Magnetic SS
Hydrogen (e.g., Hydrogen Fuel Cells) SS Thermal (e.g., District Heating) SS Conventional Batteries (Lead-Acid, Nickel
Based, Lithium – ion) LSS
Flow Batteries LSS
High Temperature Batteries LSS
Flywheel LSS
III. DEVELOPED METHODOLOGIE A. General Aspects
The simulations performed in this analysis used the demand and PV microgeneration profiles for 2014 available in the web site of the Portuguese Energy Regulatory Agency, ERSE [4, 5] and discretized on a 15 min basis. For the demand, we used a profile for consumers made available by the Portuguese Regulatory Agency having for 6.9 kVA of contracted power and an annual demand of 5000 kWh. This profile is termed as Class C. This is very representative in mainland Portugal thus leading to more meaningful conclusions. We also admitted that these clients have a supply contract with the Regulated Retailer via a one of the four available time of use tariffs (with two or three time steps and with a daily or a weekly cycle). We also considered that these tariffs will be updated along the period under analysis at 1.5% above the expected inflation rate, so that a total increase of 2.5%/ year was used in the simulations.
Since we are interested in small scale storage, we used Lithium-ion batteries for their maturity and performance. Table II presents the main technical characteristics of the batteries used in this study. We also admitted that going from complete discharge till a full charge state takes 3 hours. The price of the equipments used in the simulations is as follows. For the Lithium-ion batteries we used 200 €/kWh given this is the expected price for 2020 [6]. For the PV panels the cost of 1640 €/kWp was used, including installation and associated electronic control equipments costs.
TABLE II. Characteristics of the used Lithium-ion batteries. Lithium-ion battery
Storage capacity (𝐸𝑠𝑡𝑜𝑟𝑎𝑔𝑒𝑚𝑎𝑥 ) 1-10 kWh Maximum charge/discharge rate 𝐸𝑠𝑡𝑜𝑟𝑎𝑔𝑒𝑚𝑎𝑥 /3ℎ Depth of Discharge (DOD) 50% Total system efficiency 90% Storage self-discharge 0.1%/day
The economic evaluation of the feasibility of investing in storage equipments and / or PV panels was assessed using the Net Present Value, NPV, given by (1).
𝑁𝑃𝑉 = ∑ 𝐶𝐹𝑖 (1 + 𝑇𝑎)𝑖 𝑛
𝑖=0
(1) In this expression, 𝐶𝐹𝑖 is the Cash-Flow for year i and 𝑇𝑎
is the discount rate. In the simulations we used 8% for the discount rate and the evaluation horizon was set as the smaller of the life times of the equipments in each simulation. Therefore, the horizon was set at 20 years when just considering PV panels. If the investment includes Lithium-ion batteries the horizon is reduced to 12 years.
Having in mind these ideas, for each 15 min time step of the horizon we get the value of the PV generation and of the demand from the profiles mentioned before. Then, if no storage exists, the amount of PV generation is compared with the local LV demand and the eventual excess is injected in the grid. If local generation is insufficient, then the grid supplies the difference. If storage is considered, we also have to take into account the charging level of the battery, the hour of the day and the assumptions assumed in each simulation to decide whether to store electricity, or to supply the demand or to use the stored electricity to sell back to the grid. Once the simulation horizon is completed, the yearly energy values bought from the grid and sold to the grid are obtained to estimate the cash flows for each year. This amount is then compared with the value of the energy bought from the grid if no PV and storage exist (Base Case). These cash flow yearly differences are the used to calculate the associated NPV. B. Cases Study
Using the NPV concept and the data indicated above, we built a number of scenarios that are described below. These scenarios reflect the base situation (Case A), the legislation that was recently passed (Case B) and different business models regarding the installation of storage and / or PV panels in LV that we can expect to happen in the future. The mentioned scenarios are as follows:
Case A – it considers the installation of PV panels in order to supply the LV demand. In this case we are not considering the possibility of selling the instantaneous generation excess to the network;
Case B – it considers the installation of PV panels to supply the LV demand together with the possibility of selling the instantaneous excess generation to the grid, according to the legislation in Section I.B. This energy is paid at the whole sale market price reduced by 10%. We used the average price of the MIBEL for 2012 of 48.07 €/MWh reduced by 10%, as indicated above;
Case C – in this case both PV panels and batteries are installed. PVs are used to supply the local demand and the excess generation is stored in the battery system to be used later on when local generation is more reduced than local demand. Therefore, the combination of these two equipments is directed to the reduction of the energy dependency from the grid;
Case D – this case just considers the installation of a storage system to buy and store energy in off peak
hours beyond the local demand. The stored energy is used for self-consumption in peak hours. In these periods, if the stored energy is insufficient to supply the demand, the rest is bought from the grid;
Case E – in this case, and differently from Case D,, the battery is used for price arbitrage purposes, that is, it is bought energy from the network to charge the battery at off peak hours and this energy is sold back to the network in peak periods. The sold energy is paid according to the time of use tariffs contracted by the end user (either time of use with two steps of with three steps). As it will be detailed in Section IV, we concluded that the tariff used to pay the energy sold to the network is too low to turn this investment profitable. Therefore, we ran some extra simulations to determine the selling tariff that would have to be in place to estimate the break-even of the investment.
IV. RESULTS OF THE SIMULATIONS A. CASE A
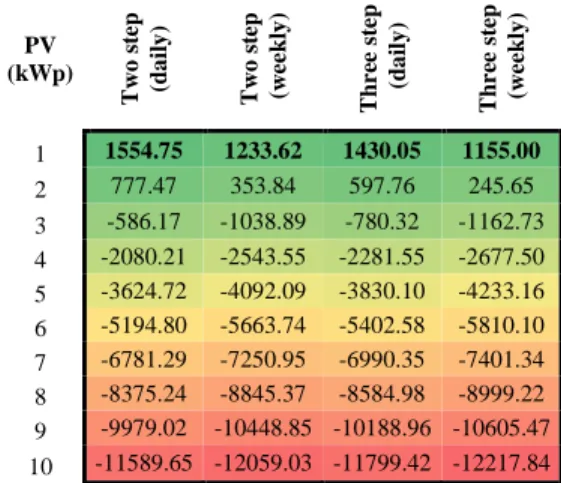
In this simulation we considered different capacities for the PV panels to install. Table III includes the values obtained for the NPV for each time of use tariff and for capacities of the PV panels from 1 to 10 kWp.
TABLE III. Case A - NPV for different PV capacities and tariffs. PV (kWp) T w o st ep (d a il y ) T w o st ep ( w ee k ly ) T h re e st ep ( d a il y ) T h re e st ep ( w ee k ly ) 1 1554.75 1233.62 1430.05 1155.00 2 777.47 353.84 597.76 245.65 3 -586.17 -1038.89 -780.32 -1162.73 4 -2080.21 -2543.55 -2281.55 -2677.50 5 -3624.72 -4092.09 -3830.10 -4233.16 6 -5194.80 -5663.74 -5402.58 -5810.10 7 -6781.29 -7250.95 -6990.35 -7401.34 8 -8375.24 -8845.37 -8584.98 -8999.22 9 -9979.02 -10448.85 -10188.96 -10605.47 10 -11589.65 -12059.03 -11799.42 -12217.84
According to these results, for an end user with a yearly demand of 5000 kWh the best option is to install PV panels with a capacity of 1 kWp, regardless of the tariff option. The largest NPV value is obtained for a time of use tariffs with two steps (dual tariff) with a daily cycle (NPV = 1554.75 €). B. CASE B
In Case B we considered PV panels with a maximum capacity of 2.5 kWp. This value was set given that the legislation in Section I.B states that the USGC shall be designed so that the generated energy is close to the local demand. Admitting that the PV panels generate for 1700 hours/year, we then obtain a local generation of 4250 kWh, below the 5000 kWh of yearly local demand. Let us remind that in this case the panels supply the local demand and sell the instantaneous excess generation to the grid. Table IV presents the values obtained for the NPV for Case B.
TABLE IV. Case B - NPV for different PV capacities and tariffs. PV (kWp) T w o st ep ( d a il y ) T w o st ep ( w ee k ly ) T h re e st ep ( d a il y ) T h re e st ep ( w ee k ly ) 0.5 963.43 789.92 897.43 743.01 1 1629.75 1308.62 1505.05 1230.00 1.5 1615.63 1227.24 1454.88 1132.21 2 1397.47 973.84 1217.76 865.65 2.5 1069.72 627.27 881.27 510.16
As for Case A, the most interesting combination of panel capacity and tariff option corresponds to 1 kWp panel and dual time of use tariff with daily cycle. The difference between the NPV values obtained for Cases A and B (about 75 € larger in Case B) is due to extra revenue obtained in Case B given that the instantaneous excess generated energy is sold to the network. It is also important to realize that, for the same capacity of the PV panels, in both cases the energy bought from the network to supply the demand is the same. Therefore the cost of buying this energy from the retailer is also equal in both cases.
C. CASE C
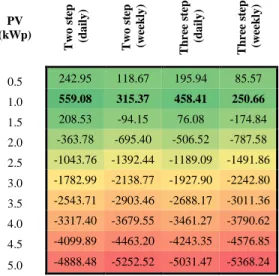
Case C considers the installation of both PV panels and batteries. The economic valuation of the investment was assessed considering different capacities for both systems. Table V presents the results that were obtained considering a Lithium-ion battery with a capacity of 1 kWh for PV panels with a capacity ranging from 0.5 to 5.0 kWp. For storage systems of capacity larger than 1 kWh the associated investment cost override the benefits from its operation and so the NPV values are below the ones in Table V.
TABLE V. Case C - NPV for different PV capacities and tariffs with 1 kWh Lithium-ion battery installed.
PV (kWp) T w o st ep ( d a il y ) T w o st ep ( w ee k ly ) T h re e st ep ( d a il y ) T h re e st ep ( w ee k ly ) 0.5 242.95 118.67 195.94 85.57 1.0 559.08 315.37 458.41 250.66 1.5 208.53 -94.15 76.08 -174.84 2.0 -363.78 -695.40 -506.52 -787.58 2.5 -1043.76 -1392.44 -1189.09 -1491.86 3.0 -1782.99 -2138.77 -1927.90 -2242.80 3.5 -2543.71 -2903.46 -2688.17 -3011.36 4.0 -3317.40 -3679.55 -3461.27 -3790.62 4.5 -4099.89 -4463.20 -4243.35 -4576.85 5.0 -4888.48 -5252.52 -5031.47 -5368.24 According to the results in Table V the best option corresponds to install PV panels with a capacity of 1 kWp together with a battery of 1 kWh. Regarding the tariff
options, the most interesting one is once again the time of use dual tariff with daily cycle (NPV = 559.08 €).
Still regarding Case C, we performed a sensitivity analysis in order to estimate how the NPV would change for different demand levels. In the simulations and apart the 5000 kWh demand level associated with the results in Table V for Class C consumers, we also simulated 3500 kWh and 7500 kWh of yearly demand (Class B in this case) for a battery of 1 kWh of capacity and for different capacities of the PV panels. In all these simulations we used the time of use dual tariffs with daily cycle since these tariffs are consistently the most interesting ones along the simulations done so far. According to these ideas, Figure 1 presents the evolution of the NPV for the analyzed situations.
Figure 1. Case C - NPV variation for different demand levels and PV capacities with 1 kWh Lithium-ion battery.
These graphs indicate that the investment gets more interesting as the demand rises. Assuming that the battery has a capacity of 1 kWh, the most adequate capacity of the PV panel depends on the demand level. In fact, for a demand level of 3500 kWh the best PV alternative has a capacity of just 0.5 kWp (NPV = 241.50 €) because for a small demand level the investment cost rapidly offsets the operation benefits of the equipment. For a 5000 kWh demand level the most adequate PV capacity is 1 kWp as indicated in Table V and for the larger demand level of 7500 kWh/year (in fact associated with an end consumer of class B), the best solution would be the combined installations of a battery of 1 kWh together with PV panels with 1.5 kWp of capacity. In this case, the NPV is 1075.90 €.
Although the energy dependency from the network gets reduced when installing storage systems, the benefit is in general small to offset the still large investment cost. For instance, when installing a PV panel with 1 kWp and a Lithium-ion battery of 1 kWh the self-consumption is just increased by 1.28% regarding the installation of only the PV panel. This small increase is due to the fact that most of the generated energy is immediately used to supply the local demand. In these cases, the installation of batteries would just improve self-consumption in a marginal way.
D. CASE D
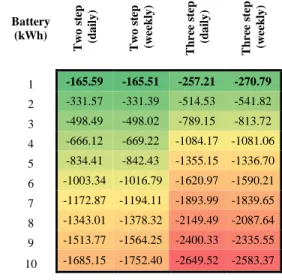
In this case the NPV was estimated for the capacities of the batteries indicated in Table VI. The NPV values in this table are all negative indicating that the business model
associated with this Case is entirely unfeasible considering the battery price of 200 €/kWh and the current tariff levels.
TABLE VI. Case D - NPV for different battery capacities and tariff options.
Battery (kWh) T w o st ep ( d a il y ) T w o st ep ( w ee k ly ) T h re e st ep ( d a il y ) T h re e st ep ( w ee k ly ) 1 -165.59 -165.51 -257.21 -270.79 2 -331.57 -331.39 -514.53 -541.82 3 -498.49 -498.02 -789.15 -813.72 4 -666.12 -669.22 -1084.17 -1081.06 5 -834.41 -842.43 -1355.15 -1336.70 6 -1003.34 -1016.79 -1620.97 -1590.21 7 -1172.87 -1194.11 -1893.99 -1839.65 8 -1343.01 -1378.32 -2149.49 -2087.64 9 -1513.77 -1564.25 -2400.33 -2335.55 10 -1685.15 -1752.40 -2649.52 -2583.37 E. CASE E
Case E models the use of the batteries for arbitrage purposes taking advantage of the price differential between peak and off peak hours. The initial simulations that were conducted using the current tariff levels allowed us to conclude that this business model is completely unfeasible given that the NPV values were negative for all the analyzed combinations of capacities and tariff options. Therefore we conducted extra simulations to estimate what would have to be the tariff paid to the energy sold to the grid so that the break-even of the investment was achieved. Case E simulations were initially done considering the current cost of Lithium-ion batteries of 500 €/kWh (Scenario 1). Then we also considered that this value will be reduced to 200 €/kWh (Scenario 2) given that this is the expected evolution till 2020 [6]. Table VII reports the results obtained for these two scenarios for the different tariff options.
TABLE VII. Case E – required tariff levels to get the investment break-even. Tariff option Selling tariff (€/kWh)
Scenario 1 Scenario 2 2 steps (daily cycle) 0.5995 0.3420 2 steps (weekly cycle) 0.5995 0.3421 3 steps (daily cycle) 0.6053 0.3452 3 steps (weekly cycle) 0.7889 0.4228
According to the results in this table, for the current battery price of 500 €/kWh (Scenario 1) it would be necessary that the current selling price of 0.0432 €/kWh (corresponding to 90% of the average wholesale market price) was increased at least 14 times to obtain the break-even. If the investment cost in the Lithium-ion batteries gets reduced to 200 €/kWh (Scenario 2) then the tariff used to pay the energy sold to the grid should increase at least to 0.3420 €/kWh, that is about 8 times more the current value. These results were obtained considering that the off peak tariff is increased at a 2.5% yearly rate. This tariff increase along the simulation horizon turns it more difficult getting the
break-even because buying energy in the off peak periods gets more costly. If this off peak tariff update was not taken into account then the break-even would more easily obtained.
V. CONCLUSIONS
The motivation for this research relies on the increasing interest on storage technologies given the increased flexibility they can bring to operate power systems. Traditionally, this extra flexibility was obtained via pumping hydro stations but more recently the focus moved from large scale storage solutions to smaller scale alternatives namely directed to distribution networks or even to LV end user installations. Regarding distribution system operators, storage can be interesting to help managing distribution networks in terms of the reduction of losses, the improvement of the voltage profile and eventual deferral of network investments. Regarding LV installations, this study concluded that in most cases the installation of storage, namely Lithium-ion batteries is still not sufficiently interesting from an economic point of view, given the still high investment costs. If pure arbitrage was to be done with the batteries, the break-even of the investment would require increasing the tariffs applied to energy sold back to the network by at least 8 times, regarding their current level. Regarding these results it is still important to notice a few relevant points. In the first place, the investment can become more interesting for larger annual demands as indicated in Case C. Secondly, if the price of batteries declines as expected in the next years or other emergent storage technologies get sufficiently mature, then the investment cost can be more rapidly offset. Finally, although pure arbitrage uses of storage are already difficult, in the future they will be even more questionable given the fact that if arbitrage would increase then the demand in off peak periods would increase and in peak periods would decrease thus contributing to reduce the price differential. As a final conclusion, small scale storage can eventually become an interesting alternative but its installation should be carefully examined from an economic point of view.
REFERENCES
[1] Directive 2009/28/EC of the European Parliament and of the Council on the Promotion of the Use of Energy from Renewable Sources, Official Journal of the European Union, April 23 2009.
[2] Decree Law nº 153/2014, Portuguese legislation on self-consumption, October 20 2014 (in Portuguese).
[3] P. Medina, A.W. Bizuayehu, J.P.S. Catalão, E.M.G. Rodrigues, J. Contreras, “Electrical Energy Storage Systems: Technologies’ State-of-Art, Techno-Economic Benefits and Applications Analysis”, Hawaii International Conference on System Science, 2014.
[4] Entidade Reguladora dos Serviços Energéticos, “Demand profiles lor LV clients in 2014”. [Online]. Available: http://www.erse.pt/pt/ electricidade/regulamentos/acessoasredesaasinterligacoes/Documents/A nexo%20II%20%20Perfis%20Consumo%20BT%202014.xls.
[5] Entidade Reguladora dos Serviços Energéticos, “Micro and mini generation profiles for 2014”. [Online]. Available: http://www.erse.pt/pt/electricidade/regulamentos/acessoasredesaasinterli gacoes/Paginas/PerfishorariosdeperdasedeconsumoemBTEBTNeIP.aspx ?master=ErsePrint.master.
[6] McKinsey, “Battery Technology”. [Online]. Available: http://www.mckinsey.com/insights/energy_resources_materials/battery_t echnology_charges_ahead.