Minimal Processing of Foods
Proceedings of the first main meeting
European Commission
COPERNICUS PROGRAMME
Concerted action CIPA-CT94-0195
Escola Super iorde Biotecn ologia, P orto, Port
ugal,December 1995
Editor : Jorge C. Oliveira
A critical literature search was carried out on i) instrumental methods to measure objectively the colour of foods and ii) the determination of the degradation kinetics of food colour under thermal processing conditions. Although there is a significant number of publications dealing with colour measurement and the effect of thermal processing conditions on the colour change, the standardization of measuring methods and the kinetic models are included in only a few. In this communication, a critical review is presented and recommendations for further work are given.
It is well known that the excessive heating of foods produces considerable losses in the organoleptic quality of the final products (Hayakawa and Timbers, 1977).
Kinetic models of the thermal degradation of quality attributes are essential to design new processes that maximize final quality retention with the required degree of safety.
Colour is an organoleptic property that greatly affects the consumer’s acceptability of most food products. Therefore, the retention of colour may be used as an indicator of the damage to the quality of foods due to thermal processing (Banga et al, 1993).
The objective measurement of food colour can be used for on-line quality control of food processes. Although the sensory evaluation of food colour is more reliable, it is also a subjective and time consuming method (Ohlsson, 1980).
The objective of this work was to perform a critical literature search on: 1) Instrumental methods to measure objectively the colour of food products, 2) Mathematical modeling of food colour degradation kinetics under thermal processing conditions and 3) Research work applying colour degradation kinetic data to optimize process conditions in terms of final quality retention.
Summary
Modelling Food Colour Degradation Kinetics - A Review
Cristina L. M. Silva & Panos Igniatidis
Escola Superior de Biotecnologia, Universidade Católica Portuguesa, Porto, Portugal
Most colours are uniquely specified by a set of three imaginary red (X), green (Y), and blue (Z) primaries. These are CIE tristimulus values. To make colour data more intuitive and easier to interpret, these tristimulus values are usually converted to other colour scales (e.g. luminance factor Y% and the chromaticity coordinates x, y). The Hunter L, a and b colour scales are opponent-type systems. These measure the degree of lightness (L), the degree of redness or greenness (+/- a), and the degree of yellowness or blueness (+/- b) (Hutchings, 1994). The difference between two colors may be calculated as:
(1)
where TCD is the total colour difference.
Some other more particular colour parameters have been used in the field of food science: e.g. browning index,
(2)
Yellowness index
YI = 142.86 b / L (3)
and the parameter S.
S = R560 + R590 + R635 (4)
As can be observed in table 1, most of the work published in the field of modelling colour thermal degradation considered first order models:
(5)
or
(6) C = Co 10- t / DT
C = Co exp (- kT t)
Bronwning index = absorbance ratio A520/ 430 or 420 nm TCD = ∆a2 +∆b2 +∆L2
2. Colour measurements
where C is the parameter of color, Co the level of C at time zero, kT the rate constant at constant temperature T, DT the decimal reduction time at temperature T and t the time.
Zero order models have also been widely used (Table 1):
(7)
The reaction order can be determined using the following equation:
(8)
where n is the reaction order.
The effect of temperature on reaction rate constants was described by the Arrhenius equation:
(9)
where Ea is the activation energy, T the absolute temperature, R the universal gas constant and ko the rate constant at infinite temperature.
For the thermal destruction time model described in equation 6, the temperature dependence follows the equation proposed by Bigelow:
(10)
where z is the temperature sensitivity of the decimal reduction time DT.
Table 1 presents a review of the research work published on modelling colour thermal degradation kinetics.
Several products were studied and several instruments and colour parameters were used to quantify the colour. For the same type of product there are no standardized methods.
In most cases a first order or a zero order model was able to model the reaction kinetics at constant temperature. The Arrhenius (9) or the Bigelow (10) equations were used to describe the effect of temperature.
The number of papers relating the objective measurement of food colour with sensory evaluation is still limited. Furthermore, very few authors use the kinetic data determined to validate and/or optimize processing conditions in terms of final quality retention.
DT = DTref 10(Tref - T) / z kT = ko exp (- Ea R T) ln ( - ∂C ∂t ) = ln kT + n ln C C = Co - kT t
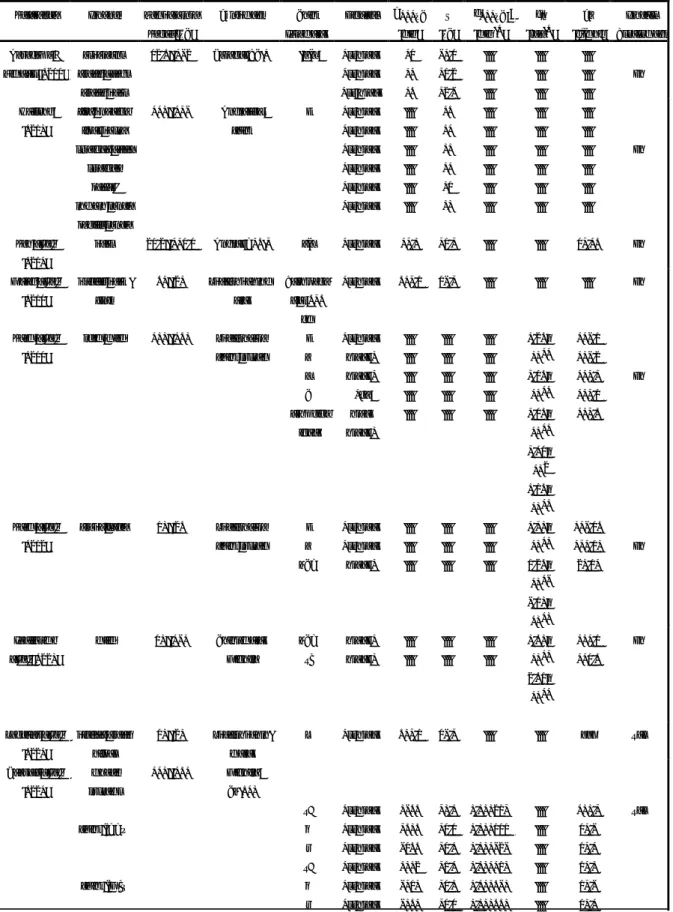
Table I Kinetics of color degradation
Reference Product Temperature Range (˚C) Equipment Color Parameter Kinetics D121˚C (min) Z (˚C) k121˚C (min -1) ko (sec-1) Ea (kJ/mol) Process Assessment Hayakawa & Timbers (1977) asparagus green beans green peas
79.5 - 149 Gardner AC-1 - a/b 1st order 1st order 1st order 17 21 25 41.7 38.9 39.4 ----No Ohlsson (1980) fish pudding liver paste strained beef strained veget. tomato sauce vanilla sauce 110 - 134 Hunterlab color L 1st order 1st order 1st order 1st order 1st order 1st order ----25 21 22 21 28 20 ----No Rao et.al. (1981)
peas 98.9 - 126.7 Hunter D25-3 a/b 1st order 13.2 38.3 ---- ---- 73.15 No
Merin et.al. (1987) prickly pear -fruit 50 - 90 Spectrophotom eter Absorvanc e at 535 nm 1st order 523.6 74.3 ---- ---- ---- No Rhim et.al. (1988)
skim milk 100 - 150 Spectrogard color system L a b C browning index 1st order order 0 order 0 2nd order order 0 ----1.95 x 10¹¹ 3.75 x 10¹¹ 2.75 x 10¹² 3.17 x 10⁹ 2.65 x 10¹² 114.8 104.9 110.3 103.6 123.5 No Rhim et.al. (1989)
grape juice 60 - 95 Spectrogard color system L a TCD 1st order 1st order order 0 ----1.30 x 10¹² 8.95 x 10¹⁴ 4.80 x 10¹⁰ 114.75 131.80 92.81 No Pagliarimi et.al. (1990) milk 70 - 140 Colorimeter Minolta TCD YI order 0 order 0 ----2.50 x 10¹¹ 9.58 x 10¹¹ 101.8 117.5 No Sanchez et.al. (1991) picked green olives 70 - 90 Spectrophoto-meter S 1st order 523.6 74.3 ---- ---- ___ Yes Ghazala et.al. (1991) model systems color / DDW color / MIX 110 - 150 Minolta CT-210 Y% x y Y% x y 1st order 1st order 1st order 1st order 1st order 1st order 2455 3525 4755 2029 4360 4252 30.2 37.8 37.2 38.1 37.0 37.7 0.000963 0.000668 0.000494 0.001160 0.000540 0.000552 ----102.3 81.4 83.1 81.0 83.4 82.1 Yes
Several instruments and colour parameters are used to quantify the colour change during thermal processing. For the same type of product there are no standardized methods.
Few authors attempted to quantify the kinetics of colour degradation of foods under thermal processing conditions. In most cases where it is, first or zero order reaction kinetics are used. The work relating the objective measurement of food colour with sensory evaluation is still limited. Furthermore, very few authors use the kinetic data determined to validate and/or optimize processing conditions in terms of final quality retention.
There is a need to define adequate and standardized methods to measure objectively the colour of food products.
The kinetic data should be correlated with sensory evaluation.
The use of colour kinetic data to assess the final product quality retention and predict optimal processing conditions must be evaluated.
Banga, J. R., Alonso, A. A., Gallardo, J. M. & Pérez-Martin, R. I. (1993). Kinetics of Thermal Degradation of Thiamine and Surface Colour in Canned Tuna. Lebensmittel-Untersuchung un-Forschung 197, 127-131.
Ghazala, S., Ramaswamy, H. S., van de Voort, F. R. & Al-Kanani, T. (1991). Kinetics of Clor Developement in Aqueous Systems at High Temperatures. Journal of Food Engineering 13, 79-89. Hayakawa, K & Timbers, G. E. (1977). Influence of Heat Treatment on the Quality of Vegetables: Changes in Visual Green Color. Journal of Food Science 42 (3), 778-781.
Hutchings, J. B. (1994). Food Colour and Appearance. Blackie Academic & Professional, London. Merin, U., Gagel, S., Popel, G., Bernstein, S. & Rosenthal, I. (1987). Thermal Degradation Kinetics of Prichly-Pear-Fruit Red Pigment. Journal of Food Science 52 (2), 485-486.
Ohlsson, T. (1980). Temperature Dependence of Sensory Quality Changes during Thermal Processing. Journal of Food Science 45, 836-839.
Pagliarini, E., Vernile M. & Peri, C. (1990). Kinetic Study on Color Changes in Milk Due to Heat. Journal of Food Science 55 (6), 1766-1767.
Rao, M. A., Lee, C. Y., Katz, J. & Cooley, H. J. (1981). A Kinetic Study of the Loss of Vitamin C, Color, ans Firmness during Thermal Processing of Canned Peas. Journal of Food Science 46,
636-5. Conclusions
6. Recommendations for further work
Rhim, J. W., Jones, V. A. & Swartzel, K. R. (1988). Kinetics Studies in the Colour Changes of Skim Milk. Lebensm.-Wiss. u.-Technol. 21, 334-338.
Rhim, J. W., Nunes, R. V., Jones, V. A. & Swartzel, K. R. (1989). Kinetics of Color Change of Grape Juice Generated using Linearly Increasing Temperature. Journal of Food Science 54 (3), 776-777. Sánchez, A. H., Rejano, L. & Montano, A. (1991). Kinetics of the Destruction by Heat or Colour and Texture of Pickled Green Olives. Journal of Science Food Agricultural 54, 379-385.
Shin, S. and Bhowmik, S.R. (1995). Thermal Kinetics of Color Changes in Pea Puree. Journal of Food Engineering 24, 77-86.