doi: 10.3389/fpubh.2018.00038
Edited by: Onyebuchi A. Arah, University of California, Los Angeles, United States
Reviewed by: Mario Ulises Pérez-Zepeda, Instituto Nacional de Geriatría, Mexico Terri Kang Johnson, Dexcom, Inc., United States
*Correspondence: Helena Canhão helena.canhao@nms.unl.pt
†These authors have contributed
equally to this work.
Specialty section: This article was submitted to Epidemiology, a section of the journal Frontiers in Public Health
Received: 03 November 2017 Accepted: 01 February 2018 Published: 21 February 2018
Citation: Gregório MJ, Rodrigues AM, Graça P, de Sousa RD, Dias SS, Branco JC and Canhão H (2018) Food Insecurity Is Associated with Low Adherence to the Mediterranean Diet and Adverse Health Conditions in Portuguese Adults. Front. Public Health 6:38. doi: 10.3389/fpubh.2018.00038
Food insecurity is associated with
low adherence to the Mediterranean
Diet and adverse health conditions
in Portuguese adults
Maria João Gregório1,2,3,4†, Ana M. Rodrigues1,4,5,6†, Pedro Graça2,3, Rute Dinis de Sousa1,4, Sara S. Dias1,4,7, Jaime C. Branco1,4,5,8 and Helena Canhão1,4,5,9,10*
1 EpiDoC Unit, Centro de Estudos de Doenças Crónicas (CEDOC) da NOVA Medical School, Universidade Nova de Lisboa
(NMS/UNL), Lisboa, Portugal, 2 Faculdade de Ciências da Nutrição e Alimentação da Universidade do Porto, Porto,
Portugal, 3 Programa Nacional para a Promoção da Alimentação Saudável, Direção-Geral da Saúde, Lisboa, Portugal, 4 EpiSaúde Scientific Association, Évora, Portugal, 5 Sociedade Portuguesa de Reumatologia, Lisboa, Portugal,
6 Rheumatology Research Unit, Instituto de Medicina Molecular, Lisboa, Portugal, 7 Unidade de Investigação em Saúde (UI),
Escola Superior de Saúde do Instituto Politécnico de Leiria, Leiria, Portugal, 8 Serviço de Reumatologia do Hospital Egas
Moniz – Centro Hospitalar Lisboa Ocidental (CHLO-E.P.E.), Lisboa, Portugal, 9 Escola Nacional de Saúde Pública da
Universidade Nova de Lisboa, Lisboa, Portugal, 10 Serviço Reumatologia, Centro Hospitalar Lisboa Central-HSM, Lisboa,
Portugal
Background: Food insecurity is a limited or uncertain access to the adequate food and is a significant public health problem. We aimed to assess determinants of food insecu-rity and the corresponding health impact in Portugal, a southern European country that faced a severe economic crisis.
Methods: Data were derived from the Epidemiology of Chronic Diseases Cohort Study (EpiDoC), a population-based cohort of 10,661 individuals that were representative of the Portuguese adult population and followed since 2011. A cross-sectional analysis of the third wave of evaluation (EpiDoC 3) was performed between 2015 and 2016. Food insecurity was assessed with the household food insecurity psychometric scale. Socioeconomic, demographic, lifestyle, adherence to Mediterranean diet (MD), self-re-ported non-communicable disease, health-related quality of life (HRQoL) (EQ-5D-3L), physical function (HAQ score), and health resource consumption information was also collected.
conclusion: We found that food insecurity is highly prevalent in Portugal. Food insecu-rity was associated with low adherence to the MD, non-communicable chronic diseases, lower quality of life, and higher health resource consumption. Therefore, this study pro-vides valuable insight into the relationship between food security and the diet and health of the population during an economic crisis.
Keywords: economic crisis, food insecurity, Mediterranean diet, non-communicable diseases, health-related quality of life, health resources consumption
inTrODUcTiOn
Food insecurity is defined as a socioeconomic situation that leads to limited or uncertain access to the nutritious food necessary to maintain a healthy and active life (1). Food insecurity is a sig-nificant public health problem and is associated with unhealthy dietary habits and chronic diseases (2–4). Several studies have shown that food insecurity is associated with unhealthy dietary patterns, including reduced intake of fruits, vegetables, and dairy products, and increased intake of energy-dense foods (2,
3). These unhealthy dietary habits are common among food insecure households and may mediate the association between food insecurity and health.
The Mediterranean diet (MD) is a traditional dietary pattern of southern European countries and has been shown to be a healthy diet. This dietary pattern is characterized by a high intake of fruits and vegetables, whole grains, legumes, nuts, and olive oil and a moderate intake of meat. In fact, it is recognized that the MD is associated with lower risk for several chronic diseases, such as cardiovascular events, diabetes, and cancer (5, 6). Some studies have suggested that reduced adherence to the MD in southern European countries during recent years may be related to the European economic crisis (7, 8). This raises questions regarding the impact of the economic crisis on dietary habits, especially those of citizens with food insecurity. Food insecurity may be an important indicator that should be monitored to understand how the socioeconomic situation might be compromising food intake and changing dietary habits.
Food insecurity has been widely studied in the USA and Canada; however, there is a lack of epidemiological data in southern European countries. Addressing food insecurity during an economic crisis is of particular relevance because it is known that periods of economic, political, and social instability tend to notably affect the most vulnerable population strata. In fact, as a result of economic crisis in Portugal, the government adopted austerity policies and large cuts to public expenditure that could lead to inequalities in access to food. Therefore, it is of upmost importance to evaluate food insecurity in a representative sample of the Portuguese population. Moreover, it is important to evalu-ate the impact of food insecurity on diet and health. The aim of this study was to investigate the prevalence of food insecurity, the association of food insecurity with sociodemographic and economic determinants, and the impact on health status and the consumption of other health resources in a country that faced a recent, severe economic crisis.
MaTerials anD MeThODs
study Design and Participants
The cross-sectional data presented in this study were collected at the third follow-up evaluation wave of the Epidemiology of Chronic Diseases Cohort Study (EpiDoC 3). The EpiDoC cohort was designed to study health determinants and outcomes, chronic non-communicable diseases, and their impact on health resource consumption. The EpiDoC cohort included adults (greater than 18 years old) who were non-institutionalized and living in private households in the mainland and the islands (Azores and Madeira) of Portugal (9). The EpiDoC sample size calculation was performed in order to capture health-related conditions with a prevalence of at least 0.5%, as described elsewhere (10). The estimated prevalence of household food insecurity was notably higher; thus, our sample size had adequate statistical power for the aim of EpiDoC 3. All of the 10,661 participants of the EpiDoC 1 study who signed the informed consent for follow-up and those who provided their telephone number were enrolled in the subse-quent follow-up evaluations of the EpiDoC closed cohort studies (EpiDoC 2 and EpiDoC 3) (11). The flowchart of the EpiDoC cohort is described in Figure 1, and EpiDoC 3 included 5,653 participants.
Data collection
In the EpiDoC 3 wave of evaluation, a structured questionnaire was applied through computer-assisted phone call interviews by a trained research assistant team from September 1, 2015 to July 28, 2016. Database access is protected by a unique username and password for each research team member. The question-naire of EpiDoC 3 was constructed using the core questions of the EpiDoC cohort and adding a food insecurity questionnaire and related items. The questionnaire was tested and improved to ensure respondents’ comprehension of the questions and high response rates.
Measurements
FigUre 1 | Flowchart of the EpiDoC cohort (consisting of three studies).
rheumatic disease, allergies, gastrointestinal disease, mental disease, cardiac disease, pulmonary disease, cancer, neurologic disease, and psoriasis).
Health-related quality of life (HRQoL) was assessed using the European Quality of Life questionnaire with five dimensions and three levels (EQ-5D-3L) (12, 13). A higher HRQoL score corre-sponds to a higher quality of life. Physical function was evaluated based on the Health Assessment Questionnaire (HAQ, 0–3) (14). Higher HAQ scores correspond to reduced functional ability of the individual. We used Portuguese-validated versions of these assessment scales. Data regarding hospitalization in the previous 12 months (Yes/No), number of clinic appointments, doctor visit reduction due to economic difficulties (Yes/No), and stoppage of medication due to economic difficulties (Yes/No) were also recorded. Self-reported height and weight were collected and body mass index (BMI) was calculated and categorized according to the World Health Organization classification (15). Questions concerning lifestyle habits included frequency of alcohol intake (daily, occasionally, never), quantity of alcohol units per week (≤3 alcohol units per week; >3 alcohol units per week but <3 alcohol units per day; >3 alcohol units per day), smoking habits (daily, occasionally, past smoker, never smoked), and frequency and type of physical activity. Physical activity level was classified based on the reported weekly frequency of physical activity: inac-tive (<1 h/week), moderately active (between 1 and 2.5 h/week), and active (≥2.5 h/week).
To assess adherence to the MD, a PREDIMED (PREvención con DIeta MEDiterránea) questionnaire was applied. This is a 14-item questionnaire with questions based on the number of
servings and frequencies of consumption for typical food or food groups of the MD (e.g., olive oil, nuts, fruits, vegetables, pulses, seafood) or questions about the consumption of foods that are not part of the traditional MD (e.g., red or processed meats, sweetened beverages and sweets, commercial bakery, or sugary desserts). A score ≥10 corresponds to a high adherence to the MD, and a score <10 corresponds to a low adherence to the MD (16).
case Definition and assessment
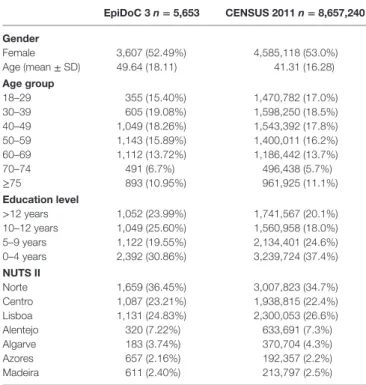
TaBle 1 | Sociodemographic characteristics of the adult Portuguese population: EpiDoC 3 and Census 2011 populations (Portuguese population).
epiDoc 3 n = 5,653 censUs 2011 n = 8,657,240
gender
Female 3,607 (52.49%) 4,585,118 (53.0%)
Age (mean ± SD) 49.64 (18.11) 41.31 (16.28)
age group
18–29 355 (15.40%) 1,470,782 (17.0%)
30–39 605 (19.08%) 1,598,250 (18.5%)
40–49 1,049 (18.26%) 1,543,392 (17.8%)
50–59 1,143 (15.89%) 1,400,011 (16.2%)
60–69 1,112 (13.72%) 1,186,442 (13.7%)
70–74 491 (6.7%) 496,438 (5.7%)
≥75 893 (10.95%) 961,925 (11.1%)
education level
>12 years 1,052 (23.99%) 1,741,567 (20.1%)
10–12 years 1,049 (25.60%) 1,560,958 (18.0%)
5–9 years 1,122 (19.55%) 2,134,401 (24.6%)
0–4 years 2,392 (30.86%) 3,239,724 (37.4%)
nUTs ii
Norte 1,659 (36.45%) 3,007,823 (34.7%)
Centro 1,087 (23.21%) 1,938,815 (22.4%)
Lisboa 1,131 (24.83%) 2,300,053 (26.6%)
Alentejo 320 (7.22%) 633,691 (7.3%)
Algarve 183 (3.74%) 370,704 (4.3%)
Azores 657 (2.16%) 192,357 (2.2%)
Madeira 611 (2.40%) 213,797 (2.5%)
Nomenclature of Territorial Units for Statistics (NUTS II) (Norte, Centro, Alentejo, Algarve, Lisboa, Madeira, and Azores).
Sample size is not constant due to missing data.
EpiDoC 3—gender (n = 5,648); age (n = 5,648); education (n = 5,648); NUTS II (n = 5,648).
statistical analysis
To verify the representativeness of the sample according to the Portuguese population (mainland and islands), we first com-pared the participants and non-participants of the EpiDoC 3 study with respect to their sociodemographic, socioeconomic, and health status characteristics. Based on this comparison, we adjusted the weights according to stratification by Nomenclature of Territorial Unit for Statistics (NUTS II) region, gender, and age group. Extrapolation weights were computed and used in the subsequent statistical analyses. These were obtained by calibrating the extrapolation weights originally designed for the EpiDoC 1 study sample (9). Absolute frequencies and weighted proportions were used to summarize categorical variables. Continuous variables were described by weighted mean values and SDs. Prevalence estimates for food insecurity were com-puted as weighted proportions according to region, age groups, gender, employment status, years of schooling, single-parent family, household with children, household with elderly, house-hold income perception, BMI, and adherence to MD. After a descriptive analysis, participants were categorized as “food secure” (high food security) and “food insecure” (including low, moderate, and severe insecurity groups). Subjects with and without food insecurity were compared. Univariable analyses were first performed considering the study design (crude analy-sis). Multivariate regression models were used to assess dietary, other lifestyles, anthropometric data (BMI), health-related characteristics, and health-care resource consumption differ-ences between individuals with and without food insecurity. In order to adjust the differences between groups, the following potential confounders were included in the logistic regression analysis: age group, gender, educational level, employment sta-tus, and NUTS II (adjusted analysis). Significance level was set at 0.05. All analyses were performed using STATA IC version 12 (StataCorp. 2011. Stata Statistical Software: Release 12. College Station, TX, USA: StataCorp LP).
ethical issues and Personal Protection
Details of the ethical issues of the EpiDoC cohort were previously described (9). The EpiDoC 3 study was performed according to the principles established by the Declaration of Helsinki (20) and revised in 2013 in Fortaleza. The study was reviewed and approved by the National Committee for Data Protection and by the NOVA Medical School Ethics Committee (9).resUlTs
Food insecurity Prevalence and
associated Factors in the Portuguese
adult Population
In EpiDoC 3, a total of 5,653 participants were interviewed. The EpiDoC 3 population did not differ from the Portuguese popu-lation (Table 1). Between 2015 and 2016, 19.3% of Portuguese households experienced some level of food insecurity during the previous 3 months. Most food insecure households were in the lower level of food insecurity (14.0%), but 3.5 and 1.8% had moderate and severe food insecurity, respectively.
Analysis of the socioeconomic factors associated with food insecurity revealed that women (OR = 1.73; 95% IC 1.37–2.18), the less educated (10–12 vs <12 years: OR = 3.10; 95% IC 1.89–5.07; 5–9 vs <12 years: OR = 4.35; 95% IC 2.75–6.90; 0–4 vs <12 years: OR = 7.11; 95% IC 4.49–11.26), individuals aged between 40 and 49 years (OR = 2.28; 95% IC 1.05–4.97), and individuals aged between 50 and 59 years (OR = 2.42; 95% IC 1.10–5.33) had a higher risk of being food insecure. When compared to individuals in a situation of full-time employment, households of individuals who were part-time employed, domes-tic workers, or unemployed were more likely to be food insecure (OR = 1.68; 95% IC 1.23–2.30). Households living in the Azores (OR = 1.57; 95% IC 1.12–2.20) and Madeira (OR = 1.94; 95% IC 1.32–2.85) also had higher probabilities of being classified as food insecure (Table 2).
Participants from Food insecure
households had significantly lower
adherence to the MD
TaBle 2 | Comparison of sociodemographic, socioeconomic, lifestyles characteristics, and Mediterranean diet (MD) characteristics between households with and without food insecurity.
Food secure n = 4,151
Food insecure n = 1,380
crude Or (95% ic)
p-Value adjusted Or (95% ic)a
p-Value
gender
Female 2,506 (49.82%) 1,033 (63.96%) 1.79 (1.40–2.28) 0.000 1.73 (1.37–2.18) 0.000
age group
18–29 320 (17.31%) 30 (7.65%) 1 1
30–39 492 (20.7%) 106 (13.41%) 1.47 (0.60–3.58) 0.401 1.67 (0.73–3.82) 0.244
40–49 782 (18.0%) 256 (19.82%) 2.49 (1.06–5.88) 0.037 2.28 (1.05–4.97) 0.038
50–59 785 (14.28%) 345 (22.95%) 3.64 (1.54–8.60) 0.003 2.42 (1.10–5.33) 0.028
60–69 805 (13.61%) 288 (14.42%) 2.40 (1.01–5.67) 0.046 1.23 (0.56–2.69) 0.613
70–74 347 (6.04%) 128 (8.80%) 3.30 (1.23–8.82) 0.018 1.67 (0.69–4.01) 0.254
≥75 620 (10.07%) 227 (12.94%) 2.91 (1.23–6.88) 0.015 1.30 (0.61–2.81) 0.497
education level
>12 years 966 (28.04%) 72 (7.56%) 1 1
10–12 years 862 (27.01%) 174 (20.69%) 2.84 (1.64–4.93) 0.000 3.10 (1.89–5.07) 0.000
5–9 years 795 (18.61%) 307 (23.86%) 4.75 (2.98–7.57) 0.000 4.35 (2.75–6.90) 0.000
0–4 years 1,513 (26.35%) 809 (47.87%) 6.74 (4.33–10.49) 0.000 7.11 (4.49–11.26) 0.000
nUTs ii
Norte 1,243 (36.44%) 388 (36.94%) 1 1
Centro 819 (23.22%) 241 (23.25%) 0.99 (0.74–1.31) 0.934 1.01 (0.75–1.36) 0.958
Lisboa 908 (25.67%) 200 (21.08%) 0.81 (0.57–1.16) 0.249 1.03 (0.67–1.57) 0.891
Alentejo 243 (7.13%) 71 (7.70%) 1.07 (0.73–1.56) 0.745 1.06 (0.72–1.56) 0.772
Algarve 127 (3.53%) 48 (4.24%) 1.19 (0.75–1.87) 0.467 1.27 (0.79–2.02) 0.321
Azores 430 (1.91%) 216 (3.2%) 1.66 (1.23–2.25) 0.001 1.57 (1.12–2.20) 0.009
Madeira 381 (2.10%) 216 (3.57%) 1.68 (1.20–2.35) 0.003 1.94 (1.32–2.85) 0.001
single-parent family 183 (4.58%) 102 (6.84%) 1.24 (1.04–1.48) 0.016 1.16 (0.96–1.40) 0.114
employment status
Employed full-time 1,870 (53.27%) 360 (32.21%) 1 –
Employed part-time 134 (4.09%) 54 (3.60%) 1.46 (0.91–2.34) 0.121 –
Domestic worker 265 (3.95%) 182 (8.14%) 3.41 (2.46–4.72) 0.000 –
Unemployed 299 (9.43%) 201 (18.74%) 3.28 (1.98–5.45) 0.000 –
Student 79 (3.63%) 8 (0.95%) 0.43 (0.19–1.01) 0.000 –
Temporally work disabled 64 (1.19%) 50 (3.33%) 4.63 (2.71–7.89) 0.053 –
Retired 1,434 (24.44%) 523 (33.04%) 2.24 (1.74–2.88) 0.000 –
employment status
Employed full-time/student/temporally work disabled/retired
3,447 (82.52%) 941 (69.53%) 1 1
Unemployed/employed part-time/domestic worker 698 (17.48%) 437 (30.47%) 2.07 (1.50–2.85) 0.000 1.68 (1.23–2.30) 0.001
income perception
Living comfortably in the present income 988 (27.41%) 29 (3.29%) 1 1
Living in the present income 2,015 (48.93%) 253 (19.13%) 3.25 (1.87–5.65) 0.000 2.70 (1.49–4.91) 0.001
Finding difficult in the present income 924 (19.80%) 620 (46.66%) 19.61 (11.32–33.96) 0.000 14.17 (7.75–25.91) 0.000
Finding it very difficult in the present income 200 (3.85%) 471 (30.91%) 66.80 (37.03–120.49) 0.000 45.35 (23.98–85.76) 0.000
BMi (kg/m2)
Underweight 71 (2.28%) 17 (1.44%) 1 1
Normal weight 1,611 (46.23%) 389 (37.06%) 1.27 (0.57–2.84) 0.556 1.30 (0.52–3.23) 0.572
Overweight 1,583 (37.20%) 507 (39.62%) 1.69 (0.77–3.72) 0.191 1.42 (0.57–3.56) 0.448
Obesity 668 (14.29%) 309 (21.88%) 2.43 (1.10–5.40) 0.029 1.73 (0.70–4.31) 0.236
alcohol intake
Daily 1,259 (30.82%) 299 (24.79%) 0.53 (0.39–0.72) 0.000 0.60 (0.43–0.82) 0.001
Occasionally 1,575 (41.3%) 439 (33.09%) 0.53 (0.40–0.70) 0.000 0.77 (0.56–1.05) 0.101
Never 1,305 (27.88%) 635 (42.12%) 1 1
alcohol intake profile
More than 3 alcohol units vs less 151 (4.39%) 34 (3.23%) – –
smoking habits
Past smoker 900 (21.11%) 243 (21.21%) 1.03 (0.78–1.35) 0.833 1.47 (1.01–2.13) 0.043
Current smoker 594 (19.65%) 206 (21.63%) 1.13 (0.77–1.65) 0.533 1.69 (1.13–2.54) 0.011
Occasionally 59 (1.6%) 15 (0.95%) 0.60 (0.30–1.21) 0.152 1.14 (0.56–2.30) 0.721
Never 2,590 (57.60%) 909 (56.20%) 1 1
Physical activity
Regular 1,895 (46.67%) 476 (37.16%) 0.28 (0.24–0.32) 0.003 0.85 (0.64–1.13) 0.271
PreDiMeD
Low adherence to MD 3,628 (86.9%) 1,299 (94.0%) 1 1
High adherence to MD 593 (13.1%) 81 (5.9%) 0.42 (0.30–0.58) 0.000 0.44 (0.31–0.62) 0.000
Food secure n = 4,151
Food insecure n = 1,380
crude Or (95% ic)
p-Value adjusted Or (95% ic)a
p-Value
Use olive oil as principal source of fat for cooking 3,720 (89.86%) 1,166 (84.74%) 0.70 (0.53–0.93) 0.015 0.63 (0.46–0.87) 0.005
Olive oil consumption (>4 Tbsp.) 927 (22.33%) 208 (15.07%) 0.55 (0.43–0.70) 0.000 0.60 (0.46–0.78) 0.000
Vegetables consumption (≥2 servings per day) 1,006 (24.24%) 271 (19.64%) 0.80 (0.64–0.99) 0.045 0.77 (0.61–0.97) 0.024
Fruit consumption (≥3 servings per day) 1,450 (34.93%) 323 (23.41%) 0.71 (0.52–0.96) 0.027 0.68 (0.47–1.00) 0.048
Consumption of red meat, hamburger, or sausages (<1 per day)
2,985 (71.91%) 1,130 (81.88%) 2.07 (1.63–2.64) 0.000 1.91 (1.45–2.53) 0.000
Consumption of butter, margarine, or cream (<1 per day)
2,811 (67.72%) 1,017 (73.70%) 1.12 (0.87–1.44) 0.378 1.10 (0.85–1.42) 0.471
Carbonated and/or sugar-sweetened beverages consumption (<1 per day)
3,562 (85.81%) 1,160 (84.06%) 0.94 (0.73–1.22) 0.642 0.80 (0.61–1.06) 0.127
Wine consumption (≥7 cups per week) 1,004 (24.19%) 245 (17.75%) 0.81 (0.62–1.07) 0.144 0.72 (0.54–0.96) 0.027
Pulses consumption (≥3 servings per week) 1,071 (25.80%) 282 (20.43%) 0.72 (0.56–0.93) 0.013 0.76 (0.58–1.01) 0.055
Fish/seafood consumption (≥3 servings per week) 2,494 (60.08%) 613 (44.42%) 0.63 (0.49–0.80) 0.000 0.71 (0.54–0.93) 0.012
Consumption of commercial (not homemade) pastry (<2 servings per week)
2,546 (61.33%) 930 (67.39%) 1.17 (0.93–1.48) 0.189 1.03 (0.78–1.35) 0.849
Nuts consumption (≥3 servings per week) 658 (15.85%) 99 (7.17%) 0.37 (0.27–0.50) 0.000 0.48 (0.34–0.68) 0.000
Preference to eat chicken, turkey, or rabbit instead of beef, pork, hamburgers, or sausages
2,581 (62.57%) 860 (62.45%) 1.22 (0.99–1.51) 0.064 1.22 (0.98–1.52) 0.081
Consumption of boiled vegetables, pasta, rice, or other dishes with a sauce of tomato, garlic, onion, or leeks sautéed in olive oil (≥2 servings per week)
1,825 (43.97%) 526 (38.12%) 0.62 (0.50–0.77) 0.000 0.71 (0.55–0.93) 0.012
aAdjusted for age group, gender, educational level, employment status, and NUTS II.
Sample size is not constant due to missing data.
EpiDoC 3—gender (n = 5,531); age (n = 5,531); education (n = 5,498); NUTS II (n = 5,531); single-parent family (n = 5,531); employment status (n = 5,523); income perception (n = 5,500); body mass index (BMI) (n = 5,155); alcohol intake (n = 5,503); smoking habits (n = 5,516); physical activity (n = 5,648); PREDIMED (n = 5,531).
Food secure—gender (n = 4,151); age (n = 4,151); education (n = 4,136); NUTS II (n = 4,151); single-parent family (n = 4,151); employment status (n = 4,145); income perception (n = 4,127); BMI (n = 3,933); alcohol intake (n = 4,132); smoking habits (n = 4,143); physical activity (n = 4,151); PREDIMED (n = 4,151).
Food insecure—gender (n = 1,380); age (n = 1,380); education (n = 1,362); NUTS II (n = 1,380); single-parent family (n = 1,380); employment status (n = 1,378); income perception (n = 1,373); BMI (n = 1,222); alcohol intake (n = 1,371); smoking habits (n = 1,373); physical activity (n = 1,380); PREDIMED (n = 1,380).
fruit ≥3 servings per day (OR = 0.68; 95% IC 0.47–1.00), fish or seafood ≥3 servings per week (OR = 0.71; 95% IC 0.54–0.93), and nuts ≥3 servings per week (OR = 0.48; 95% IC 0.34–0.68) (Table 2).
Participants from Food insecure
households had a significantly lower
Quality of life, Physical Functioning, and
consumed More health-care resources
To investigate the association of food insecurity with self-reported non-communicable diseases, weighted proportions were adjusted for age, gender, educational level, employment status, and NUTS II. We found that diabetes (OR = 1.69; 95% IC 1.20–2.40), pul-monary disease (OR = 1.67; 95% IC 1.14–2.45), and rheumatic disease (OR = 1.67; 95% IC 1.07–2.60) were independently asso-ciated with household food insecurity. The individuals of food insecure households also had a lower quality of life (EQ-5D-3L score: OR = 0.18; 95% IC 0.11–0.31), a higher physical disability (HAQ score: OR = 2.59; 95% IC 2.04–3.29), and a higher risk of having depression symptoms (OR = 1.50; 95% IC 1.09–2.06). Individuals from food insecure households had been more often hospitalized (OR = 1.57; 95% IC 1.18–2.07), had gone more frequently to medical appointments in hospitals (OR = 1.48; 95% IC 1.12–1.94) since last contact, and presented a higher number of medical appointments in the public sector (OR = 1.07; 95% IC 1.04–1.11). Individuals of food insecure households were more likely to have reported stopping medication (OR = 5.13;95% IC 3.86–6.82) and reducing doctor visits due to economic constraints (OR = 4.23; 95% IC 3.09–5.78) (Table 3).
DiscUssiOn
Using a large population-based database from Portugal, a south-ern European country that faced a severe economic crisis, we found that the major determinants of food insecurity were unem-ployment or precarious emunem-ployment conditions, single-parent family, low education level, and insufficient household income perception. These findings are in accordance with previous studies. The national survey on food insecurity in Canada found that lone-parent families, in particular those headed by women, were the most vulnerable to food insecurity (21). Furthermore, lone-parent families, unemployment or precarious employment condition, low education, and low income are sociodemographic and economic determinants of food insecurity reported world-wide (21, 22). In terms of the employment situation, some studies have highlighted the severe impact of a precarious employment situation on health outcomes, even in comparison with an unem-ployment situation (23).
The estimated prevalence of food insecurity in Portugal between 2015 and 2016 was 19.3%. The Azores and Madeira Islands were the two regions most affected by food insecurity. A previous study conducted in Portugal in 2003, reported a food insecurity prevalence of 8.1% (24). Between 2005 and 2006, data from the last Portuguese National Health Survey estimated a food insecurity prevalence of 16.7% (25). Comparisons between
TaBle 3 | Comparison of health status and healthcare resources consumption between households with and without food insecurity.
Food secure n = 4,151
Food insecure n = 1,380
crude Or (95% ic)
p-Value adjusted Or (95% ic)
p- Value
Number of non-communicable diseases (self-reported) 0.76 (±1.04) 1.14 (±1.49) – – –
non-communicable diseases (self-reported)
High blood pressure 1,263 (22.47%) 567 (34.07%) 1.78 (1.43–2.23) 0.000 1.23 (0.94–1.62)a 0.134
Diabetes 433 (7.53%) 234 (15.18%) 2.20 (1.56–3.10) 0.000 1.69 (1.20–2.40)a 0.003
High cholesterol level 1,244 (23.27%) 546 (33.56%) 1.67 (1.33–2.08) 0.000 1.19 (0.93–1.52)a 0.166
Hyperuricemia 94 (1.84%) 31 (2.24%) 1.23 (0.75–2.00) 0.417 1.16 (0.71–1.91)a 0.553
Pulmonary disease 135 (2.24%) 71 (5.03%) 2.32 (1.59–3.36) 0.000 1.67 (1.14–2.45)a 0.008
Cardiac disease 467 (9.13%) 220 (12.64%) 1.44 (1.12–1.87) 0.007 1.24 (0.92–1.68)a 0.160
Gastrointestinal disease 369 (8.25%) 168 (11.63%) 1.46 (1.07–2.01) 0.017 1.21 (0.87–1.68)a 0.254
Neoplastic disease 219 (4.38%) 93 (5.53%) 1.28 (0.89–1.84) 0.188 1.06 (0.73–1.55)a 0.755
non-communicable diseases (diagnosed)
Diagnosis of rheumatic disease 325 (5.79%) 183 (11.7%) 2.16 (1.51–3.08) 0.000 1.67 (1.07–2.60)b 0.010
Mental health
Depression 285 (4.96%) 165 (10.89%) 2.34 (1.77–3.11) 0.000 1.50 (1.09–2.06)b 0.012
Anxiety 190 (3.68%) 78 (4.22%) 1.15 (0.80–1.66) 0.437 0.79 (0.52–1.21)b 0.285
Quality of life and physical function
EQ-5D-3L score (0–1) 0.83 (0.25) 0.64 (0.36) 0.11 (0.08–0.17) 0.000 0.18 (0.11–0.31)b 0.000
HAQ score (0–3) 0.27 (0.46) 0.68 (0.81) 2.99 (2.47–3.62) 0.000 2.59 (2.04–3.29)b 0.000
healthcare resources consumption
Was hospitalized since last contact 498 (9.86%) 223 (15.91%) 1.73 (1.35–2.21) 0.000 1.57 (1.18–2.07)a 0.002
Went to medical appointments since last contact 3,796 (90.43%) 1,283 (92.40%) 1.29 (0.91–1.81) 0.148 1.11 (0.75–1.64)a 0.601
Went to medical appointments in hospitals since last contact 1,375 (36.17%) 636 (48.62%) 1.67 (1.31–2.13) 0.000 1.48 (1.12–1.94)a 0.005 Went to medical appointments in primary health care centers
since last contact
2,940 (81.65%) 1,119 (86.225) 1.41 (1.07–1.85) 0.015 1.27 (0.92–1.76)a 0.149
Number of medical appointments in public sector since last contact
2.87 (±3.48) 4.80 (±5.87) 1.11 (1.08–1.13) 0.000 1.07 (1.04–1.11)a 0.000
Number of medical appointments in private sector since last contact
1.27 (±3.77) 0.99 (±3.77) 0.97 (0.92–1.02) 0.217 1.00 (0.95–1.05)a 0.956
chronic disease management difficulties
Medication non-adherence due to economic constrains 168 (3.07%) 324 (18.67%) 7.26 (5.53–9.54) 0.000 5.13 (3.86–6.82)a 0.000
Reduction in visits to medical appointments due to economic constrains
223 (3.89%) 285 (16.99%) 5.06 (3.86–6.62) 0.000 4.23 (3.09–5.78)a 0.000
aAdjusted for age group, gender, educational level, employment status, and NUTS II.
bAdjusted for age group, gender, educational level, employment status, NUTS II, number of non-communicable, and diagnosis of rheumatic disease.
Sample size is not constant due to missing data.
Promoting food security—number of non-communicable diseases (n = 5,132); high blood pressure (n = 5,404); diabetes (n = 5,454); high cholesterol level (n = 5,364); pulmonary disease (n = 5,480); cardiac disease (n = 5,451); gastrointestinal disease (n = 5,465); neoplastic disease (n = 45,485); hyperuricemia (n = 5,464); depression symptoms (n = 5,430); anxiety symptoms (n = 5,430); rheumatic disease (n = 5,519); was hospitalized since last contact (n = 5,530); went to medical appointments since last contact (n = 5,079); went to medical appointments in hospitals since last contact (n = 4,869); went to medical appointments in primary health-care centers since last contact (n = 4,874); medication reduction due to economic constrains (n = 5,517); doctor visits reduction due to economic constrains (n = 5,525).
Food secure—number of non-communicable diseases (n = 3,878); high blood pressure (n = 4,053); diabetes (n = 4,096); high cholesterol level (n = 4,027); pulmonary disease (n = 4,112); cardiac disease (n = 4,102); gastrointestinal disease (n = 4,110); neoplastic disease (n = 4,116); hyperuricemia (n = 4,097); depression symptoms (n = 4,070); anxiety symptoms (n = 4,070); rheumatic disease (n = 4,140); was hospitalized since last contact (n = 4,150); went to medical appointments since last contact (n = 3,796); went to medical appointments in hospitals since last contact (n = 3,565); went to medical appointments in primary health-care centers since last contact (n = 3,565); medication reduction due to economic constrains (n = 4,142); doctor visits reduction due to economic constrains (n = 4,147).
Food insecure—number of non-communicable diseases (n = 1,254); high blood pressure (n = 1,351); diabetes (n = 1,358); high cholesterol level (n = 1,337); pulmonary disease (n = 1,368); cardiac disease (n = 1,349); gastrointestinal disease (n = 1,355); neoplastic disease (n = 1,369); hyperuricemia (n = 1,367); depression symptoms (n = 1,360); anxiety symptoms (n = 1,360); rheumatic disease (n = 1,379); was hospitalized since last contact (n = 1,380); went to medical appointments since last contact (n = 1,283); went to medical appointments in hospitals since last contact (n = 1,304); went to medical appointments in primary health-care centers since last contact (n = 1,309); medication reduction due to economic constrains (n = 1,375); doctor visits reduction due to economic constrains (n = 1,378).
these studies should be made carefully due to the different meth-odological approaches in terms of sampling method and food insecurity measurement instrument (24, 25). Nevertheless, our study showed a markedly higher prevalence of food insecurity that cannot be explained solely by methodological differences and might suggest an increasing trend in the prevalence of food insecurity during the last 10 years.
Food insecurity was significantly associated with low adher-ence to the MD. Lower levels of MD adheradher-ence were also found among the lower socioeconomic groups in previous studies (26). Food insecurity has been associated with unhealthy dietary
as determinants of obesity and appear to be more common among the lower socioeconomic groups (30, 31).
We have examined the impact of food insecurity on health and health-related issues and found that subjects with food insecurity reported worse HRQoL and more physical disability when compared to subjects without food insecurity. A higher proportion of subjects with food insecurity were found to have diabetes and rheumatic diseases than those with food security. In fact, our results agree with those from other countries that found strong evidence that vulnerable people, who commonly live in food insecure conditions, have a higher risk of poor health (32, 33). Studies have found that socioeconomically vulnerable groups experience higher mortality and morbidity rates for coronary heart disease (34), atherosclerosis, type 2 diabetes mellitus (35), and some cancers (36). Our study also revealed that a high proportion of subjects with food insecurity reported mental illness in the form of self-reported depression symptoms. The consequences of food insecurity in mental health, namely anxiety and depression symptoms, are well-documented in the literature (37). The causal mechanism is not clear and may be bidirectional. Individuals with food insecurity more often reported difficulties in chronic disease management because they experience more frequent non-adherence to medication and reduced medical appointments due to economic constraints. These difficulties in chronic disease management worsen their health status and decrease disease control. In line with our findings, Berkowitz et al. found that food insecurity is strongly associated with medica-tion underuse (38). The present study also showed that food insecurity was associated with a higher proportion of hospitali-zations and clinical appointments, stressing that poor disease control in subjects of food insecurity leads to higher health resource consumption. Tarasuk et al. showed that household food insecurity is a predictor of healthcare utilization and cost in Canada (39).
Food insecurity requires improved collaboration between social protection policies and food and nutrition national poli-cies. Social protection policies, particularly in times of economic crises, are important to ensure adequate socioeconomic condi-tions for the most vulnerable. Of particular concern for these individuals is the access to healthy food. Food and nutrition national policies should address food insecurity questions in their action plans. This could be accomplished by ensuring that food aid programs are providing healthy food baskets for low-income individuals and empowering these vulnerable individuals for healthy eating. Several countries, especially European countries, fail in their food aid programs due to a low capacity to provide nutritionally adequate foods (40). Toward this end, Portugal has recently developed and implemented a new food aid program for low-income households, which considers the nutritional and food recommendations for healthy eating (41).
Our study has some limitations. Due to the cross-sectional nature of the data, it is not possible to establish causal asso-ciations between food insecurity and diet and health outcomes. Food insecurity was assessed based on individual self-percep-tion, and the tool used does not allow us to identify how food insecurity differently affects each member of the household. Several strengths should also be pointed out. Data came from a large, nationally representative sample of the adult population who have been followed since 2011. This study design captured different health and health-related measurements that provided relevant information about determinants and consequences of food insecurity.
In conclusion, this study provided strong evidence that food insecurity is a public health problem that is be associ-ated with a lower adherence to a healthy dietary pattern (MD) and to a higher risk for chronic diseases and poor disease control. Food insecurity leads to more health resource con-sumption and hospitalization. Data from this study provide valuable information to increase awareness of the food insecurity problem in southern European countries facing an economic crisis. It also provides a strong argument to encourage policymakers to increase the resources allocated to reduce social inequalities and poverty. The implementa-tion of inter-sectoral policies addressing food insecurity is an urgently needed strategy to reduce the burden of diet-related non-communicable diseases.
eThics sTaTeMenT
Details of ethical issues of EpiDoC cohort were described else-where [Rodrigues et al. (9)]. EpiDoC 3 study was performed according to the principles established by the Declaration of Helsinki (World Medical Association, 2013) revised in 2013 in Fortaleza. The study was reviewed and approved by the National Committee for Data Protection and by the NOVA Medical School Ethics Committee [Rodrigues et al. (9)].
aUThOr cOnTriBUTiOns
MG and AR contributed equally to this work. HC, AR, and MG designed the study. AR and MG analyzed and interpreted the data and wrote the paper. JB, PG, RS, SD, and HC gave scientific support and revised the manuscript. All authors discussed the results and implications and commented on the manuscript at all stages.
FUnDing
The present project was granted by the Public Health Initiatives Programme (PT06) and financed by the EEA Grants Financial Mechanism 2009–2014.
reFerences
1. Food and Agriculture Organization of the United Nations. The State of Food Insecurity in the World 2001. Rome: Food and Agriculture Organization of the United Nations (2002).
2. Hanson KL, Connor LM. Food insecurity and dietary quality in US adults and children: a systematic review. Am J Clin Nutr (2014) 100(2):684–92. doi:10.3945/ajcn.114.084525
adults. J Acad Nutr Diet (2014) 114:1943–53. doi:10.1016/j.jand.2014. 06.353
4. Vandentorren S, Le Mener E, Oppenchaim N, Arnaud A, Jangal C, Caum C, et al. Characteristics and health of homeless families: the ENFAMS survey in the Paris region, France 2013. Eur J Public Health (2016) 26(1):71–6. doi:10.1093/eurpub/ckv187
5. Martinez-Gonzalez MA, Salas-Salvado J, Estruch R, Corella D, Fito M, Ros E, et al. Benefits of the Mediterranean diet: insights from the PREDIMED study.
Prog Cardiovasc Dis (2015) 58(1):50–60. doi:10.1016/j.pcad.2015.04.003 6. Guasch-Ferre M, Salas-Salvado J, Ros E, Estruch R, Corella D, Fito M, et al.
The PREDIMED trial, Mediterranean diet and health outcomes: how strong is the evidence? Nutr Metab Cardiovasc Dis (2017) 27(7):624–32. doi:10.1016/ j.numecd.2017.05.004
7. Bonaccio M, Di Castelnuovo A, Bonanni A, Costanzo S, De Lucia F, Persichillo M, et al. Decline of the Mediterranean diet at a time of economic crisis. Results from the Moli-sani study. Nutr Metab Cardiovasc Dis (2014) 24(8):853–60. doi:10.1016/j.numecd.2014.02.014
8. Bonaccio M, Bes-Rastrollo M, de Gaetano G, Iacoviello L. Challenges to the Mediterranean diet at a time of economic crisis. Nutr Metab Cardiovasc Dis
(2016) 26(12):1057–63. doi:10.1016/j.numecd.2016.07.005
9. Rodrigues AM, Gouveia N, da Costa LP, Eusebio M, Ramiro S, Machado P, et al. EpiReumaPt – the study of rheumatic and musculoskeletal diseases in Portugal: a detailed view of the methodology. Acta Reumatol Port (2015) 40(2):110–24. 10. Ramiro S, Canhao H, Branco JC. EpiReumaPt protocol – Portuguese
epidemiologic study of the rheumatic diseases. Acta Reumatol Port (2010) 35(3):384–90.
11. Laires PA, Canhão H, Araújo D, Fonseca JE, Machado P, Mourão AF, et al. CoReumaPt protocol: the Portuguese cohort of rheumatic diseases. Acta Reumatol Port (2012) 37:18–24.
12. Ferreira LN, Ferreira PL, Pereira LN, Oppe M. EQ-5D Portuguese population norms. Qual Life Res (2014) 23(2):425–30. doi:10.1007/s11136-013-0488-4 13. Ferreira LN, Ferreira PL, Pereira LN, Oppe M. The valuation of the EQ-5D in
Portugal. Qual Life Res (2014) 23(2):413–23. doi:10.1007/s11136-013-0448-z 14. Fries JF, Spitz P, Kraines RG, Holman HR. Measurement of patient outcome
in arthritis. Arthritis Rheum (1980) 23(2):137–45. doi:10.1002/art.1780230202 15. World Health Organization. Physical Status: The Use and Interpretation of
Anthropometry Report of a WHO Expert Committee. WHO Technical Report.
Geneva: World Health Organization (1995). Series 854.
16. Schroder H, Fito M, Estruch R, Martinez-Gonzalez MA, Corella D, Salas-Salvado J, et al. A short screener is valid for assessing Mediterranean diet adherence among older Spanish men and women. J Nutr (2011) 141(6): 1140–5. doi:10.3945/jn.110.135566
17. Gregório MJ, Nogueira PJ, Graça P. The first validation of the household food insecurity scale in a sample of the Portuguese population. In: Gregório MJ, editor. Desigualdades Sociais No Acesso a uma Alimentação Saudável:
um Estudo na População Portuguesa. Ph.D., Faculty of Nutrition and Food
Sciences of University of Porto (2014).
18. Gregório MJ, Graça P, Nogueira PJ, Gomes S, Santos CA, Boavida J. Proposta metodológica para a avaliação da insegurança alimentar em Portugal.
Revista Nutrícias (2012) 21:4–11.
19. Gregório MJ, Graça P, Costa A, Nogueira PJ. Time and regional perspective of food insecurity during the economic crisis in Portugal, 2011–2013. Saúde e
Sociedade (2014) 23(4):13–27. doi:10.1590/S0104-12902014000400001
20. World Medical Association. World Medical Association Declaration of Helsinki: ethical principles for medical research involving human subjects.
JAMA (2013)310(20):2191-4. doi:10.1001/jama.2013.281053
21. Tarasuk V, Mitchell A, Dachmer N. Household Food Insecurity in Canada 2014. Research to identify policy options to reduce food insecurity. Toronto: PROOF Food Insecurity Policy Research (2016). Available from: http://proof. utoronto.ca/
22. Coleman-Jensen A, Nord M, Andrews M, Carlson S. Household Food Security in the United States in 2011 (No ERR-141). U.S. Department of Agriculture, Economic Research Service (2012).
23. Kim TJ, von dem Knesebeck O. Is an insecure job better for health than having no job at all? A systematic review of studies investigating the health- related risks of both job insecurity and unemployment. BMC Public Health
(2015) 15:985. doi:10.1186/s12889-015-2313-1
24. Branco MJ, Nunes B, Cantreiras T. Uma Observação sobre “Insegurança Alimentar”. Lisboa: Instituto Nacional de Saúde Dr Ricardo Jorge (2003). 25. Álvares L, Amaral TF. Food insecurity and associated factors in the Portuguese
pop-ulation. Food Nutr Bull (2014) 35(4):395–402. doi:10.1177/156482651403500401 26. Bonaccio M, Donati M, Iacoviello L, Gaetano GD. Socioeconomic deter-minants of the adherence to the Mediterranean diet at a time of economic crisis: the experience of the MOLI-SANI study. Agric Agric Sci Procedia (2016) 8:741–7. doi:10.1016/j.aaspro.2016.02.059
27. Sobal J, Stunkard AJ. Socioeconomic status and obesity: a review of the literature. Psychol Bull (1989) 105:260–75. doi:10.1037/0033-2909.105.2.260 28. Dinour LM, Bergen D, Yeh MC. The food insecurity-obesity paradox: a review
of the literature and the role food stamps may play. J Am Diet Assoc (2007) 107(11):1952–61. doi:10.1016/j.jada.2007.08.006
29. Robertson A, Lobstein T, Knais C. Obesity and socio-economic groups in Europe: evidence review and implications for action. Brussels: European Commission (2007). Available from: http://ec.europa.eu/health/ph_determinants/life_style/ nutrition/documents/ev20081028_rep_en.pdf
30. Darmon N, Drewnowski A. Does social class predict diet quality? Am J Clin Nutr (2008) 87:1107–17.
31. Drewnowski A. Obesity, diets, and social inequalities. Nutr Rev (2009) 67(1):S36–9. doi:10.1111/j.1753-4887.2009.00157.x
32. Stuff JE, Casey PH, Szeto KL, Gossett JM, Robbins JM, Simpson PM, et al. Household food insecurity is associated with adult health status. J Nutr (2004) 134(9):2330–5. doi:10.1093/jn/134.9.2330
33. Mackenbach JP, Stirbu I, Roskam A-JR, Schaap MM, Menvielle G, Leinsalu M, et al. Socioeconomic inequalities in health in 22 European countries. N Engl
J Med (2008) 358:2468–81. doi:10.1056/NEJMsa0707519
34. Rooks RN, Simonsick EM, Miles T, Newman A, Kritchevsky SB, Schulz R, et al. The association of race and socioeconomic status with cardiovascular disease indicators among older adults in the health, aging and body compo-sition study. J Gerontol B Psychol Sci Soc Sci (2002) 57:S247–56. doi:10.1093/ geronb/57.4.S247
35. Everson SA, Maty SC, Lynch JW, Kaplan GA. Epidemiologic evidence for the relation between socioeconomic status and depression, obesity, and diabetes.
J Psychosom Res (2002) 53:891–816. doi:10.1016/S0022-3999(02)00303-3
36. Ward E, Jemal A, Cokkinides V, Singh GK, Cardinez C, Ghafoor A, et al. Cancer disparities by race/ethnicity and socioeconomic status. Cancer J Clin
(2004) 54:78–93. doi:10.3322/canjclin.54.2.78
37. Leung CW, Epel ES, Willett WC, Rimm EB, Laraia BA. Household food insecurity is positively associated with depression among low-income supplemental nutrition assistance program participants and income-eligible nonparticipants. J Nutr (2015) 145(3):622–7. doi:10.3945/jn.114.199414 38. Berkowitz SA, Seligman HK, Choudhry NK. Treat or eat: food insecurity,
cost-related medication underuse, and unmet needs. Am J Med (2014) 127(4):303–10. doi:10.1016/j.amjmed.2014.01.002
39. Tarasuk V, Cheng J, Oliveira CD, Dachner N, Gundersen C, Kurdyak P. Association between household food insecurity and annual health care costs.
CMAJ (2015) 187(14):E429–36. doi:10.1503/cmaj.150234
40. Neter JE, Dijkstra SC, Dekkers ALM, Ocke MC, Visser M, Brouwer IA. Dutch food bank recipients have poorer dietary intakes than the general and low- socioeconomic status Dutch adult population. Eur J Nutr (2017). doi:10.1007/ s00394-017-1540-x
41. Gregório MJ, Tavares C, Cruz D, Graça P. Programa de Distribuição de Alimentos: Considerações para a adequação nutricional da oferta alimentar (Food Distribution Program: Considerations for the Nutritional Adequacy of the Food Offer). Lisbon: Directorate-General of Health (2017).
Conflict of Interest Statement: The authors declare that the research was conducted in the absence of any commercial or financial relationships that could be construed as a potential conflict of interest.