Investment Analysis Project
Petrofac Ltd.Yani Wang
Dissertation written under the supervision of Dr. Antonios
Kassanis
Dissertation submitted in partial fulfilment of requirements for the
MSc in International Finance, at Universidade Católica Portuguesa
and for the MSc in Investment Analysis, at Aston Business School, 31
Abstract
My dissertation is an analysis for Petrofac which is a leading service provider to the oil and gas production and processing industry. The aim of this dissertation is to value the company and give a BUY or SELL or HOLD recommendation. The dissertation starts with a company overview, and I analyze it from the overall economics, industry and the Petrofac’s financial statement. The projection is based on the macroeconomics, industry and the Petrofac’s development goal. The valuation in the final part is based on the projection by using Discount Dividend Model, Discount Cash Model and Abnormal Earnings Model. The final conclusion of the share price is given as BUY.
Title: Investment Analysis Project for Petrofac Ltd. Author: Yani Wang
Keywords: Petrofac; Share Price Valuation; Oil and Gas; DDM; DCM; AEM
Resumo
A minha dissertação consiste numa análise para a Petrofac, empresa líder no fornecimento para a produção de petróleo e gás. O principal objectivo desta dissertação é avaliar a firma mencionada e emitir uma recomendação de BUY, SELL ou HOLD. Começarei por dar uma visão geral e analisar de forma global a indústria, a empresa ao nível financeiro e operacional. A projeção é baseada em factores macroeconômicos, industriais e nos objectivos de desenvolvimento da Petrofac’s. A avaliação apresentada na parte final é efectuada através do Dividend Discount Model, Discount Cash Model e Abnromal Earns Model. A conclusão final dada o preço actual da ação é BUY.
Título: Projeto de Análise de Investimentos da Petrofac Ltd. Autor: Yani Wang
Acknowledgement
I would like to present my special thanks to all those who provided me the possibility to complete this project. A special gratitude I give my supervisor and course director, Dr. Antonios Kassanis, whose contribution in stimulating suggestions and encouragement.
Furthermore, I would also like to acknowledge with much appreciation the crucial role of the staff of Olumide Popoola, who is my pre-sessional course tutor, who helped me in my writing and gave some useful suggestions.
Last but not least, I would like to pay special thankfulness to my mother and father, my family and friends, they not only assisted me financially but also extended their support morally and emotionally.
Contents
Investment Analysis Project ... 1
Abstract ... 1 Resumo ... 1 Acknowledgement ... 1 Company Overview ... 8 1.1 Company Background ... 8 1.2 Company Operations ... 8
1.3 Corporate Governance and Shareholders ... 9
1.4 Peers ... 13 1.5 Market Sectors ... 14 1.6 News ... 16 2 Economic Analysis ... 19 2.1 General Economic ... 19 2.2 Major Economy ... 20 2.3 Other indicators ... 24 3 Industry Analysis ... 27
3.1 Porter’s Five Force Model ... 27
3.1.1 Bargaining Power of Buyers ... 27
3.1.2 Bargaining Power of Suppliers ... 27
3.1.3 Threat of New Entrants ... 28
3.1.4 Threat of Substitutes ... 29
3.1.5 Competitive Rivalry ... 30
3.1.6 Summary of porter’s five model ... 31
3.2 SWOT Analysis ... 32
3.2.1 Strength ... 32
3.2.2 Weakness ... 33
3.2.3 Opportunities ... 33
3.2.4 Threats ... 33
3.3 Industry Life Cycle & Macro Economics ... 34
4 Risk and Return ... 38
4.1 Return ... 39
4.1.1 FTSE 250 (Market) Return ... 39
4.1.2 Petrofac Return ... 40
4.1.3 Conclusion ... 41
4.2 Beta and correlation ... 42
5 Capital Structure ... 47
6 Dividend Policy ... 51
7 Ratio Analysis ... 53
7.1 P/E Ratio & Others ... 53
7.2 DuPont Analysis ... 57
7.3 EV/Financial Metrics ... 58
8 Projection ... 61
8.1 Macroeconomic & Industry ... 61
8.2 Firm Specific ... 62
9 Valuation ... 66
9.1 Discounted Dividend Model ... 66
9.2 Discounted Cash Flow Model ... 67
9.3 Abnormal Earnings Model ... 69
Recommendation ... 71
Reference ... 74
Appendixes ... 77
Appendix 1: Petrofac Income Statement ... 77
Appendix 2: Petrofac Balance Sheet ... 77
Appendix 3: Petrofac Cash Flow Statement ... 78
Appendix 4: Credit Rating... 80
Appendix 5: Discounted Dividend Model ... 80
Appendix6: Discounted Free Cash Flow Model ... 81
List of Tables
Table 1 Geographical Revenues - taken from Petrofac Annual Report 2016 ... 8Table 2 Segments Revenues - taken from Petrofac Annual Report 2016 ... 9
Table 4 Major Shareholders - taken from Petrofac Annual Report 2016 ... 12
Table 5Performance, taken from Thomson Reuters ... 14
Table 6 Correlation with Gas and Oil ... 37
Table 7 Cumulative Performance ... 38
Table 8 Yearly Performance ... 38
Table 9 FTSE 250 Return ... 39
Table 10 Petrofac Return ... 40
Table 11 5-year Return FTSE vs. Petrofac ... 41
Table 12Beta Components ... 42
Table 13 Cost of Debt ... 47
Table 14 WACC ... 48
Table 16 Leverage & Liquidity ... 49
Table 17 Dividend ... 51
Table 18 Petrofac P/E & Other Ratios ... 53
Table 19 Amec Foster Wheeler P/E & Other Ratios ... 53
Table 20 Hunting P/E & Other Ratios ... 53
Table 21 John Wood Group P/E & Other Ratios ... 54
Table 22 FTSE250 P/E & Other Ratios ... 54
Table 23 FTASX0570 P/E & Other Ratios ... 54
Table 24 Current P/E Comparison ... 55
Table 25 DuPont Analysis ... 57
Table 26 Petrofac EV ... 58
Table 27 Amec Foster Wheeler EV... 58
Table 28 Hunting EV ... 59
Table 29 John Wood Group EV ... 59
Table 30 FTSE250 EV ... 59
Table 31 FTASX0570 EV ... 59
Table 32 Real GDP Projection ... 61
Table 33 Oil Price Projection ... 61
Table 34 NP Margin Projection ... 62
Table 35 Dividend Projection ... 63
Table 36 Revenue Projection ... 63
Table 37 Debt Projection ... 64
Table 38 Assets Projection ... 65
Table 39 Discounted Dividend Model ... 66
Table 41 Abnormal Earnings Model ... 69
Table 42 Key Data ... 73
Table 43 Forecast from other analysts... 73
List of Figures
Figure 1 Share Price News Impact ... 17Figure 2 Downside Risks to Global Growth Forecasts ... 20
Figure 3 U.S. & China GDP in Constant US$ Dollar ... 21
Figure 4 U.S. and CHINA GDP based on PPP ... 21
Figure 5 U.S. Percent of world GDP ... 22
Figure 6 Trade Balance of U.S. ... 23
Figure 7 The Import Origins OF U.S. ... 23
Figure 8 World – Allocated Reserves by Currency for 2016Q4 ... 24
Figure 9 Porter’s Five Model Result ... 31
Figure 10 Oil and Gas and Sector Real Price Monthly ... 34
Figure 11 Correlation Sector & Gas ... 37
Figure 12 Correlation Sector & Oil ... 37
Figure 13 FTSE 250 Return ... 40
Figure 14 FTSE250 frequency of 5-year monthly return ... 40
Figure 15 Petrofac Return ... 41
Figure 16 Petrofac frequency of 5-year monthly return ... 41
Figure 17 Re-Based Price ... 42
Figure 18 Correlation FTSE250 & Petrofac ... 43
Figure 19 SML & Actual Return ... 46
Figure 20 Debt-Equity ... 48
Figure 21 P/E ratio ... 55
Figure 22 Performance – PFC; WG; SECTOR ... 56
Figure 23 Performance – AMFW; FTG; MARKET ... 56
8
Company Overview
1.1 Company BackgroundPetrofac is a leading service provider to the oil and gas production and processing industry and a FTSE 250 company with a 36-year track record.
Building trust with long-term clients helped to established a leading position with $320millions Net Profit in 2016 ($9millions in 2015). Petrofac employs 13,500 persons worldwide. Through the
oil and gas life cycle, the company assists clients to transform the value of their assets. Their services are divided into three parts: design and build oil and gas infrastructure; operate, maintain and manage assets; and train personnel.
1.2 Company Operations
Petrofac comprises oil and gas production and processing, their projects span over 29 countries, which are located in Middle East, Africa, Europe, Americas, Asia Pacific, India and CIS. Including seven operational centers in Sharjah, Abu Dhabi, Chennai, Mumbai, Aberdeen, Woking and Kuala Lumpur; 24 offices and a number of training facilities.
KUWAIT US$M OMAN US$M UNITED ARAB EMIRATES US$M UNITED KINGDOM US$M SAUDI ARABIA US$M ALGERIA US$M MALAYSIA US$M OTHER COUNTRIES US$M CONSOLIDATED US$M 2015 2,185 1,477 1,326 668 798 463 357 599 7,873 2016 555 1,408 1,395 804 332 833 520 997 6,844
Table 1 Geographical Revenues - taken from Petrofac Annual Report 2016
In 1981, Petrofac was established in Tyler, Texas, USA with 25 staffs. After 10 years, Petrofac became a Multinational Corporation with an operational center in Sharjah, United Arab Emirates. In the following years, Petrofac expanded their business globally and was awarded a lot of projects in different regions. Table 1 presents the disclosed revenues with major income from the Middle East (Oman US$1,408 million, United Arab Emirates US$1,395 million).
Company name Petrofac
Address 4London United Kingdom th floor, 117 Jermyn Street, SW1Y 6HH
TEL +44 20 7811 4900 +44 20 7811 4901 Website https://www.petrofac.com Ticker PFC Exchange LSE Revenue $7.9 billion Backlog $14.3 billion
Net Profit $320 million
Employees 13,500
9 ENGINEERING& CONSTRUCTION US$M ENGINEERING& PRODUCTION SERVICES US$M INTEGRATED ENERGY SERVICES US$M CORPORATE & OTHERS US$M CONSOLIDATION ADJUSTMENTS& ELIMINATIONS US$M BUSINESS PERFORM ANCE US$M EXCEPTIONAL ITEMS AND CERTAIN RE-MEASUREMENTS US$M TOTAL US$M 2015 4,821 1,739 379 - (95) 6,844 - 6,844 2016 5,928 1,725 271 - (51) 7,873 - 7,873
Table 2 Segments Revenues - taken from Petrofac Annual Report 2016
In order to fit the new group organizational structure, the reporting segments have been rearranged to: Engineering & Construction, Engineering & Production Services and Integrated Energy Services. The trading results are monitored separately to assess their performance and decide the resource allocation. As we can see from the Table 2, the major revenues arose from the Engineering & Construction segment (2016: US$5,928 million)
Image taken from: https://www.petrofac.com/en-gb/about-us/where-we-operate/
1. Abu Dhabi – SARB3 field development project which worth US$0.5 billion
2. Algeria – In Salah southern fields development project which is an important milestone 3. Iraq – Badra field development which have been completed successfully
4. Kuwait – Lower Fars heavy oil development project which worth US$ 4 billion
1.3 Corporate Governance and Shareholders
Rijnhard van Tets 2014 Non-Executive Chairman
Chairman of Nominations Committee
10
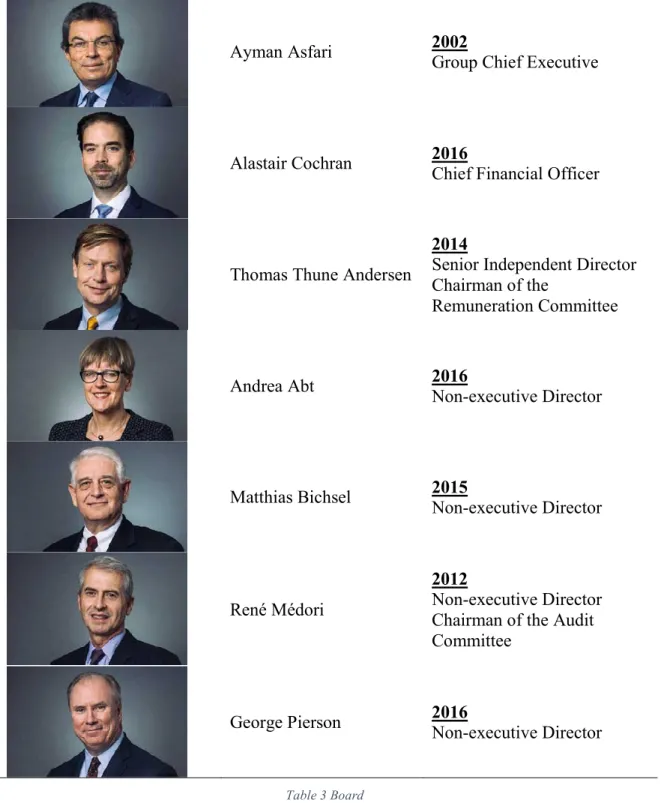
Table 3 Board
The board is the core of the corporate governance, the effectiveness of the board impacts the business performance and the equity of shareholders. The board of Petrofac will be analyzed from 5 different factors as following.
Ayman Asfari 2002
Group Chief Executive
Alastair Cochran 2016 Chief Financial Officer
Thomas Thune Andersen
2014
Senior Independent Director Chairman of the
Remuneration Committee
Andrea Abt 2016 Non-executive Director
Matthias Bichsel 2015 Non-executive Director
René Médori
2012
Non-executive Director Chairman of the Audit Committee
11 The first factor is the size of board, Lipton and Lorsch (1992) put forward that the lack of meaningful discussions because of the size of board, which should be limited with a maximum of 10 members. However, if the size of the board is too small, it will limit the viewpoints. Conversely, the members in a big size board have difficulties to communicate with each other in a limited time. The board of Petrofac consists of a non-executive chairman, group chief executive, chief operating officer, chief financial officer, senior independent director and four non-executive directors. This 8-member board allows directors to know each other well and have effective meetings.
The second factor is the frequency of meetings. The strategy making, supervision of management and other relative activities from the board are through board meetings. According to Korn and Ferry’s survey (1992), the directors would be expected to spend at least 94 hours on board-related business. In Petrofac, besides six scheduled face-to-face meetings, the board also communicates via telephone conferences. Additionally, face-to-face meeting were held in the form of a two-day conference. Lipton and Lorsch (1992) also suggest additional meetings resulting in salutary effects.
Image taken from: Petrofac Annual Report 2016
Third, the separation of management and control can help to improve the problem of power, when everything is concentrated on the chairman or CEO. The chairman of Petrofac (Rijnhard van Tets) is responsible for leading the board and ensuring the effective board governance and represents the shareholders’ equity. The CEO of Petrofac is Ayman Asfari, who is responsible for leading and motivating management team. In addition, Ayman Asfari is the major shareholder with 62,958,426 shares (18.2%, Table 4). Therefore, Ayman as a major shareholder and the CEO, has the same goal with the chairman to improve the business performance and maximize the equity of shareholders.
12 NUMBER OF ORDINARY SHARES PERCANTAGE OF ISSUED SHARE AYMAN ASFARI AND FAMILY 62,958,426 18.2% MAROUN SEMAAN AND FAMILY 18,034,399 5.2%
Table 4 Major Shareholders - taken from Petrofac Annual Report 2016
Fourth, the intensive plan for the board is an effective way to improve business performance. The major shareholders can focus on the long-term development, and avoid the short-term decision. The intensive plans are divided into cash and shares. Petrofac has Annual Bonus and Performance Share Plans. The award from Annual Bonus is based on the performance in the relevant financial year, which can be up to 200% of the basic salary. The Performance Share Plan strengthens Executive Directors’ performance over the long-run and usually rewards conditional shares. This is in line with the target about the long-term strategy of company and alignment with long-run shareholder value.
Finally, the role of the Independent Director will be analyzed. According to NASDAQ Rule 4200 a(15): “Independent Director means a person other than an executive officer or employee of the company or any other individual having a relationship which, in the opinion of the issuer's board of directors, would interfere with the exercise of independent judgment in carrying out the responsibilities of a director” (Security and Exchange Commission, 2017). Thomas Thune Andersen has extensive international experience with well-established knowledge of the energy industry and the market. Andrea Abt, René Médori and George Pierson are non-executive Independent Director of the company. While Andrea has a good understand in sales, finance, procurement and logistics; René has a wide-ranging international financial experience with strong background in governance, operational and strategic management. George is a lawyer and engineer with strong background in risk management, contracting, construction law, compliance and cost efficiency. As the results from Dahya & McConnel’s study indicate that there is a significant positive correlation between the representation of independent director and the board decision. The four Independent Directors are specialists in finance, law, management respectively, therefore, they can provide advices from different areas, which can lead to an improvement in business performance and ensures that no single individual can dominate the decision-making process.
13 Petrofac issued 345,912,747 ordinary shares, which are quoted on the London Stock Exchange. According to the Annual Report 2016, the major shareholders with shares greater than 5% voting rights are Ayman Asfari and Maroun Semaan.
Petrofac shareholdings are composed of 33% retail and institutional 67%. The major regions of shareholders are from the UK, U.S. and Canada.
Petrofac believes that useful and accessible engagement is the cornerstone to interact with shareholders. The Investor Relations team will schedule meetings with existing and potential shareholders, analysts and investors. This meeting consists of presentations and question & answer sessions. For some people who cannot attend, the presentations are streamed by internet.
Image taken from: Petrofac Annual Report 2016
1.4 Peers
There are many competitors of Petrofac in the oil and gas market. The major competitors of Petrofac are Amec Foster Wheeler (AMFW), Hunting (HTG) and John Wood Group (WG). The reason why I choose these companies is that they are operating within the FTSE250 with similar business activities.
Amec Foster Wheeler is an international company focused on the Oil, Gas & Chemicals, Mining, Power & Process and Environment & Infrastructure market with more than 160 years of history. Their business expands to 55 countries, employs around 35,000 staff throughout their global operations.
14 Hunting is an international company which provides oil and gas services worldwide. They established in 1874 and provide their energy service to 13 countries through a workforce of 2,107 employees. A unique feature of Hunting are the 428 patents (2016).
John Wood Group provides energy service, products and support for oil and gas industry, they started their business in Scotland in 1912. Their operations exceed 40 countries employing more than 8,000 staff in total.
Performance of Petrofac’s competitors shown as below:
Identifier Company Name
EV / Revenue (SmartEstimate ®) (NTM) EV / EBITDA (SmartEstimate ®) (NTM) Price / EPS (SmartEstimate ®) (NTM) Price / Revenue (SmartEstimate ®) (NTM) PFC.L Petrofac Ltd 0.37 3.65 5.60 0.27
SPMI.MI Saipem SpA 0.54 5.05 16.85 0.37
SUBC.OL Subsea 7 SA 0.94 4.16 15.52 1.20
AMFW.L Amec Foster Wheeler PLC 0.61 9.92 10.09 0.39
WG.L John Wood Group PLC 0.69 9.09 14.17 0.62
HTG.L Hunting PLC 1.49 14.84 56.84 1.46
AKSOL.OL Aker Solutions ASA 0.55 8.41 46.16 0.48
FTI.PA TechnipFMC PLC 0.64 5.54 16.63 0.87
Identifier Company Name
Price / Cash Flow Per Share (SmartEstimate ®) (NTM)
Price / Book Value Per Share (SmartEstimate ®) (NTM)
Dividend Per Share Yield % (SmartEstimate®) (NTM)
PFC.L Petrofac Ltd 4.09 1.36 9.2%
SPMI.MI Saipem SpA 5.86 0.64 0.9%
SUBC.OL Subsea 7 SA 7.86 0.75 3.6%
AMFW.L Amec Foster Wheeler PLC 10.68 1.89 3.4%
WG.L John Wood Group PLC 9.38 1.39 4.1%
HTG.L Hunting PLC 20.42 0.96 0.5%
AKSOL.OL Aker Solutions ASA 20.57 1.52 0.5%
FTI.PA TechnipFMC PLC 16.81 1.00 1.4%
Table 5Performance, taken from Thomson Reuters
1.5 Market Sectors
From January 2016, Petrofac reorganize their Group structure. The three new reporting segments are listed below:
Engineering & Construction, E&C (Revenue: US$5,928m)
E&C provides onshore and offshore lump-sum engineering, procurement, construction, installation and commissioning services. Petrofac provides brownfield and greenfield developments with a 35-year history record. In December 2016, they received an order worth US$600 million. As a result, the revenue in E&C increased from US$4,821 million in 2015 to
15 US$5,928 million in 2016 stipulating a growth of 23%. In addition, the net profit significantly grew by 31,200%, compared to a loss of US$1 million in 2015.
Image taken from: Petrofac Annual Report 2016
Engineering & Production Services, EPS (Revenue: US$1,725m)
EPS delivers modified solutions for onshore and offshore products to clients across the asset life cycle. Moreover, EPS covers Engineering, Procurement and Construction Management (EPCm) service line, Duty Holder and Service Operator models, Integrated Specialist Services. Through these services, EPS is worth close to US$1.3 billion in 2016. The revenue for 2016 stayed nearly unchanged at US$1,725 million (US$1,739 million). However, the net profit increased by 91% from US$58 million (2015) to US$111 million (2016).
Image taken from: Petrofac Annual Report 2016
16 An integrated service is provided by IES for clients, which includes the greenfield and brownfield, energy infrastructure projects and investments. Under a range of commercial models Petrofac is able to meet client requirements. This service is composed of Production Enhancement Contracts (PECs), Risk Service Contracts (RSCs), and Traditional Equity Upstream Investment models. The lower production and the lower oil and gas prices brought a decline in revenue in 2016 combined with a net loss of US$42 million.
Image taken from: Petrofac Annual Report 2016 1.6 News
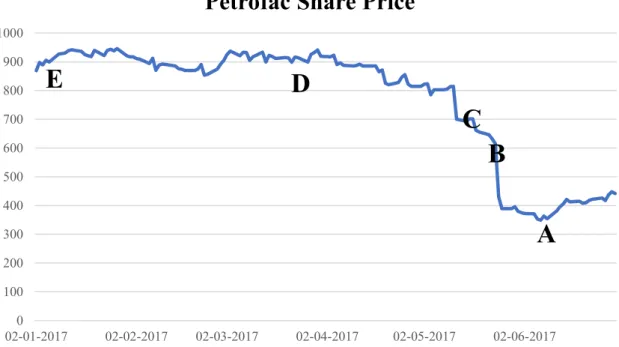
The impact of news announcements on the share price can be seen in the graph below. Good news positively influences the share price and vice versa. From Figure 1 we can see a negative impact of news announcements on the stock performance in 2017.
17
Figure 1 Share Price News Impact
A) 13 June 2017 – PETROFAC SECURES FIVE-YEAR TRAINING AGREEMENT WITH KUWAIT OIL COMPANY (KOC) (+13.83%)
The team of Petrofac’s EPS will undertake this work within Kuwait, improve the ability of operations and maintain personnel by developing KOC’s training program. The competency system of KOC will be updated to a new stage after this work.
B) 25th May 2017 – UPDATE ON SFO INVESTIGATION AND BOARD CHANGE
(-37.85%)
Petrofac announced the investigation by Serious Fraud Office (SFO), related to Unaoil and other agents. Ayman Asfari will continue in his role as Chief Executive Officer, Marwan Chedid has resigned from the Board in the meantime.
C) 18th May 2017 – BOARD CHANGE (-11.09%)
Petrofac announced that Jane Sadowsky has resigned as a Non-Executive Director with immediate effect. Ms Sadowsky has been a Board member since 1st November 2016. D) 28th March 2017 – Petrofac awarded US$1.3 billion project in Kuwait (+2.07%)
Petrofac has been awarded a contract from Kuwait Oil Company’s (KOC). This project is a lump-sum EPC project which worth close to US$1.3 billion. And the work will begin soon and is expected to be completed in mid of 2020.
E) 09th January 2017 – PETROFAC AWARDED OMAN GAS PROJECT (+3.97%) 0 100 200 300 400 500 600 700 800 900 1000 02-01-2017 02-02-2017 02-03-2017 02-04-2017 02-05-2017 02-06-2017
Petrofac Share Price
A
B
C
D
18 Salalah LPG SFZCO LLC (SLPG) is the wholly owned subsidiary of Oman Oil Facilities Development Company LLC (OOFDC), Petrofac has signed a contract worth close to US$600 million to undertake the EPC of Salalah LPG extraction project in the southern part of Oman.
19
2 Economic Analysis
As we can see from Section 1.2, Petrofac is a diverse company with business operations in the Middle East, Africa, Europe, Americas, Asia Pacific, India and CIS. The main corporate office is in London and the Middle East is their key operation region. The transaction currency of Petrofac is U.S. dollar, since the commodity is traded in this currency. The UK and Middle East economy will be discussed in this part as well as the U.S. economy.
2.1 General Economic
Real GDP Worldwide
Image taken from: World Bank
The global growth in terms of Real GDP is predicted to accelerate to 2.7% in 2017 and 2.9% in 2018-2019. As we can see from the Table above, the World Real GDP in 2016 anticipated to fall from 2.7% (2015) to 2.4% which is in line with the January 2017 projections. The advanced economic growth has decreased by 0.4% from 2.1% (2015) to 1.7% (2016) while the growth in EMDEs is projected to accelerate to 4.1% in 2017, up from 3.5% in 2016, before strengthening further to 4.5% and 4.7% in 2018-2019.
As predicted in January, the global activity is picking up and the global growth is expected to strengthen in 2017.
20
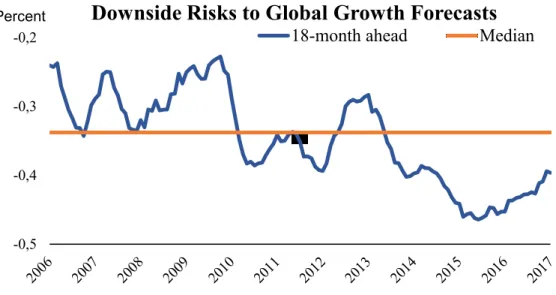
Figure 2 Downside Risks to Global Growth Forecasts
Sources from: Bloomberg, Consensus Economics, World Bank.
However, according to the world bank report, risk to the global outlook remain titled to the downside, which is caused by the increase in the uncertainty of advanced economic policy, elevated trade protectionism and the possibility of financial market disruptions. Those factors may cause a weaker potential global growth in the long-run.
2.2 Major Economy
The activities in major advanced economies could lead to stronger than expected impacts to the global outlook, notably in the U.S.
In the 19th century, the UK was the economic superpower in the world, its trading partners suffered indirect losses when it was involved in a financial crisis. Until the 20th century, the UK lost his position and the U.S. has become the largest economy measured by the nominal GDP ($16.58 trillion) which accounts for 24.68% of gross world product in 2016. Figure 4 shows that China performs better than the U.S. measured in terms of GDP based on PPP after 2013 – approximately $21,269 billion in China compared to $18,562 billion in the U.S.
-0,5 -0,4 -0,3 -0,2
Downside Risks to Global Growth Forecasts
18-month ahead Median
21
Figure 3 U.S. & China GDP in Constant US$ Dollar
Source from: the World Bank
Figure 4 U.S. and CHINA GDP based on PPP
Source from: the World Bank
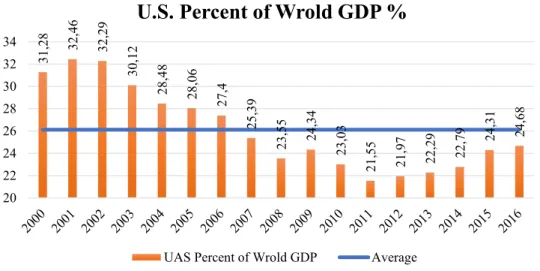
First of all, the U.S. has been the leader in the world economic development. The data in Figure 5 is provided from the World Bank from 2000 to 2016 and shows the percentages of the U.S. of the world GDP. The average value for U.S. during this period is around 26.12%. The minimum value is 21.55% in 2011 while the maximum is 32.46% in 2001. It indicates that the U.S. GDP is the major part of the global GDP. This means if the U.S. is hit by an economic slowdown world GDP will decrease significantly. This can be shown on the example of the Subprime Mortgage Crisis. A Subprime Mortgage is a type of mortgage which is issued by lending institutions to low credit borrowers. According to Amadeo (2017), this crisis started in the late 2006 and peaking in 2009. The main reason is banks sold too many mortgages to borrowers with low credit ratings, the falling home prices occurred with defaults. In the
0 5000 10000 15000 20000 25000 30000 B il li on s
US & CHINA GDP ($ billion)
China US 0 5 10 15 20 25 Tr il li on s
GDP based on PPP valuation ($ billion)
22 following years (2007-2008), banking crisis, financial crisis and the worst recession occurred due to Subprime Mortgage Crisis.
Figure 5 U.S. Percent of world GDP
Source from: the World Bank
Secondly, the U.S. implements the trade liberalization policy which leads to global integration. In addition, there is a board economic link between the U.S. and the rest of the world. According to the Economic Complexity Index (ECI), the United States is the 2nd largest export economy with $1.38T and largest importer with $2.16T in the world (see Figure 6). As a result, a negative impact from the U.S. economy can easily spread out to the world through the interactions in trade, financial, monetary, investment, confidence and policy channel. The main cause is the import and export trade. When the U.S. is experiencing a recession, there should be a receding in consumption of residents, the capital expenditure and production of companies, which leads to a reduce in imports about consumer goods, capital goods, intermediate product and raw materials. The imports of the U.S. are the exports of other countries. Therefore, a decrease in global trade will result in a global economic downturn.
31 ,2 8 32 ,4 6 32 ,2 9 30 ,1 2 28 ,4 8 28 ,0 6 27 ,4 25 ,3 9 23 ,5 5 24 ,3 4 23 ,0 3 21 ,5 5 21 ,9 7 22 ,2 9 22 ,7 9 24,3 1 24 ,6 8 20 22 24 26 28 30 32 34
U.S. Percent of Wrold GDP %
23
Figure 6 Trade Balance of U.S.
Source: The Observatory of Economic Complexity
According to Figure 7, it can be known that China is the top import origins of the U.S. with $457 Billion. The reduction of consumption from U.S. residents will directly affect the export of consumer goods from China to U.S. As a result, exporting Chinese companies will reduce their production and lay off employees.
Figure 7 The Import Origins OF U.S.
Source: The Observatory of Economic Complexity
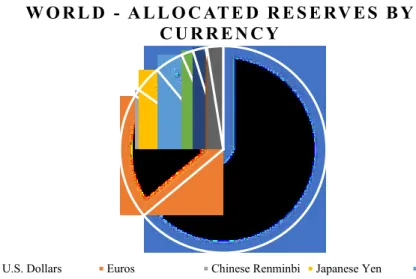
Third, the U.S. dollar is the benchmark pricing instrument for most commodities in international trade. Foreign traders purchase or sell goods with dollars. According to the data released by International Monetary Fund (IMF) in the end of March 2017, more than half (63.96%) of all known central bank foreign currency reserves were denominated in U.S. dollars. The following one is Euros, which makes up 19.74% of currency reserves (Figure 8).
0,4 0,6 0,81 1,2 1,4 1,6 1,82 2,2 T rilli on s
U.S. Trade Balance
Export Import
T H E I M P O RT O R I G I N S
CHN CAN MEX JPN DEU KOR GBR
IND ITA VNM XXB FRA IRL MYS
24
Figure 8 World – Allocated Reserves by Currency for 2016Q4
Source: International Monetary Fund
The reason why foreign holders prefer U.S. banknotes is because of the monetary stability. Goldberg (2010, p2-3) mentioned that the U.S. dollar stipulates an improved medium of exchange relative to their home currency. However, countries might suffer massive wealth destruction, because of the depreciation of the U.S. dollar and even might lead to a global deflation. The benefit derived by dollar weakness is the increase of export competitiveness of U.S., but it is bad news for the import origins of U.S. and the data mentioned before proved that the U.S. is a powerful importer. Their home currencies appreciated against U.S. dollar that means there will be a lower export competitiveness of their commodities due to the increasing price, which affect the development of economy in export countries directly.
2.3 Other indicators
Inflation
The inflation rate in February 2017 is around 2% within advanced economies, which is more than double the rate compared to 2016 (0.8%), with a revival within emerging market driven by the increase in fuel prices (IMF, 2017). The main reason behind this is that the increased oil price between August 2016 and February 2017, with growth rates up to 20%., caused by the production cut agreement from the OPEC. In most advanced economies, headline inflation remains below central bank targets and the core inflation has been stable. It has remained
W O R L D - A L L O C AT E D R E S E RV E S B Y C U R R E N C Y
U.S. Dollars Euros Chinese Renminbi Japanese Yen Pounds Sterling Australian Dollars Canadian Dollars Swiss Francs Other Currencies
25 broadly stable in emerging economies, whereas Brazil and Russia, experiencing a strong decline.
Labor Market
10 years after the global financial crisis, the OECD average employment rate reached pre-crisis levels in the Q1 of 2017 and the unemployment rate continues to improve. But unemployment is still a little higher compared to pre-crisis, which has resulted from the rising participation levels and cannot be offset by employment increasing (DECD, 2017). The real wage growth is slow, the unemployment rate still remains high for part-time jobs. All in all, the employment indicators are getting better but the whole labor market is still lagging behind.
Investment, Trade and demand
Investment and trade are picking up modestly, there are three signals showing the investment prospects are good: low policy uncertainties; the regulation will promote competition among investors; and the global demand is in uptrend (OECD, 2017). Because of the strong support from China, the global trade has rebound in the last year. Investment is suggested to be in a high-quality capital with advanced technology, which might improve the global investment chains, but requires the high efficient productivity and output. (World Bank, 2017)
Policy Uncertainty and Geopolitical Risks
At first, there is a change in the U.S., Trump brings a shock to the fiscal, trade, and immigration policies, which affects companies, investments and new hires. On the other side of the Atlantic, the Brexit brings risk to the European economy.
The geopolitical risks in the Middle East might come with a serious problem of oil and gas and refugee flows. The food and water shortages also contribute to risk. The reasons presented in this Section bring downside risk and heighten the uncertainty in the world economy.
Middle East and North Africa (MENA)
A sluggish economic growth in the Middle East and North Africa resulting from the oil production cuts and the fiscal consolidation in recent. Because the influence from the oil production cuts exceeds the bettering circumstances on oil importers, the MENA’s growth has been moderate around 3% during 2015-2016, and is projected to fall to 2.1% in 2017. But the growth is expected to increase to 2.9% in 2018, which based on the low geopolitical risk and an increasing oil price (World Bank, 2017). After 2017, the oil price is expected to pick up, the
26 fiscal consolidation is expected to eased, and several public investments (such as Dubai’s World Expo 2020) are ongoing (Callen et al. 2014). It can be told from these factors that the GDP growth will be remain low in the fiscal year of 2017 and increase thereafter.
Oil and Gas
Crude oil price rose 8% in Q1 2017 with the support of OPEC production cuts agreement, the gas prices increased 6% in the Q1 2017 on the stronger demand and production restrictions (World Bank, 2017). It should be mentioned that the main driver of the price fluctuation are the supply and demand dynamics. In the following years, the oil price is projected to increase as global supply will fail to satisfy the demand. In the other hand, weaker compliance concerning production cuts might affect the supply and demand balance again.
27
3 Industry Analysis
In the previous sections, the macro effects have been discussed. In this section, Porter’s Five Forces and SWOT analysis will be used to analyze the Oil and Gas Equipment and Services Sector. Then, I determine the current stage of Petrofac in industry life cycle as well as the macro and micro level of industry.
3.1 Porter’s Five Force Model
Porter’s Five Forces Model focuses on the industry analysis, which is based on the assumption that industries have boundaries. It is a microscopic analysis of the external environment, which indicates the average profit margins of a company in the industry. Therefore, it is a measurement of industry situation rather than the capacity of a company. Determining which market need to be analyzed is the first step. Petrofac is an international company, their projects span over 29 countries, so it will be analyzed in a worldwide scope.
3.1.1 Bargaining Power of Buyers
According to Athanasios Pitatzis (2017), there are different types of buyers – refineries, National Oil Companies (NOC), International Oil and Gas Companies, Distribution Companies, Traders and Countries (USA, China, Japan, etc.). But all of them are Oil & Gas Companies, therefore, the composition of the buyers is single. The business performance of Oil Equipment and Services Companies is closely tied to oil and gas companies. Most of the oil and gas companies require the strict market access and evaluation system. For these reasons, there is a strong bargaining power of buyers in oil equipment and services sector.
3.1.2 Bargaining Power of Suppliers
The global oil and gas chain can be divided into three parts: Upstream, Mid-Stream and Downstream. The whole chain includes designing, building, maintaining facilities; transporting, storing, processing oil and gas and refining.
28 Image taken from: Slideshare https://www.slideshare.net/theoacheampong/theo-acheampong-presentation
The suppliers in the Oil and Gas Equipment and Services Sector are the suppliers who provide the technology and the equipment. There are a large number of the suppliers worldwide who have a large impact on the Sector. However, a special phenomenon exists here, many equipment and services providers are competitors as well. Valerus Compression Services, L.P., a United Stated-based company, is one of the suppliers of Petrofac. At the meantime, this company is doing the same things as Petrofac, they provide products and services for oil and gas companies. For this type of company, as a competitor, they intended to invest hugely in research and development (R&D) in order to improve their competitiveness in the industry; but as a supplier, they set strict limits on their equipment and service provision. Due to these factors, the suppliers have a greater impact with strong bargaining power in Oil and Gas Equipment and Services Sector.
3.1.3 Threat of New Entrants
As mentioned above, Petrofac is vertical integrated, their business involvement on all of the segments of Oil and Gas Value Chain, especially the upstream. And the Oil and Gas Equipment and Services Sector can be divided into five different subsectors: Exploration, Drilling, Completion, Production and Capital Equipment and Offshore Services. For different subsectors, different technology or equipment is required, which requires companies to have relatively strong R &D capacity and huge investments. At present, most leading oil service providers have a considerable number of patents which reflects its high level of technology. According to a research form Espacenet, Schlunberger is the biggest oilfield service company in the world with
29 more than 36,000 patents. In comparison with Halliburton and Backer Hughes, which have 25,000 and 20,000 patents.
Pitatzis, A. (2016) mentioned that most countries have their state-owned national oil and gas companies, and these national oil and gas companies control more than 90% of the oil and gas reserves. These national companies always have their own cooperative partners, so this is another weakness for new entrants.
In the future, with the entire oil industry transforming from conventional energy to unconventional energy, the technical requirements will be higher and more complex. Big oil and gas companies have grown significantly in their business life, in the meantime, they develop their R&D, improve the technology, which bring a cost advantage to company and further strengthen the barriers to new entrants.
3.1.4 Threat of Substitutes
The main current alternatives for oil and gas are: Nuclear Energy, Coal, Hydrogen, Biofuels and other renewables sources (Solar and wind energy). Hence, the alternatives for Oil Equipment and Services Company are the companies who provide the service for other energy.
Image taken from: Petrofac Annual Report 2016
Under the new policies scenario, International Energy Agency (IEA) estimated the world primary energy demand by 2040. It can be seen from the Image, the demand for oil will increase slightly to 4775 M tone per day. Meanwhile, the gas demand is forecasted to grow by more than 50%. It can be said that the renewables energy may not be able to become the main energy in the long period.
30 The Financial Times (2017) reported that in 2015, the last deep-pitcoalmine (Kellingley) in the UK was officially closed. The British government also announced in the run-up to the December 2015 adoption of the Paris climate change accord that they wanted to phase out coal power by 2025. With the increasing of importance of environment, the using of oil and gas have been encouraged, the proportion of coal consumption is gradually decreasing whereas the proportion of oil and gas consumption is growing. Overall, it seems that there is few threat of the substitutes in Oil and Gas Equipment and Services Sector.
3.1.5 Competitive Rivalry
Oil, equipment and services market is a monopolistic competition market with strong competition, due to the large number of segments and the high technical requirements, and the different services, products from different companies. For example, some grow up with technical advantage, some have a value chain advantage that relies on the vertical integration, and some monopoly companies get ahead because of their monopolization. Petrofac is a typical vertical integrated company which is involved throughout the value chain, from designing to marketing. Services include concluding contracts with the energy end market, helping companies to manage the operations based on changing market demands. Less influence from the oil price volatilities are brought to bear on Petrofac, because the company can hedge profits against declining price by expending the profit margins in refining operations.
The high exit barrier is another difficult situation for firms. Equipment as the major capital of a company whereas R & D expenditure and other intangible assets might be hard to recover due to the specification.
31 3.1.6 Summary of porter’s five model
Figure 9 Porter’s Five Model Result
Figure 9 represents that the bargaining power of buyers is relatively high as the threat of new
entrants is low. The high exit barrier and the difficulty recovering the investment lead to a high competitive rivalry. 0 2 4 6 Bargaining Power of Buyers Bargaining Power of Suppliers
Threat of New Entrants Threat of Substitutes
32
3.2 SWOT Analysis
3.2.1 Strength
As mentioned above, Petrofac is an integrated company, compared to other independent company, it can get a balance from upstream and downstream operations to hedge profits against the market recessions.
With 35-year operating experience, Petrofac has built a strong reputation in the market. A reorganization of Petrofac has been implemented in January 2016, in order to meet client requirements from a changing environment, such as the Middle East and North Africa.
The core value of Petrofac is “SAFE”. The high potential incidents (HiPos) rate has fallen from 0.063 (2015) to 0.039 (2016) (Petrofac, Annual report and account 2016, p.54) which is an excellent safety record. Petrofac’s performance keeps substantially ahead of industry norms.
There is a strong risk management system in Petrofac (image shown below). This helps the management to seize opportunities despite it operates in a challenging environment.
Image taken from: Petrofac Annual Report 2016
With Petrofac operating in 29 countries, the group employs approximately 13,500 staff in the Middle East, Africa, Europe, Americas, Asia Pacific, India and CIS, even though there is a decline in employee numbers in 2016. This strong workforce ensures that the group can keep operating even when one region stagnates.
33 Oil and Gas Equipment and Services Sector is a technology intensive sector, the engineering teams of Petrofac keep finding new techniques to delivery efficiency combined with cost optimization.
3.2.2 Weakness
The industry is capital intensive, large amounts of investment are needed at the beginning, and it takes a long time to generate profit from the investment.
The industry is in close ties with the oil and gas industry, hence there is a strong correlation between the performance of IES in Petrofac and oil and gas price volatility. Recently the low price and the uncertainty in forward price influence the level of investment, development and business activity within the industry.
The number of contracts are relatively small with large value in Petrofac, the termination of contract will bring a significant impact on financial performance. 3.2.3 Opportunities
As it was mentioned before, the use of coal in the world is declining whereas oil and gas as a main energy is encouraged to use. The demand of oil and gas will be strengthening further.
3.2.4 Threats
The political risk remains a significant threat in this industry, notably Petrofac which has to face possibility of regime change and legal or regulatory changes. Petrofac should keep an eye on the Middle East and North Africa because of the exposure to policy changes.
Until 2015, more than 80% of crude oil reserves are located in OPEC countries, but at the end of May 2017, OPEC announced the oil supply cut until March 2018, the OPEC and non-OPEC members agree with it (Meredith, 2017). Oil companies are the main customer of the industry, the oil supply cut might bring along a declining demand in equipment and service industry.
A strong international competition exists in this industry. The most market is occupied by three major oil equipment and service companies: Schlumberger, Halliburton and Baker Hughes, resulting from technical monopoly.
34
3.3 Industry Life Cycle & Macro Economics
Finch and Acha (2008) suggest that oil related equipment and services are at the mature stage of the industry life cycle with mature technology, stable and clear industry competition and user characteristic. This sector is a monopolistic competition market with significant high entry barriers, and it is getting difficult to develop new technologies. Some large firms dominate most of the market, such as Schlumberger, Halliburton and Baker Hughes, and there is a strong competition among the others for the rest of the market. It leads to a situation that all of the end products are homogeneous without product differentiation.
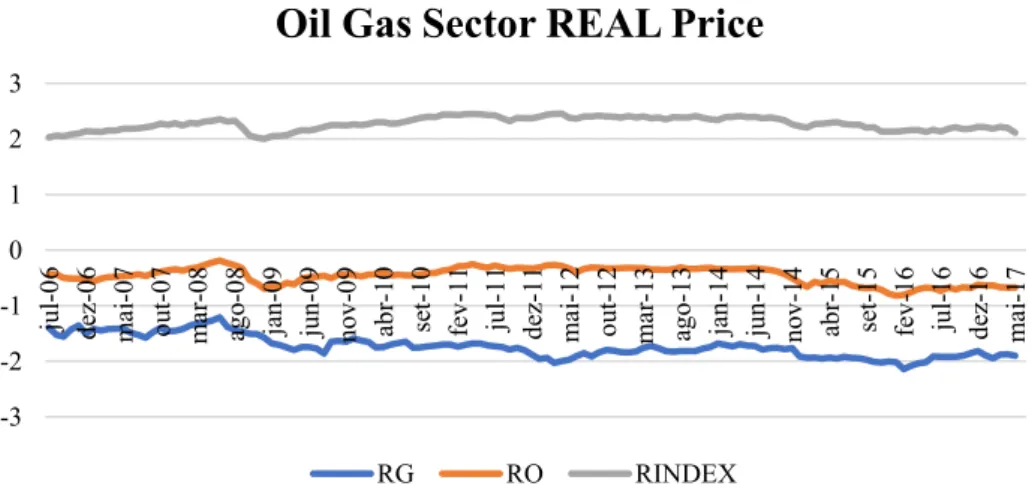
There is a strong correlation between the performance of FTSE oil equipment and service sector and the price of oil and gas, and the investment of this industry relies on the stable and healthy oil & gas prices. The prices are determined by many factors, especially the dynamic relationship between the supply and demand. Moreover, there is a long-term inverse relationship between crude oil and gas prices and the value of the dollar (Kowalski, 2017). The current spot dollar index gradually increased to 96.963 index points (6/26/2017) compared to 80 index points in mid-2014 against other foreign exchange instruments. Whereas the crude oil WTI future price fell down from $105.37 in June 1,2014 to $43.84 in June 27, 2017 (Investing, 2017)
Figure 10 Oil and Gas and Sector Real Price Monthly
Monthly Real Gas, Oil Future Price and Real Sector Index calculated in excel Based on Natural Gas Price (NG), Brent Crude Oil Price (CLQ7)
and FTSE ALL SHARE Oil Equipment & Services (FTAXS0570). Source: Thomson Reuters
-3 -2 -1 0 1 2 3 ju l-0 6 de z-0 6 m ai -0 7 ou t-0 7 m ar-0 8 ag o-0 8 jan -0 9 ju n-0 9 no v-09 ab r-1 0 se t-1 0 fe v-1 1 ju l-1 1 de z-1 1 m ai -1 2 ou t-1 2 m ar-1 3 ag o-1 3 jan -1 4 ju n-1 4 no v-14 ab r-1 5 se t-1 5 fe v-1 6 ju l-1 6 de z-1 6 m ai -1 7
Oil Gas Sector REAL Price
35 It can be seen from Figure 10 above, there is a strong positive correlation between the Brent oil price, Natural Gas price and the FTSAX0570. This strong correlation further illustrates the cyclicality of oil related service and equipment industry – the demand scale and the level of investment of oil and gas company will change with the oil and gas price changes, so that the oil and gas service industry will adjust their investment appropriately. The period from 2005-2008 were boom years for the industry, peak price of FTAXS was 19,100.32 GBP on Jun 1st 2008. From there on the price has fallen sharply and reached a low of 8,568.42 GBP due to the global financial crisis of 2008.
Image taken from: Investing.com
Schlumberger, Halliburton and Baker Hughes are the top three in the industry. The picture above presents the WTI oil future price and stocks of the three companies. We can see directly that the stock prices are consistent with oil price, and the time when extreme points occurred are highly synchronized. Moreover, there were some rebounds recently, the stock prices recovered at the same time as the rebound occurred or even early.
Market fundamentals are projected to be robust in the long-term, the energy demand is expected to grow by 30% until 2040 because of the new policies scenario - Decarburization (450) scenario (Petrofac, 2016). Oil price is set to continue to increase in the coming years, which has a positive impact on the equipment and services industry. The investment activity will see an
36 upturn and the growth in China is set to strengthening further in the second half of 2017. The market stability is predicted to increase in line with above factors.
37
3.4 Correlation with Gas and Oil
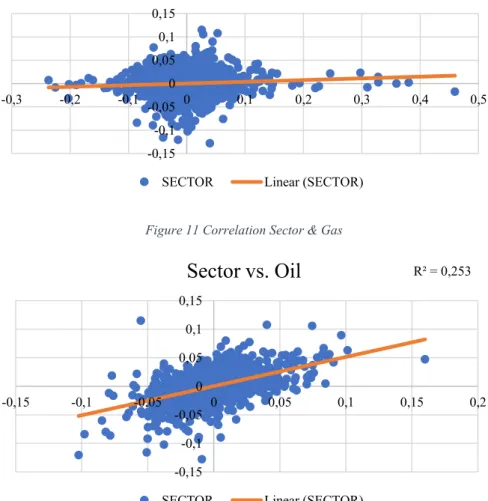
Petrofac provides services to the oil and gas production and processing industry, therefore, the gas and oil price will be focused on. From Figure 11 and 12, we can see a significant positive correlation. The Sector (FTSAX0570) shows a higher correlation with real crude oil price with R² = 0.2530 compared to the gas price with R² = 0.0056. The reaction of industry is broadly in line with the trend of the real oil price.
Correlation
Covariance R² Beta
Sector Index & Gas 0.00006 0.0056 0.0363
Sector Index & Oil 0.00019 0.2530 0.5108
Table 6 Correlation with Gas and Oil
Figure 11 Correlation Sector & Gas
Figure 12 Correlation Sector & Oil
Correlation computed on the daily price change, sources: Thomson Reuters
R² = 0,0056 -0,15 -0,1 -0,05 0 0,05 0,1 0,15 -0,3 -0,2 -0,1 0 0,1 0,2 0,3 0,4 0,5
Sector vs. Gas
SECTOR Linear (SECTOR)
R² = 0,253 -0,15 -0,1 -0,05 0 0,05 0,1 0,15 -0,15 -0,1 -0,05 0 0,05 0,1 0,15 0,2
Sector vs. Oil
38
4 Risk and Return
Data has been compiled using monthly price from investing.com and Thomson Reuters. The FTSE250 has been used as market benchmark, and the Sector benchmark is FTSE All Share Oil Equipment & Services Index (FTSAX0570). Data has been collected from 03/7/2007 until 04/07/2017.
PERFORMANCE 5-DAY 1-MONTH 3-MONTH 6-MONTH 1-YEAR 5-YEAR 10-YEAR
PETROFAC 8.1% 23.79% -49.81% -48.72% -40.54% -68.44% 8.91%
FTSE 250 -1.85% -3.41% 1.93% 6.50% 17.34% 72.66% 64.46%
SECTOR 0.08% -4.79% -24.22% -25.23% -13.78% -45.57% -0.62%
Table 7 Cumulative Performance
The performance is poor over the 5 years, 1 year, 6 months and 3 months period, as Petrofac was being investigated by Serious Fraud Office (SFO). However, over the 1 month period they performed well with a 23.79% return. Since that time, it has continued to recover strongly.
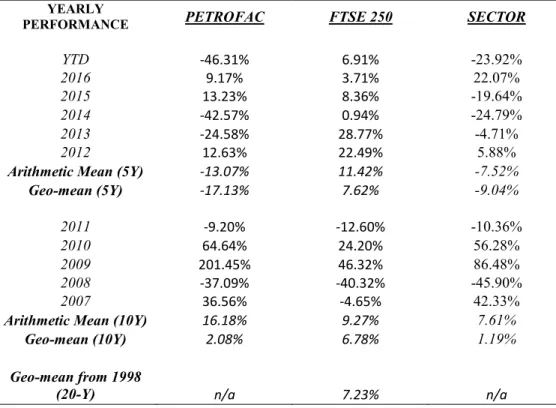
YEARLY
PERFORMANCE PETROFAC FTSE 250 SECTOR
YTD -46.31% 6.91% -23.92% 2016 9.17% 3.71% 22.07% 2015 13.23% 8.36% -19.64% 2014 -42.57% 0.94% -24.79% 2013 -24.58% 28.77% -4.71% 2012 12.63% 22.49% 5.88%
Arithmetic Mean (5Y) -13.07% 11.42% -7.52%
Geo-mean (5Y) -17.13% 7.62% -9.04% 2011 -9.20% -12.60% -10.36% 2010 64.64% 24.20% 56.28% 2009 201.45% 46.32% 86.48% 2008 -37.09% -40.32% -45.90% 2007 36.56% -4.65% 42.33%
Arithmetic Mean (10Y) 16.18% 9.27% 7.61%
Geo-mean (10Y) 2.08% 6.78% 1.19%
Geo-mean from 1998
(20-Y) n/a 7.23% n/a
Table 8 Yearly Performance
The YTD shows that Petrofac has been facing serious issues this year, the investigation brought a significant influence to their performance. In 2008, the return in FTSE 250, Sector and Petrofac decreased sharply because of the effect of the global financial crisis. And then returned back in 2009, which broadly in line with the tentative growth after the crisis. The demand from
39 emerging markets and developing economies (EMDEs) such as China and India was strengthening further in the following years. After the Brexit and UK election on 8th Jun, the FTSE 250 has shown a 6.91% YTD performance which substantially ahead of Petrofac and the Sector with a positive translation impact in the constituents of FTSE 250. This implies that most of the constituents are holding dollar instead of sterling and the effects from the Brexit and the election strengthen the dollar and weaken the sterling.
4.1 Return
Data which used to analysis the Beta and Return is from investing.com and Thompson Reuters. The 5-year monthly historic price was used to calculate the return. For beta calculation, the prices of FTSE 250 and Petrofac will be assumed as normal distributed.
4.1.1 FTSE 250 (Market) Return
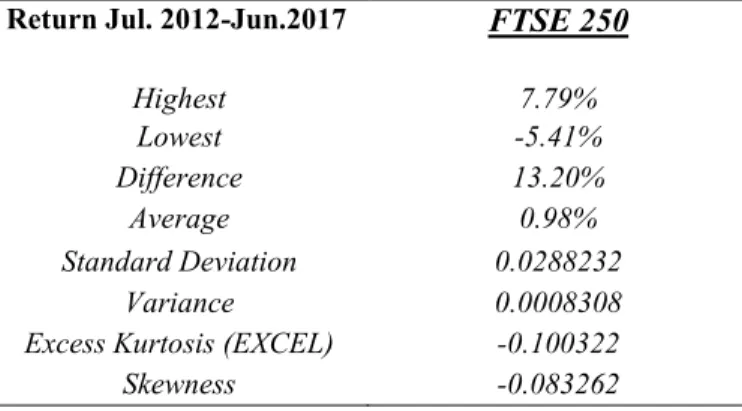
The Table and Figure present the monthly performance for FTSE 250 in the recent 5 years. The frequency for FTSE 250 return presented in Figure 5 is compared with normal distribution. The Excel excess kurtosis is -0.100322 (lower than zero) or platykurtic. This graph shows clearly that the skewness is below zero, as the graph skewed to the left.
Return Jul. 2012-Jun.2017 FTSE 250
Highest 7.79% Lowest -5.41% Difference 13.20% Average 0.98% Standard Deviation 0.0288232 Variance 0.0008308
Excess Kurtosis (EXCEL) -0.100322
Skewness -0.083262
40
Figure 13 FTSE 250 Return
Figure 14 FTSE250 frequency of 5-year monthly return
4.1.2 Petrofac Return
The Figures below show the performance of Petrofac based on 5-years monthly percentage returns. Same as the return of FTSE 250, the stock price is not normally distributed. Compared to the normal distribution, it has a stronger peak as the high excess kurtosis (7.753636). The skewness is -1.611687, which makes the graph skewed to left.
RETURN Jul. 2012-Jun.2017 PETROFAC
Highest 24.58% Lowest -53.35% Difference 77.93% Average -1.04% Standard Deviation 0.109984 Variance 0.012096
Excess Kurtosis (EXCEL) 7.753636
Skewness -1.611687 Table 10 Petrofac Return
-10,00% -5,00% 0,00% 5,00% 10,00% ju l-12 ou t-12 ja n-13 ab r-13 ju l-13 ou t-13 ja n-14 ab r-14 ju l-14 ou t-14 ja n-15 ab r-15 ju l-15 ou t-15 ja n-16 ab r-16 ju l-16 ou t-16 ja n-17 ab r-17 ju l-17 FTSE 250 RETURN 5-year monthly FTSE 250 -8,00% -6,00% -4,00% -2,00% 0,00% 2,00% 4,00% 6,00% 8,00% 10,00% 0 5 10 15 0 5 10 15 20 -5,41% -3,76% -2,11% -0,46% 1,19% 2,84% 4,49% 6,14% 7,79%
Frequency for FTSE 250 v.s Normal Distribution 5-year montyly return
41
Figure 15 Petrofac Return
Figure 16 Petrofac frequency of 5-year monthly return
4.1.3 Conclusion
It can be seen from the Table 11 that the 5-year monthly return is different from the yearly return, as the data used are different. However, both two returns show that Petrofac did not performed well in the last 5 years. However, from the monthly returns, we can find that Petrofac price is modestly picking up recently.
FTSE 250 Petrofac
5-year Yearly Return 11.86% -13.07%
5-year Monthly Return 0.98% -1.04% Table 11 5-year Return FTSE vs. Petrofac
-60,00% -50,00% -40,00% -30,00% -20,00% -10,00% 0,00% 10,00% 20,00% 30,00% ju l-12 set -1 2 no v-12 ja n-13 ma r-13 ma i-13 ju l-13 set -1 3 no v-13 ja n-14 ma r-14 ma i-14 ju l-14 set -1 4 no v-14 ja n-15 ma r-15 ma i-15 ju l-15 set -1 5 no v-15 ja n-16 ma r-16 ma i-16 ju l-16 set -1 6 no v-16 ja n-17 ma r-17 ma i-17 ju l-17 PETROFAC RETURN 5-year monthly Petrofac -60,00% -50,00% -40,00% -30,00% -20,00% -10,00% 0,00% 10,00% 20,00% 30,00% 0,00 0,50 1,00 1,50 2,00 2,50 3,00 3,50 4,00 0 1 2 3 4 5 6 7 8 9 10 -5 3, 35 % -5 0, 75 % -4 8, 15 % -4 5, 56 % -4 2, 96 % -4 0, 36 % -3 7, 76 % -3 5, 17 % -3 2, 57 % -2 9, 97 % -2 7, 37 % -2 4, 78 % -2 2, 18 % -1 9, 58 % -1 6, 98 % -1 4, 39 % -1 1, 79 % -9 ,1 9% -6 ,5 9% -3 ,9 9% -1 ,4 0% 1, 20 % 3, 80 % 6, 40 % 8,9 9% 11 ,5 9% 14 ,1 9% 16 ,7 9% 19 ,3 8% 21 ,9 8% 24 ,5 8%
Frequency for Petrofac v.s Normal Distribution 5-year montyly return
42
Figure 17 Re-Based Price
The daily price in the graph above are all rebased to 100 (on 02/07/2012). And from this graph we can see it immediately, oil, Sector and Petrofac almost follow the same trend, and there is a slight increase in Oil price in the end of June 2017 which gave Petrofac a significant uptrend.
4.2 Beta and correlation
Beta is a measure of systematic risk, which was calculated by using monthly price, and it describes the volatility of Petrofac price relative to the market (FTSE250 as the market benchmark, FTASX0570 as the Sector index). The data of calculation is used as following numbers (and all of them were calculated by excel functions):
M = Market (FTSE250), PFC = Petrofac, S = Sector
Table 12Beta Components
Beta Formula: 0 20 40 60 80 100 120 140 160 180 200 02 -0 7-2 01 2 02 -1 0-2 01 2 02 -0 1-2 01 3 02 -0 4-2 01 3 02 -0 7-2 01 3 02 -1 0-2 01 3 02 -0 1-2 01 4 02 -0 4-2 01 4 02 -0 7-2 01 4 02 -1 0-2 01 4 02 -0 1-2 01 5 02 -0 4-2 01 5 02 -0 7-2 01 5 02 -1 0-2 01 5 02 -0 1-2 01 6 02 -0 4-2 01 6 02 -0 7-2 01 6 02 -1 0-2 01 6 02 -0 1-2 01 7 02 -0 4-2 01 7
Re-Based Price
Market Petrofac Sector Oil
M/PFC S/PFC M/S Beta M/PFC Correlation 0.1503 0.7203 0.2626 5-Year Monthly 0.3632 Covariance 0.0005 0.0054 0.0005 Self-Calculated 0.5736 Beta 0.5736 0.4503 0.1101 R2 0.0226 0.5188 0.0690 M PFC S Variance 0.00083 0.01210 0.00473 Standard D 0.02882 0.10998 0.06876 Sharpe Ratios -1.6194 -1.4139 Expected R 4.66% 1.86%
43 𝜷 = 𝑪𝑶𝑽(𝒓𝒊, 𝒓𝒎) 𝑽𝒂𝒓(𝒓𝒎) Sharpe Ratio: 𝑺𝒑 =𝑬(𝒓𝒑) − 𝒓𝒇 𝝈𝒑
Figure 18 Correlation FTSE250 & Petrofac
Systematic Risk
The beta value (M/PFC) taken from Thompson Reuters is different from my calculations because the data used is different (Adjusted or unadjusted), despite I covered the same period. The self-calculated beta is 0.5763 and the correlation of PFC and the market is 0.1503, which means if the market increases by 1% the price of PFC increase by less than 1%. While the R-squared (0.0226) tells us that there are only 2.26% of the movements of stock can be explained by movements of market. The unsystematic risk (1 - 2.26% = 97.74%) cannot be eliminated and could be explained by the investigations from the SFO.
Political and Geographical Risk
This risk arises principally from Petrofac’s over-sea operations, especially from the Middle East and North Africa caused by the changing political landscape. The over-concentration in specific market is another problem. As a result, the security risk assessments are used by Group Risk Committee to ensure the completion of all projects.
R² = 0,0226 -60,00% -50,00% -40,00% -30,00% -20,00% -10,00% 0,00% 10,00% 20,00% 30,00% -8,00% -6,00% -4,00% -2,00% 0,00% 2,00% 4,00% 6,00% 8,00% 10,00% Correlation FTSE250 & PFC PFC Linear (PFC)
44 IT Resilience
A business disruption and a loss of competitive position might happen because of IT risk. In 2016, the business secret data has been moved to new data centers. Moreover, company invested heavily in cyber intrusion detection and prevention tools. Additionally, cyber seminars were held to raise awareness for employee.
Lack of Effective Talent
It should be highlighted that the products of Oil and Gas Equipment and Services Sector are homogeneous, the company wants to be ahead with the help of employee’s knowledge. To solve the lack of employee with insufficient skills and experiences, Petrofac developed a systematic talent performance management and leadership excellence program.
Financial Capacity
Petrofac maintains a healthy capital by using a mixture of external and internal financing. The capital of equity has been calculated as 4.66% via CAPM. In order to fund ongoing projects, Petrofac needs more finance in the future so that the company is exposed to liquidity risk. The board has defined a maximum level of leverage, and improved the debt position over 2016 to avoid the losing of financial capacity. As shown on the balance sheet, there is a 10% reduction in Net Debt from US $686 million to US $617 million (2015), while they are projecting to complete a global cash management program in 2017.
Interest Rate
According to Annual Report 2016, the interest rate risk arising from Petrofac’s long-term debt rate and its cash and bank balances. The company works against its interest cost by mixing the fixed and variable debt rate, the cash and bank balances are using floating rates.
Foreign currency risk
Petrofac uses US dollar to calculate almost all of the financial capital, as the operations has been spread to 29 countries. This makes the company vulnerable to exposure against the exchange rate. The forward exchange contracts are used to hedge this risk. In the end of 2016, a series of contracts have been formed during January 2017 to June 2019
45 Capital Asset Pricing Model (CAPM) should be used to value the company through the cost of equity, which describes the relationship of the systematic risk and expected return of the stock. Expected Return Formula:
𝑹𝒊 = 𝒓𝒇+ 𝜷(𝒓𝒎 – 𝒓𝒇) Where:
𝑅𝑖 : Expected Return on Asset (Cost of Equity) 𝛽 : Beta, Systematic Risk
𝑟𝑓: Risk Free Rate 𝑟𝑚 – 𝑟𝑓 : Risk Premium
According to Burfield, the Gilts are the most common benchmark in UK, and our data collected for five-year period. Therefore, the UK Gilt 10 Year Yield has been used as the risk-free rate, which was taken from Bloomberg. The value is 1.20% for 3rd July 2017.
𝑟
𝑓= 1.20%
Risk Premium is needed to estimate the cost of equity, which is the difference of expected return between risky asset and the risk-free rate (UK Gilts rate). According to Section 4.1 the equity market premium was calculated by using the yearly FTSE price (which is 20-year Geometric Mean 7.23%) from 1998 to date.
𝑟
𝑚– 𝑟
𝑓= 7.23% -1.20% = 6.03%
Cost of Equity of Petrofac:
46
Figure 19 SML & Actual Return
4,66% 1,86% 1,20% 0,0723 -17,13% -9,04% y = 0,0603x + 0,012 -20,00% -15,00% -10,00% -5,00% 0,00% 5,00% 10,00% 0 0,2 0,4 0,6 0,8 1 1,2 E xp ec ted R etu rn Beta
SML & Actual Return of Petrofac and Sector
47
5 Capital Structure
Petrofac is a large international company with US $1.86 Billion market capitalization. The leverage ratios have been used to discuss the performance of Petrofac, the market and the industry. The cost of debt is the interest paid by a company for their debt, which is tax deductible. Cost of Debt
Cost of Debt Million$ 2016 2015 2014 2013 2012
Interest Expenses 91 97 73 24 -
Short Term Debt - - - - -
Long Term Debt 1,759 1,901 2,448 1,297 362
Total Debt 2,380 2,660 2,691 1,361 362
Equity 1,123 1,232 1,871 1,992 1,550
D/E 2.12 2.16 1.44 0.68 0.23
D/D+E 0.6794 0.6835 0.5899 0.4059 0.1893
Cost of Debt 3.82% 3.65% 2.71% 1.76% -
Net Gearing Ratio 56.2% 55.8% 39.4% 36.6% -
Cost of Debt Million $
4-year Debt Avg. 2,273
4-year Interest Avg. 71.25
Pre-Tax Cost of Debt 3.13%
Tax Rate Avg. 34.70%
After-Tax Cost of Debt 2.05%
Table 13 Cost of Debt
Cost of Debt Formula:
𝐶𝑜𝑠𝑡 𝑜𝑓 𝐷𝑒𝑏𝑡 = 𝑖𝑛𝑡𝑒𝑟𝑒𝑠𝑡 𝑒𝑥𝑝𝑒𝑛𝑠𝑒 𝑡𝑜𝑡𝑎𝑙 𝑑𝑒𝑏𝑡⁄ After tax Cost of Debt Formula:
𝐴𝑓𝑡𝑒𝑟 𝑇𝑎𝑥 𝐶𝑜𝑠𝑡 𝑜𝑓 𝐷𝑒𝑏𝑡 = 𝐶𝑜𝑠𝑡 𝑜𝑓 𝐷𝑒𝑏𝑡 × (1 − 𝑇𝑎𝑥 𝑅𝑎𝑡𝑒) = 𝟐. 𝟎𝟓%
Because there are no interest expenses in 2012, the data from 2013-2016 will be used to calculate the average cost of debt.
It can be seen from the Table 13 that Petrofac using a combination of debt and equity financing, but there is no short-term debt on its Income and Financial Statement. In 2016, Petrofac improved their free cash flow position with a 10% reduction in Net Debt to US$617 million because of a strong cash generation, but the 56.2% Net Gearing Ratio is still high which reflecting a greater risk. However, interest bearing debt brings a major benefit from tax since it
48 is tax deductible. The above Table shows that there is a dramatic increase in effective tax rate, which led to a great tax benefit. A reduction in finance leads interest costs to offset the increase in debt interest expenses since the finance cost remained unchanged in 2016. The graphic below shows the equity and debt, the debt amount has increased over the past 5 years. The D/E ratio has a significant increase from 0.23 to 2.12, which stipulates a high level of debt within the company.
Figure 20 Debt-Equity
The weighted average cost of capital (WACC) helps to measure the cost of capital for a firm. Equity is measured by the market capitalization ($1,868.48 Million). The market value of debt is difficult to calculate, to be in line the four-year average book value of debt will be used, which is $2,273 Million. WACC Formula: 𝑊𝐴𝐶𝐶 = 𝐸 𝐷 + 𝐸× 𝑅𝑒+ 𝐷 𝐷 + 𝐸× 𝑅𝑑× (1 − 𝑇)
Million $ Explanation Value
Equity Market Cap (M) 1,868.48
Debt (2013-2016 Avg) Book Value of Debt 2,273
E+D 4,141.48
Re Cost of Equity 4.66%
Rd(1-T) Cost of Debt (after-tax) 2.05%
WACC 3.23% Table 14 WACC $500,00 $1.000,00 $1.500,00 $2.000,00 $2.500,00 $3.000,00 $3.500,00 D E B T- E Q U I T Y Net Asset Debt $ Million