Selection of our books indexed in the Book Citation Index in Web of Science™ Core Collection (BKCI)
Interested in publishing with us?
Contact book.department@intechopen.com
Numbers displayed above are based on latest data collected. For more information visit www.intechopen.com Open access books available
Countries delivered to Contributors from top 500 universities
International authors and editors
Our authors are among the
most cited scientists
Downloads
We are IntechOpen,
the world’s leading publisher of
Open Access books
Built by scientists, for scientists
12.2%
116,000
120M
TOP 1%
154
Patient Safety Culture in Portuguese Primary Care:
Validation of the Portuguese Version of the Medical
Office Survey
Margarida Eiras, Ana Escoval and Carina Silva
Additional information is available at the end of the chapter
Abstract
Background: Assessing patient safety culture is a strategic priority worldwide, and Por-tugal is no exception.
Objective: It is the objective of this work to translate, adapt, validate, and analyze the reliability of the Medical Office Survey on Patient Safety Culture in Portuguese Primary Health Care (MOSPSC).
Methods: The methodology adopted focused on transcultural translation and adaptation using the Translation Guidelines for the Agency for Healthcare Research and Quality (AHRQ) surveys on Patient Safety Culture, and reliability was conducted using Cronbach’s α and average inter-item correlation. Exploratory factor analysis and confir-matory factor analysis were performed to investigate the observed data that fit to the dimensional structure proposed in the AHRQ Portuguese version.
Results: The initial sample (n = 7299) was submitted to a missing value analysis, obtaining a final sample of 4304 surveys. With exploratory factor analysis, it was obtained a struc-ture with eight composites, one item was removed, and several items moved to other composites. With confirmatory factor analysis, one composite was removed. For both proposed model structures, good results were achieved for goodness of fit indices. Conclusions: The Portuguese version of the MOSPSC resulted in nine composites with good reliability and construct validity.
Keywords: patient safety, primary care, safety culture, validity, reliability, exploratory factor analysis, confirmatory factor analysis
© 2018 The Author(s). Licensee IntechOpen. This chapter is distributed under the terms of the Creative Commons Attribution License (http://creativecommons.org/licenses/by/3.0), which permits unrestricted use, distribution, and reproduction in any medium, provided the original work is properly cited.
1. Introduction
Health care is vulnerable to error, and so all health care environments and professionals are involved in complex care processes. Since the IOM report [1], almost all countries and health care organizations are attending to Patient Safety issues. In more recent years, the European Council launched a recommendation [2] that shows the importance of establishing patient safety culture in all health care settings. We can read in this recommendation that a poor patient safety represents both a severe public health problem and a high economic burden on limited health resources. A large proportion of adverse events, both in the hospital sector and in primary care, are preventable with systemic factors appearing to account for a majority of them.
Before implementing patient safety programs, health care staff must understand their safety culture [3]. Quantitative instruments designed to assess safety culture have been developed, and a few review articles have been published, which allows a more comprehensive way of implementing models of safety culture [4]. Measuring health care safety culture enables us to identify improvements, safety behaviors, and outcomes for both patients and staff. These instruments should also serve as decision making tools, especially for managers.
Much has been done in hospital environment, and more recently, primary care has also been in the sights. A few review articles were published allowing researchers and primary care staff to take robust decisions on tools to assess patient safety culture [5–7].
With the publication of the National Patient Safety Plan (2015–2020), the Portuguese Directory of Health along with the Portuguese Hospital Association carried out patient safety culture assess-ment either in hospitals or in primary care. It was published as a national standard, and every 2 years, patient safety culture is assessed either in primary care or in hospitals nationwide.
The purpose of this study was to translate, adapt, validate, and analyze the reliability and validity of the Portuguese version of the Medical Office Survey on Patient Safety Culture.
2. Methods
2.1. Medical Office Survey on Patient Safety Culture
The Medical Office Survey on Patient Safety Culture (MOSPSC) is a self-administered tool, which was developed by the Agency for Healthcare Research and Quality (AHRQ) in 2007 [8], and is designed specifically for outpatient medical office providers and other staff and asks for their opinions about the culture of patient safety and health care quality in their medical offices. Although in Portugal the health system is completely different than in the United States, we considered that the primary care environment and culture are similar, which lead us to test its use.
This survey has 38 items grouped into 10 composites and includes questions that ask respon-dents about problems related to exchange information with other settings and about access to care. Respondents are also asked to rate their medical office in five areas of health care quality
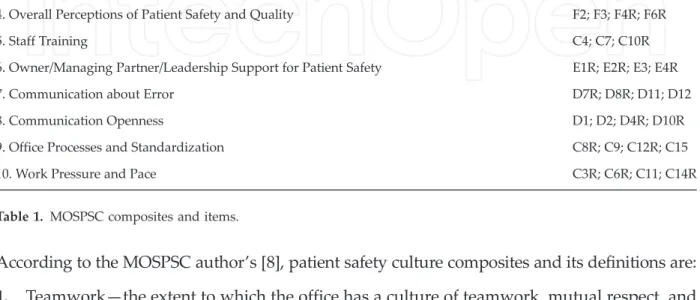
(patient centered, effective, timely, efficient, and equitable) and to provide an overall rating on patient safety (Table 1).
According to the MOSPSC author’s [8], patient safety culture composites and its definitions are: 1. Teamwork—the extent to which the office has a culture of teamwork, mutual respect, and
close working relationships among staff and providers.
2. Patient Care Tracking/Follow Up—the extent to which the office reminds patients about appointments, documents how well patients follow treatment plans, follows up with patients who need monitoring, and follows up when reports from an outside provider are not received.
3. Organizational Learning—the extent to which the office has a learning culture that facili-tates making changes in office processes to improve the quality of patient care and evalu-ates changes for effectiveness.
4. Overall Perceptions of Patient Safety and Quality—the extent to which the quality of patient care is more important than getting more work done, office processes are good at preventing mistakes, and mistakes do not happen more than they should.
5. Staff Training—the extent to the office gives providers and staff effective on-the-job train-ing, trains them on new processes, and does not assign tasks they have not been trained to perform.
6. Owner/Managing Partner/Leadership Support for Patient Safety—the extent to which office leadership actively supports quality and patient safety, places a high priority on improving patient care processes, does not overlook mistakes, and makes decisions based on what is best for patients.
7. Communication about Error—the extent to which providers and staff are willing to report mistakes they observe and do not feel like their mistakes are held against them, and
Composites Items
1. Teamwork C1; C2; C5; C13
2. Patient Care Tracking/Follow Up D3; D5; D6; D9
3. Organizational Learning F1; F5; F7
4. Overall Perceptions of Patient Safety and Quality F2; F3; F4R; F6R
5. Staff Training C4; C7; C10R
6. Owner/Managing Partner/Leadership Support for Patient Safety E1R; E2R; E3; E4R 7. Communication about Error D7R; D8R; D11; D12
8. Communication Openness D1; D2; D4R; D10R
9. Office Processes and Standardization C8R; C9; C12R; C15 10. Work Pressure and Pace C3R; C6R; C11; C14R
providers and staff talk openly about office problems and how to prevent errors from happening.
8. Communication Openness—the extent to which providers in the office are open to staff ideas about how to improve office processes, and staff are encouraged to express alterna-tive viewpoints and do not find it difficult to voice disagreement.
9. Office Processes and Standardization—the extent to which the office is organized, has an effective workflow, has standardized processes for completing tasks, and has good pro-cedures for checking the accuracy of work performed.
10. Work Pressure and Pace—the extent to which there are enough staff and providers to handle the patient load, and the office work pace is not hectic.
Since the publication of the National Patient Safety Plan (2015–2020), the Portuguese Directory of Health along with the Portuguese Hospital Association carried out patient safety culture assessment either in hospitals or in primary care. For this purpose, the MOSPSC was the chosen tool because [8]:
• it raises provider and staff awareness about patient safety; • it assesses the current status of patient safety culture;
• it identifies strengths and areas for patient safety culture improvement; • it examines trends in patient safety culture change over time;
• it evaluates the cultural impact of patient safety initiatives and interventions; • it conducts comparisons within and across organizations;
• it has been used in several countries in Europe (which makes benchmark possible) [9, 10], and the results of the LINEUS study [9] show that it is useful and applicable to assess patient safety culture at primary health care services in Europe.
The European Society for Quality and Safety in Family Practice (EQuiP) and the World Family Doctors. Caring for People (WONCA Europe) [11] conducted a study to spread the MOSPSC among EQuiP delegates, explore their views and opinions on the MOSPSC, and explore with them the feasibility of the MOSPSC among European countries. Nineteen countries were involved, and 63% of respondents find it would be interesting to use MOSPSC.
2.2. Translation and cultural adaptation process
Immediately after author’s permission for MOSPSC use, the survey was translated from English to Portuguese (T1) and backward (T2) by two independent translators, native speakers of Portuguese, and bilingual in English/Portuguese, experienced in this method and knowl-edgeable about the research objective (Step 1). The two versions (T1 and T2) were compared with the original version of the MOSPSC (Step 2). Back translation by two independent trans-lators (R-T1 and R-T2) was carried out by bilingual native English, who were unfamiliar with the original version of tool and not knowledgeable about the study objectives (Step 3). Dis-crepancies were assessed, and the cross-cultural adaptations were undertaken (Step 4).
Content validity and semantic analysis were undertaken by six experts chosen from the primary care sector and knowledge on this topic and with research experience (Step 5).
The pretest was applied (Step 6), which was aimed at assessing whether the MOSPSC was understandable to a larger number of people in the target population. The last version of the MOSPSC was then administered in Web-based format, and we used all recommendations from AHRQ [11] to publicize and promote the survey.
The Portuguese Directory of Health published a national standard that requires patient safety culture assessment in primary care units (PCUs) nationwide (52 PCUs) every 2 years. A personalized link was sent to all PCUs, where a focal point was in charge of facilitating the administration of the survey. In order to track and maximize response rates, a link was sent to each office PCU. We sent another link so that the focal point could check response rates along the administration period, which occurred from March 16 till April 30, 2017.
2.3. Statistical analysis
Our goal was to assess the validity and reliability of the Portuguese version of the MOSPSC, by verifying if the 10 patient-safety culture composites were appropriate for the Portuguese population. The R software was used for statistical analysis, and the negatively worded items were reverse-scored and they are denoted by R letter.
Descriptive statistics were used to examine response variability and missing data. To identify and eliminate those items with missing data, an individual descriptive item analysis was performed. A missing-value analysis was performed to verify if it was necessary to remove surveys from the data set. Every survey with missing values was removed, and surveys with more than 1 response in the option “not applicable” were removed. For the remaining surveys with only one answer in option “not applicable,” it was replaced by the middle category in a five-point Likert scale. An empirical rule of 10 respondents per patient safety culture item in a survey with 38 items means that at least 380 completed surveys were needed.
A reliability analysis (internal consistency) was performed using Cronbach’s α, where it indi-cates the extent to which surveys items can be treated as a single latent construct. Values >0.7 reliability is considered adequate for a survey instrument [12], although some authors consider >0.6 adequate [13]. For the entire survey, Cronbach’s α should be at least 0.9 [12]. However, the validity of this measure has been questioned, and several authors have suggested alternative measures. In this study, we also used the average inter-item correlation (AIIC), which is independent of the number of items and sample size. This measure evaluates how items within a composite correlate, i.e., there is evidence that the items are measuring the same underlying composite. A rule-of-thumb is that AIIC should be between 0.15 and 0.5 [14]. An exploratory factor analysis (EFA) was performed. EFA is a cluster of common methods used to explore the underlying pattern of relationships among multiple observed variables. EFA is useful for assessing the dimensionality of questionnaire scales that measure underlying latent variables. Researchers use EFA to hypothesize and, later, confirm, through replication or confir-matory factor analysis (CFA), the model that gave rise to the interrelationships among the scale’s variables. EFA for ordinal data, a benefit over conventional criteria, where the Pearson correlation
matrix is used. Pearson correlations assume that data have been measured on, at least, an equal interval scale, and a linear relationship exists between the variables. These assumptions are typically violated in the case of variables measured using ordinal rating scales. Pearson correla-tions have been found to underestimate the strength of relacorrela-tionships between ordinal items. EFA is useful for assessing the dimensionality of survey scales that measure underlying latent variables. This factor analysis gives an indication of the number of factors that the survey appears to measure of its intended subject. In this way, through EFA, we can investigate if the Portuguese data will produce different factors from the American structure.
Since the data are ordinal, it was used a polychoric correlation matrix for EFA analysis and a Varimax rotation. To decide on the number of factors, it was used a parallel analysis [15, 16]. Items with a factor loading lower than 0.4 on all factors were excluded. Libraries psych and polycorfrom R were used [17, 18].
We used confirmatory factor analysis (CFA) for ordinal data to compare the Portuguese sample factor structure to the factor structure reported for the original HSOPSC. CFA for ordinal data will use diagonally weighted least squares (DWLS) to estimate the model parameters, but it will use the full weight matrix to compute robust standard errors and a mean- and variance-adjusted test statistic. We used the goodness-of-fit index (GFI), which accounts for the proportion of observed covariance between the manifest variables (items), explained by the fitted model (a concept similar to the coefficient of determination in linear regression). Generally, GFI values between 0.9 and 0.95 indicate good fit, and GFI values above 0.95 indicate a very good fit. Bentler’s comparative fit index (CFI) was used to correct the underestimation that can occur when samples are small. CFI is independent from the sample size. Values between 0.9 and 0.95 indicate good fit, and values equal to or above 0.95 indicate a very good fit. The Tucker-Lewis index (TLI) varies between 0 and 1; values close to 1 indicate a good fit. Parsimony GPI (PGFI) is obtained to compensate for the “artificial” improvement in the model, which is achieved simply by adding more parameters, i.e., a more complex model may have better fit than a simpler model (parsimonious). Values between 0.6 and 0.8 indicate a reasonable fit and values above 0.8 a good fit. The index root mean square error of approximation (RMSEA) was used to adjust the model simply by adding more parame-ters. Empirical studies suggest that the model fit is considered good for values ranging between 0.05 and 0.08 and very good for values less than 0.05. The lavaan library from R was used [19].
3. Results
3.1. Demographic data
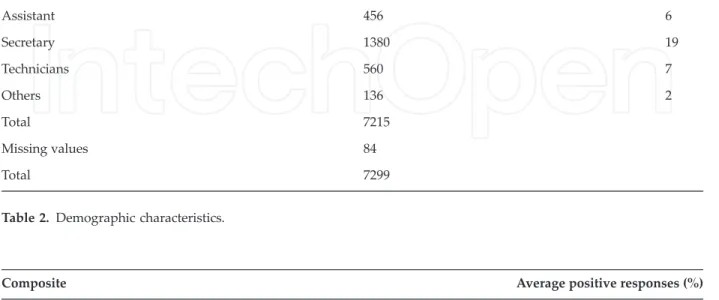
A total of 7299 respondents provided feedback (response rate of 32.2%), 38% were nurses, 27% physicians, and 19% secretary/clerk (Table 2).
Average composite positive responses were obtained (Table 3). The lowest positive scores were found in composites Work Pressure and Pace, Owner/Managing Partner/Leadership Support for Patient Safety,and Staff Training. The composites with highest scores were Teamwork, Patient Care Tracking/Follow Up,and Organization Learning.
3.2. Data screening and pre-analysis
From an initial data set of 7299 respondents, it was removed 587 surveys with missing values and 2408 surveys with more than 2 answers on the option “not applicable,” getting a final data set with 4304 surveys, exceeding the minimum necessary. The surveys with one answer in the option “not applicable” were replaced by the middle category in a five-point Likert scale.
3.3. Reliability analysis
Reliability analysis using Cronbach’s α was performed on the 10 composites to ensure that individuals were responding consistently to items (Table 4). Considering Cronbach’s α, all composites had values higher than 0.6, where composite 1 achieved the highest value and
Respondents N % Physicians 1954 27 Nurses 2729 38 Assistant 456 6 Secretary 1380 19 Technicians 560 7 Others 136 2 Total 7215 Missing values 84 Total 7299
Table 2. Demographic characteristics.
Composite Average positive responses (%)
1. Teamwork 76
2. Patient Care Tracking/Follow Up 76
3. Organization Learning 71
4. Overall Perceptions of Patient Safety and Quality 69
5. Staff Training 44
6. Owner/Managing Partner/Leadership Support for Patient Safety 31
7. Communication about Error 54
8. Communication Openness 52
9. Office Processes and Standardization 53
10. Work Pressure and Pace 21
composite 9 the lowest. Analyzing AIIC coefficient, only composites 1 and 3 obtained values outside from the reference. In terms of global consistency, both coefficients lead to a good overall consistency.
3.4. Exploratory factor analysis
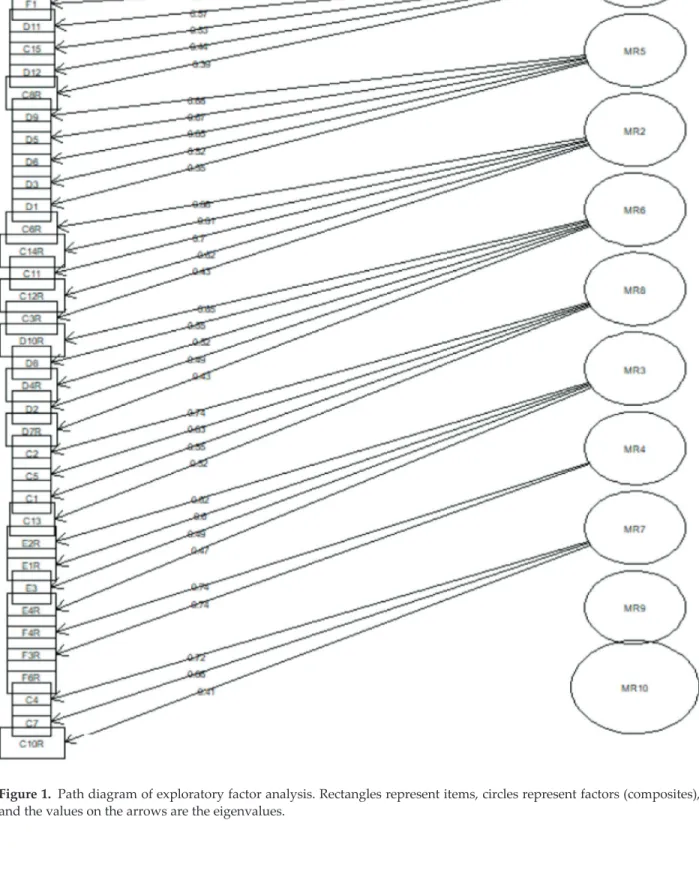
To examine whether a different structure would give a better fit to the data, an exploratory factor analysis was performed. To determine how many composites should be retained, it was obtained the path diagram in Figure 1, where a new structure is proposed. Eight composites were obtained with 37 items (item F6R was not considered since he had an eigenvalue lower than 0.4). Comparing this structure with the one proposed by MOSPSC, composites 1, 5, and 6 did not suffer any changes, composites 2 and 10 gained one item each, composite 4 lost 2 items, composite 8 gained one item and changed other, and composite 3 gained several items from composites 4, 7 and 9.
It was obtained the coefficients for internal consistency for the new proposed structure by EFA (Table 5). In a general way, it was obtained better internal consistency coefficients than with the original structure.
3.5. Confirmatory factor analysis
The fit of the data to the dimensional structure proposed in the original instrument was analyzed using structural equations models through confirmatory factor analysis (CFA). Cor-relations between composites are presented in Table 6, where it can be observed that there are
Composite No of items Cronbach’s α AIIC
1. Teamwork 4 0.82 0.53
2. Patient Care Tracking/Follow Up 4 0.71 0.38
3. Organization Learning 3 0.79 0.56
4. Overall Perceptions of Patient Safety and Quality 4 0.69 0.38
5. Staff Training 3 0.69 0.43
6. Owner/Managing Partner/Leadership Support for Patient Safety 4 0.69 0.36
7. Communication about Error 4 0.75 0.43
8. Communication Openness 4 0.73 0.40
9. Office Processes and Standardization 4 0.63 0.31
10. Work Pressure and Pace 4 0.75 0.42
Total 38 0.92 0.24
Figure 1. Path diagram of exploratory factor analysis. Rectangles represent items, circles represent factors (composites), and the values on the arrows are the eigenvalues.
high values between some composites. This will produce a nonpositive definite matrix of the covariances of the latent variables. In this sense, composite 9 was removed.
Figure 2 shows the relation of the individual items to the composites. The standardized path between coefficients shows the strength of these relations. A coefficient less than 0.1 indicates a low effect; coefficients around 0.3 indicate a medium effect, while large effects are suggested by coefficients higher or equal of 0.5. In this model, coefficients ranged between 0.45 and 0.87.
Composite No. of items Cronbach’s α AIIC
1. Teamwork* 4 0.82 0.53
2. Patient Care Tracking/Follow Up + 8. Communication Openness (D1) 5 0.73 0.35
3. Organization Learning + 7. Communication about Error (D11, D12) + 9. Office Processes and Standardization (C9, C15) + 4. Overall Perceptions of Patient Safety and Quality (F2)
8 0.88 0.48
4. Overall Perceptions of Patient Safety and Quality [F2, F6R] 2 0.76 0.61
5. Staff Training* 3 0.69 0.43
6. Owner/Managing Partner/Leadership Support for Patient Safety* 4 0.69 0.36 8. Communication Openness [D1] + 7. Communication about Error (D7R) + 2.
Patient Care Tracking/Follow Up (D8)
5 0.78 0.41
10. Work Pressure and Pace + 9. Office Processes and Standardization (C12R) 5 0.79 0.42
Total 38 0.92 0.243
*Composites who did not suffer any changes after EFA.
Curve brackets represent added items and rectangular brackets represent removed items from the composite.
Table 5. Internal consistency statistics after structure proposed by exploratory factor analysis.
1 2 3 4 5 6 7 8 9 10 1 1 2 0.495 1 3 0.758 0.588 1 4 0.591 0.533 0.859 1 5 0.570 0.368 0.538 0.516 1 6 0.405 0.302 0.520 0.515 0.549 1 7 0.736 0.679 0.841 0.659 0.499 0.487 1 8 0.788 0.622 0.773 0.648 0.498 0.463 0.893 1 9 0.820 0.606 0.929 0.765 0.669 0.571 0.798 0.763 1 10 0.147 0.117 0.191 0.270 0.357 0.326 0.230 0.153 0.530 1
Table 7 shows the fit of the confirmatory factor analysis for the model proposed in Figure 2. The indices CFI and GFI showed a very good fit; RMSEA and TLI showed a good fit and PGFI a reasonable fit.
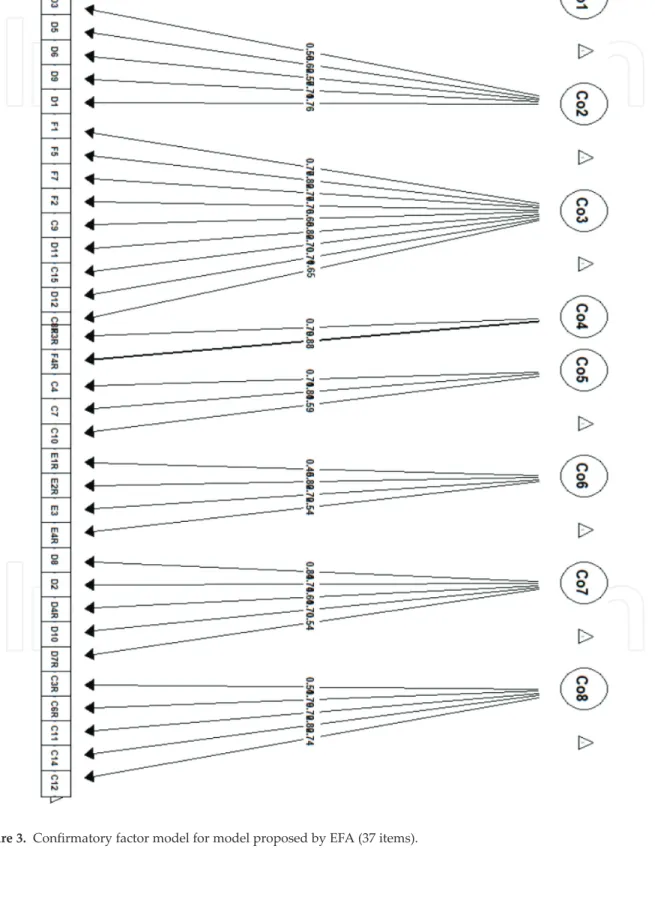
It was also obtained a good overall internal consistency (Cronbach’s α = 0.91, AICC = 0.243). Considering the model proposed by EFA (Figure 1), it was obtained the CFA model in Figure 3. In this model, coefficients ranged between 0.45 and 0.88.
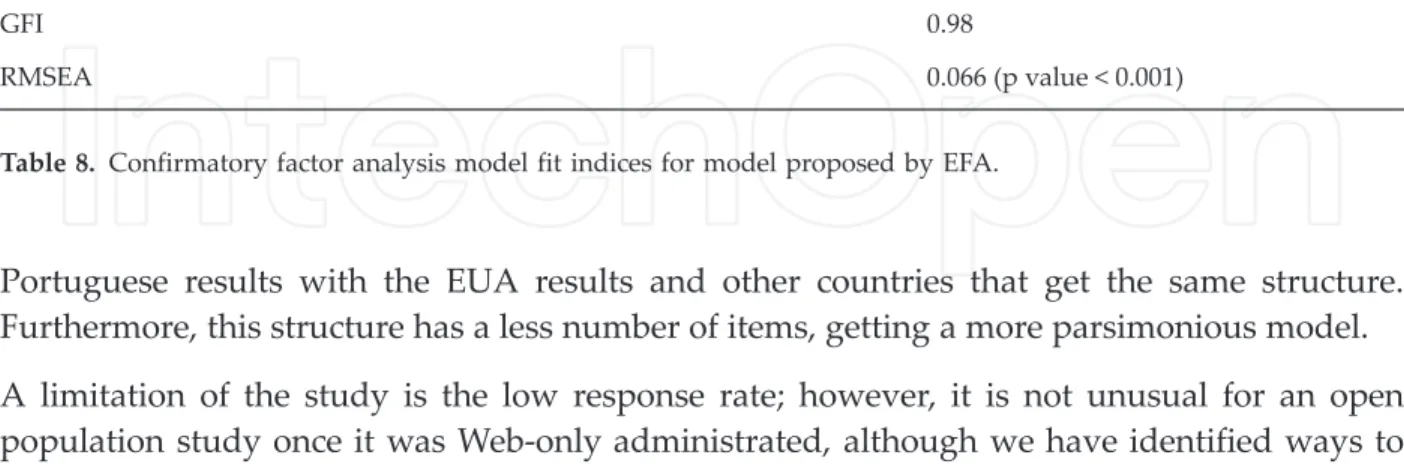
The goodness-of-fit indices (Table 8) obtained for EFA model (Figure 3) are very similar to the ones obtained for the model proposed in Figure 2.
4. Discussion
We have described the results of a translation, an adaptation, and a validation and analyzed the reliability of the Medical Office Survey on Patient Safety Culture in Portuguese Primary Health Care. As far as we know, this is the first study on patient safety culture in primary health care in Portugal with this depth of analysis of the structure of the survey proposed by the Medical Office Survey.
The lowest positive scores were found in composites Work Pressure and Pace, Owner/Managing Partner/Leadership Support for Patient Safety, and Staff Training. The composites with highest scores were Teamwork, Patient Care Tracking/Follow Up, and Organization Learning.
The original survey had a good overall consistency, where the composite Office Processes and Standardization had the lowest values on internal consistency statistics and the composite Teamworkthe highest. The exploratory factor analysis proposed a structure with eight compos-ites, where just one item was removed, and several items were spread out by the others composites. Through confirmatory factor analysis, it was obtained another model structure where the composite Office Processes and Standardization was removed, leading to a survey with nine composites with 34 items. In terms of goodness of fit and internal consistency, there were no substance differences, both achieved good internal consistency and very good fit. It was decided to choose the structure proposed by CFA, since the differences in terms of structure to the original one are only by the removal of one composite, allowing comparison of the
Goodness of fit indices Values
CFI 0.98
TLI 0.97
PGFI 0.69
GFI 0.99
RMSEA 0.064 (p value < 0.001)
Portuguese results with the EUA results and other countries that get the same structure. Furthermore, this structure has a less number of items, getting a more parsimonious model. A limitation of the study is the low response rate; however, it is not unusual for an open population study once it was Web-only administrated, although we have identified ways to publicize your survey and tracked response rates.
Another limitation of the study was the number of missing values. It reduced the representa-tiveness of the sample and can therefore distort inferences about the population. In future studies, the results will be compared using imputation methods on missing values and the impact on the results will be evaluated.
A strength of this study is the statistical method used, particularly in exploratory factor analysis and confirmatory factor analysis, since they are the most appropriate to the data type of this study, where bias was reduced. The majority of the studies on the context of this study still use methods assuming that data are continuous.
As it is well known in Portugal, the Directory of Health has been doing patient safety culture assessment every 2 years since 2014, which allows all health units to enhance patient safety.
5. Conclusions
The Portuguese version of the MOSPSC resulted in nine composites with good reliability and construct validity, where the structure differs from the original by removing one composite. In further studies, it will be performed longitudinal studies to evaluate the impact of patient safety culture interventions on staff and patients.
Patient safety culture assessment is of a vital importance for all levels of care. In Portugal, we are caring out this assessment every 2 years, which allows institutions to identify patient safety culture status in primary care, and it is also seen as an intervention to raise staff awareness about patient safety issues and a mechanism to evaluate the impact of patient safety improve-ment initiatives. This assessimprove-ment also allows primary care institutions to compare their patient safety culture survey results with others and is a way to track changes in patient safety culture over time.
Goodness of fit indices Values
CFI 0.98
TLI 0.97
PGFI 0.72
GFI 0.98
RMSEA 0.066 (p value < 0.001)
Acknowledgements
The authors would like to extend their gratitude to all staff that took time to complete the MOSPSC. This work is partially financed by national funds through FCT Fundação para a Ciência e a Tecnologia under the project UID/MAT/00006/2013 and by the Health and Tech-nology Research Centre (H&TRC).
Conflict of interest
The authors declare that there are no conflicts of interest.
Ethical approval
The research complied with every one of the dilemmas concerned with ethics. The privacy and secrecy or anonymity of staff made certain.
Author details
Margarida Eiras1*, Ana Escoval2and Carina Silva3
*Address all correspondence to: margarida.eiras@estesl.ipl.pt
1 Escola Superior de Tecnologia da Saúde de Lisboa - Instituto Politécnico de Lisboa, Health and Technology Research Center (H&TRC), Portugal
2 National Public Health School of New University of Lisbon, CHLC, CISP, Portugal
3 Escola Superior de Tecnologia da Saúde de Lisboa - Instituto Politécnico de Lisboa, Statistics and Applications Center of the University of Lisbon, Health and Technology Research Center (H&TRC), Portugal
References
[1] Kohn LT, Corrigan JM, Donaldson MS. To Err Is Human: Building a Safer Health System. Washington, D.C.: National Academies Press; 2000
[2] Council of the European Union. Recommendation of 9 June 2009 on Patient Safety, includ-ing the Prevention and Control of Healthcare Associated Infections. OJEU. 2009;C(151):1-6 [3] National Patient Safety Agency: Seven steps to patient safety for primary care; 2006. Available at: http://www.aneezesmail.co.uk/PDF%20files/1791_7StepsToPrimaryCareIn-troduction.pdf (accessed 25 may 2018)
[4] Vasconcelos PF, Arruda LP, Sousa Freire VEC, REFL C. Instruments for evaluation of safety culture in primary health care: integrative review of the literature. Public Health. 2018;156:147-151. DOI: 10.1016/j.puhe.2017.12.024
[5] Spencer R, Campbell SM. Tools for primary care patient safety: A narrative review. BMC Family Practice. 2014;15:166
[6] Verbakel N, Langelaan M, Verheij TJM, Wagner C, Zwart DLM. Improving patient safety culture in primary care: A systematic review. Journal of Patient Safety. 2016;12(3):152-158 [7] Stawicki SP, Firstenberg MS. Introductory Chapter: The Decades Long Quest Continues
Toward Better, Safer Healthcare Systems, Vignettes in Patient Safety2017. DOI: 10.5772/ intechopen.69354 Available from: https://www.intechopen.com/books/vignettes-in-patient- safety-volume-1/introductory-chapter-the-decades-long-quest-continues-toward-better-safer-healthcare-systems
[8] Sorra J, Gray L, Famolaro T, et al. AHRQ Medical Office Survey on Patient Safety Culture: User’s Guide. (Prepared by Westat, under Contract No. HHSA290201300003C). AHRQ Publication No. 15(16)-0051-EF (Replaces 08(09)-0059). Rockville, MD: Agency for Healthcare Research and Quality; June 2016 http://www.ahrq.gov/professionals/quality-patientsafety/ patientsafetyculture/medical-office/index.html
[9] Timm M, Rodrigues MC. Cross-cultural adaptation of safety culture tool for primary health care. Acta Paul Enferm. 2016;29(1):26-37. DOI: 10.1590/1982-0194201600005
[10] Parker D, Wensing M, Esmail A, Valderas JM. Measurement tools and process indicators of patient safety culture in primary care. A mixed methods study by the LINNEAUS collaboration on patient safety in primary care. European Journal of General Practice. 2015;21(Suppl 1):26-30. DOI: 10.3109/13814788.2015.1043732
[11] Dupie I, Nguyen Van Nhieu A: The medical office survey on patient safety culture MOSPSC: Opinions and views of EQuiP network general practitioners. http://equip.woncaeurope.org/ 8-working-groups/4-patient-safety
[12] Bland A, Altman G. Statistics notes: Cronbach’s alpha. British Medical Journal. 1997;314:572 [13] Field A. Discovering Statistics Using SPSS for Windows. London: SAGE publications; 2000 [14] Clark LA, Watson D. Constructing validity: Basic issues in objective scale development.
Psychological Assessment. 1995;7(3):309
[15] Baglin J. Improving your exploratory factor analysis for ordinal data: A demonstration using FACTOR. Practical Assessment, Research & Evaluation. 2014;19(5)
[16] Streiner DL. Figuring out factors: The use and misuse of factor analysis. The Canadian Journal of Psychiatry. 1994;39(3):135-140
[17] Revelle W. Psych: Procedures for Personality and Psychological Research. Northwestern University; 2018
[18] Fox J. The polycor Package: Polychoric and Polyserial Correlation. Version 0.7-1. 2016. Available at http://ftp.auckland.ac.nz/software/CRAN/ doc/packages/polycor.pdf (acessed 21 may 2018)
[19] Yves Rosseel lavaan. An R package for structural equation modeling. Journal of Statistical Software. 2012;48(2):1-36