UNIVERSIDADE DE LISBOA
Faculdade de Medicina Veterinária
THE IMPORTANCE OF CONSUMER PHASE MODELS IN QUANTITATIVE MICROBIOLOGICAL RISK ASSESSMENT
MARIA INÊS ARAÚJO NEVES
2016 LISBOA CONSTITUIÇÃO DO JÚRI:
Doutor Virgílio da Silva Almeida
Doutora Magda Alexandra Nobre Martins Aguiar de Andrade Fontes
Mestre Telmo Renato Landeiro Raposo Pina Nunes
ORIENTADOR Dr. Maarten J. Nauta
CO-ORIENTADOR
Mestre Telmo Renato Landeiro Raposo Pina Nunes
UNIVERSIDADE DE LISBOA
Faculdade de Medicina Veterinária
THE IMPORTANCE OF CONSUMER PHASE MODELS IN QUANTITATIVE MICROBIOLOGICAL RISK ASSESSMENT
MARIA INÊS ARAÚJO NEVES
DISSERTAÇÃO DE MESTRADO INTEGRADO EM MEDICINA VETERINÁRIA
CONSTITUIÇÃO DO JÚRI: Doutor Virgílio da Silva Almeida
Doutora Magda Alexandra Nobre Martins Aguiar de Andrade Fontes
Mestre Telmo Renato Landeiro Raposo Pina Nunes
ORIENTADOR Dr. Maarten J. Nauta
CO-ORIENTADOR
Mestre Telmo Renato Landeiro Raposo Pina Nunes
Acknowledgements
First, I would like to thank Maarten for being a supportive, professional and inspiring supervisor. His dedication and patience allowed me to learn so much in so little time through our regular meetings, and I am certain that this project would not have been completed without his supervision. Besides supervising my Master’s dissertation, Maarten also inspired me to follow a research career, which I am very grateful for.
I would also thank my co-supervisor Telmo, for triggering the opportunity to undertake an internship at the National Food Institute (DTU), and for all his support throughout this year. I thank him for our long conversations and take note of all his wise advice.
I am thankful to Sara Pires, for the academic and personal support during my stay at the National Food Institute. Since the warming welcoming in Denmark to the last day of the internship, she proved to be a friend that we could always rely on.
To my dear colleagues at the National Food Institute, who contributed to make my experience an amazing one, I am very grateful to all of you. To Eduardo for being always available to help me and for our great “Portuguese/Brazilian” conversations, to Sophie and Maria for all the time we spent together in Copenhagen and for being such good friends, and to João for the friendship and laughs. A special thank you goes to my dear friend Mafalda, for being with me in all kinds of situations that we faced in Denmark, and supporting me no matter what.
I will always be thankful to my wonderful G.Team and to my dear friend Rodrigo. I am lucky to have had your support in the happiest and most important moments of my life, and this one will not be an exception.
Thanks to Gonçalo, for the motivation and love, and to Carolina, for being the best friend one could ask for.
I could not be more grateful to my family for allowing me to follow my dreams. This internship and dissertation would not have been completed without their support.
Finally and most important, I thank my mother and sister, my biggest support and inspiration in life. For helping me to become a better person each day, loving me and teaching me to love myself more, for believing in my capabilities, and for never questioning my career choices.
Abstract
The importance of consumer phase models in quantitative microbiological
risk assessment
In quantitative microbiological risk assessment (QMRA), the consumer phase model (CPM) describes the part of the food chain from purchase of the food product at retail to the moment of consumption. The large variation in consumer food handling practices and scarce availability of data imply that several simplifying assumptions are made when a CPM is constructed. In the development of a CPM, it is relevant to understand to what extent these models need to include a detailed description of the processes that may result in exposure. The study from Nauta et al. (2009), suggests that “There is no alternative but for a probabilistic approach to risk assessment models of the consumer phase”. The purpose of this study is to compare the results given by seven published stochastic CPMs found in the literature for Campylobacter, Salmonella and Listeria monocytogenes, with two simpler modelling techniques: a constant value “a-factor” (Duarte, Nauta, & Aabo, 2016) and deterministic CPMs, which don’t include variation. The modelling techniques are compared by means of absolute risk estimates and relative risk estimates. It was found that the “a-factor” estimates similar absolute risks to the stochastic CPMs, but different relative risks from all the stochastic CPMs. Results also showed that deterministic CPMs estimate different absolute risks from all the stochastic CPMs. Regarding relative risks, it was observed that four in a total of seven deterministic CPMs showed similar results in all the intervention scenarios simulated to the corresponding stochastic CPM. In these four scenarios, deterministic CPMs could be used to assess the effect on the risk of intervention scenarios in the food production chain. It is not clear which situations and assumptions interfere with the results obtained when a deterministic CPM estimates similar or different relative risks from a stochastic CPM. Answering these questions would require more in depth studies about the role and performance of deterministic CPMs in QMRA.
Keywords: Campylobacter, consumer phase model, deterministic, food microbiology,
Resumo
A importância de modelos da fase do consumidor em avaliação quantitativa
de risco microbiológico
Em avaliação quantitativa de risco microbiológico (AQRM), um modelo da fase do consumidor (MFC), descreve a etapa da cadeia de produção de alimentos desde a compra do produto alimentício até ao momento do seu consumo. Devido à variação considerável existente nas práticas de preparação de alimentos e de escassa disponibilidade de dados nesta fase, na construção de um modelo da fase do consumidor é necessário incluir várias suposições subjectivas no âmbito de simplificar este processo. Na construção de um MFC, é necessário compreender em que medida é que este necessita de incluir descrições detalhadas dos processos que resultam em exposição. O estudo realizado por Nauta et al. (2009) sugere que devem ser sempre usados modelos estocásticos em AQRM para caracterizar a fase do consumidor. O objectivo deste estudo é comparar resultados obtidos por sete modelos estocásticos da fase do consumidor publicados para os microorganismos Campylobacter, Salmonella e Listeria monocytogenes, com duas técnicas simplificadas (“a-factor” presente no estudo de Duarte, Nauta, & Aabo, (2016) e MFC determinísticos), cujos modelos não incluem variação. As diferentes técnicas são comparadas em termos de risco absoluto e risco relativo. Verificou-se que a constante “a-factor” estima riscos absolutos semelhantes aos estimados por um modelo estocástico, mas diferentes riscos relativos em todos cenários simulados. Os resultados obtidos também demonstram que os MFC determinísticos estimam riscos absolutos diferentes de todos os modelos estocásticos. Relativamente aos riscos relativos, observou-se que quatro num total de sete MFC determinísticos calcularam resultados semelhantes aos modelos estocásticos correspondentes. Nestes quatro cenários, seria aceitável utilizar MFC determinísticos para estimar o efeito de intervenções na cadeia de produção de alimentos no risco final. Não foi possível esclarecer quais as situações ou suposições que interferem com os resultados obtidos quando um MFC determinístico estima riscos relativos semelhantes ou distintos do modelo estocástico. Dar resposta a estas questões implica a realização de estudos mais aprofundados sobre o papel e desempenho de MFC determinísticos em AQRM.
Palavras-chave: Avaliação de risco, Campylobacter, determinístico, estocástico,
Table of Contents
Internship Report ... 1 I. Review on microbiological risk assessment ... 2 1. Introduction ... 2 2. Purposes of microbiological risk assessment ... 2 2.1 Risk definition and how to measure it ... 3 3. History of microbiological risk assessment ... 3 4. Risk assessment framework ... 4 5. Components of microbiological risk assessment: ... 5 5.1 Statement of purpose ... 6 5.2 Hazard identification ... 6 5.3 Exposure assessment ... 6 5.5 Risk characterization ... 9 6. Quantitative risk assessment ... 10 6.1 Stochastic versus deterministic risk assessment ... 11 II. The importance of consumer phase models in quantitative microbiological risk assessment ... 16 1. Introduction ... 16 2. Purpose of the project ... 18 3. Materials and methods ... 19 3.2 Modelling approach using a surrogate “a-factor” ... 32 3.3 Modelling approach using deterministic CPMs ... 38 4. Models performance analysis ... 40 4.1 Absolute risk estimates ... 40 4.2 Relative risk estimates ... 40 4.3 A comparison of the absolute risk estimates ... 41 4.4 A comparison of the relative risk estimates ... 44 III. Discussion ... 56 1. Purpose of the study ... 56 2. “a factor” versus stochastic CPMs ... 56 2.1 A comparison of the absolute risk estimates ... 57 2.2 A comparison of the relative risk estimates ... 57 3. Deterministic CPMs versus stochastic CPMs ... 58 3.1 A comparison of the absolute risk estimates ... 59 3.2 A comparison of the relative risk estimates ... 59 4. Modelling limitations ... 61 IV. Conclusion ... 62 VI. References: ... 64 V. Annexes ... 72 Annex I ... 72 Annex II ... 73 Annex III ... 86 Annex IV ... 88List of Figures
Figure 1: Risk Analysis Framework………...5
Figure 2: Steps of microbial food safety risk assessment...6
Figure 3: Mathematical models (Exponential and Beta-Poisson) that have been used to empirically describe dose-response data for foodborne pathogenic bacteria...10
Figure 4: Comparison between a point-estimate and a probability distribution to characterize a data set………...13
Figure 5: Illustration of Monte Carlo simulation that shows a simulation to determine the concentration of a pathogen in a food product...15
Figure 6: Elements of a ‘farm-to-fork’ risk assessment...17
Figure 7: Schematic representation of Bollaerts CPM...27
Figure 8: Schematic representation of EFSA CPM...29
Figure 9: Schematic representation of Murmann CPM...30
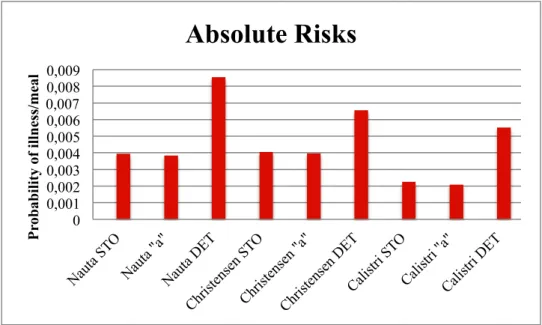
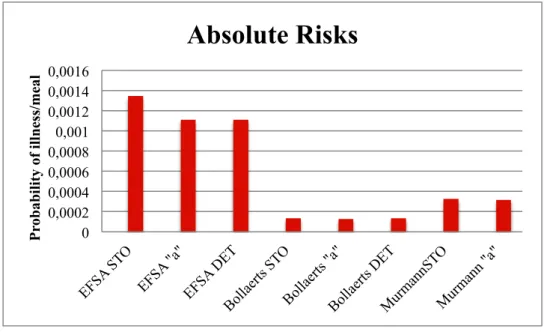
Figure 10: Illustration of the absolute risks obtained using three different modelling approaches for Campylobacter...43
Figure 11: Illustration of the absolute risks obtained using three different modelling approaches for Salmonella...44
Figure 12: Illustration of the absolute risks obtained using three different modelling approaches for L. monocytogenes...44
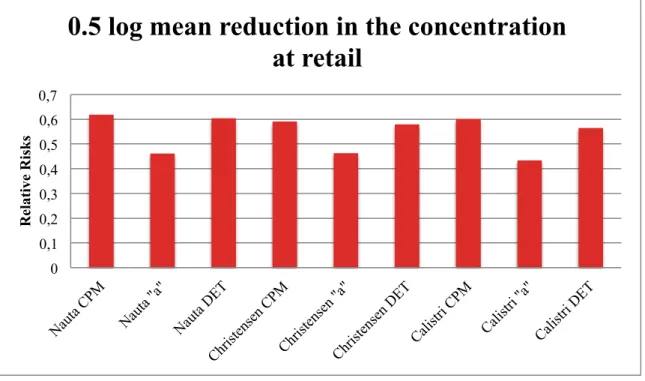
Figure 13: Illustration of the relative risks obtained by simulation of an intervention scenario of 0.5 log reduction in the mean of the concentration at retail of Campylobacter...46
Figure 14: Illustration of the relative risks obtained by simulation of an intervention scenario of 1 log reduction in the mean of the concentration at retail of Campylobacter...47
Figure 15: Illustration of the relative risks obtained by simulation of an intervention scenario of 0.5 reduction in the standard deviation of the concentration at retail of Campylobacter...47
Figure 16: Illustration of the relative risks obtained by simulation of an intervention scenario of increasing by 0.5 the standard deviation of the concentration at retail of Campylobacter...48
Figure 17: Illustration of the relative risks obtained by simulation of an intervention scenario of 0.5 log reduction in the mean of the concentration at retail of Salmonella...50
Figure 18: Illustration of the relative risks obtained by simulation of an intervention scenario of 1 log reduction in the mean of the concentration at retail of Salmonella...50
Figure 19: Illustration of the relative risks obtained by simulation of an intervention scenario of 0.5 reduction in the standard deviation of the concentration at retail of Salmonella...51
Figure 20: Illustration of the relative risks obtained by simulation of an intervention scenario of an increase by 0.5 of the standard deviation of the concentration at retail of Salmonella...51
Figure 21: Illustration of the relative risks obtained by simulation of an intervention scenario of a 0.5 log reduction in the mean of the concentration at retail of L. monocytogenes...53
Figure 22: Illustration of the relative risks obtained by simulation of an intervention scenario
Figure 23: Illustration of the relative risks obtained by simulation of an intervention scenario
of a 0.5 reduction in the standard deviation of the concentration at retail of L. monocytogenes...54
Figure 24: Illustration of the relative risks obtained by simulation of an intervention scenario
of an increase of the standard deviation by 0.5 in the concentration at retail of L. monocytogenes………...………...54
Figure 25: Illustration of the relative risks obtained by simulation of an intervention scenario
of a reduction of the prevalence of Campylobacter at retail by 10%...Annex IV
Figure 26: Illustration of the relative risks obtained by simulation of an intervention scenario
of an increase of the prevalence of Campylobacter at retail by 50%...Annex IV
Figure 27: Illustration of the relative risks obtained by simulation of an intervention scenario
of a reduction of the prevalence of Salmonella at retail by 10%...Annex IV
Figure 28: Illustration of the relative risks obtained by simulation of an intervention scenario
of an increase of the prevalence of Salmonella at retail by 10%...Annex IV
Figure 29: Illustration of the relative risks obtained by simulation of an intervention scenario
of a reduction of the prevalence of L. monocytogenes at retail of by 10%...Annex IV
Figure 30: Illustration of the relative risks obtained by simulation of an intervention scenario
List of Tables
Table 1: Details of the inputs used to estimate the “a-factor” for Nauta, Christensen and
Calistri CPMs...35
Table 2: Description of the values of each “a-factor” obtained for Nauta, Christensen and
Calistri CPMs………….………...………...35
Table 3: Details of the inputs used to estimate the “a-factor” for Bollaerts, EFSA and
Murmann CPMs………...………..………….37
Table 4: Description of the values of each “a-factor” obtained for Bollaerts, EFSA and
Murmann CPMs...37
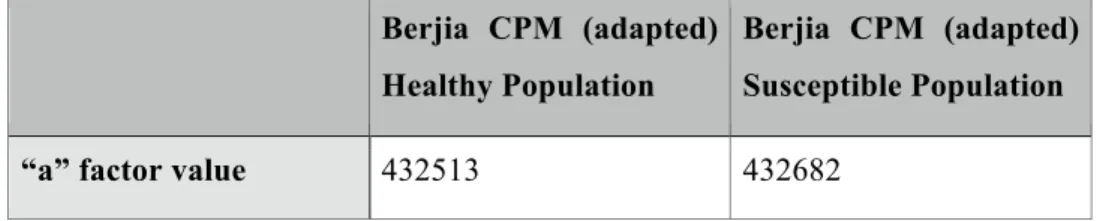
Table 5: Details of the inputs used to estimate the “a-factor” for Berjia CPM (adapted)
CPM...38
Table 6: Description of the values of each “a-factor” obtained for Berjia CPM (adapted)
CPM...38
Table 7: Overview of the results: Comparison of the performance of the results obtained by
using an “a-factor” and deterministic CPM with a stochastic CPM in terms of (almost) equal (=), increased (+) or decreased absolute risk………...……….55
Table 8: Overview of the results: Comparison of the performance of the results obtained by
using an “a-factor” and deterministic CPM with a stochastic CPM in terms of (almost) equal (=), increased (+) or decreased relative risk of four intervention scenarios. …….…………..56
Table 9: Description of the values and distributions used in Nauta stochastic CPM and Nauta
deterministic CPM...Annex II
Table 10: Description of the values and distributions used in Christensen stochastic CPM and
Christensen deterministic CPM...Annex II
Table 11: Description of the values and distributions used in Calistri stochastic CPM and
Calistri deterministic CPM...Annex II
Table 12: Description of the values and distributions used in Bollaerts stochastic CPM and
Bollaerts deterministic CPM...Annex II
Table 13: Description of the values and distributions used in EFSA stochastic CPM and
EFSA deterministic CPM...Annex II
Table 14: Description of the values distributions used in Murmann stochastic
CPM...Annex II
Table 15: Description of the values and distributions used in the adapted stochastic CPM
from Berjia...Annex II
Table 16: Description of the values and distributions used in Berjia deterministic
CPM...Annex II
Table 17: Results of the Relative Risks obtained after simulation of six hypothetical
intervention scenarios in the food production chain, for Campylobacter CPMs...Annex III
Table 18: Results of the Relative Risks obtained after simulation of six hypothetical
intervention scenarios in the food production chain, for Salmonella CPMs………...………...………..Annex III
Table 19: Results of the Relative Risks obtained after simulation of six hypothetical
intervention scenarios in the food production chain, for L. monocytogenes CPMs...Annex III
List of Abbreviations and Symbols
CFU – colony forming units CSS- cold smoked salmon CPM- consumer phase model D-1- per day
QMRA- quantitative microbiological risk assessment MPD – maximum population density
MRA – microbiological risk assessment RTE- ready to eat food
RR- relative risks SD- standard deviation
Internship Report
As part of the Integrated Master’s Degree in Veterinary Medicine from the Faculty of Veterinary Medicine, University of Lisbon, I completed two internships with a total duration of six months.
The first internship took place in the Faculty of Veterinary Medicine in the University of Lisbon, from October to January. I was supervised by my co-supervisor, Telmo Nunes, and performed tasks in the areas of epidemiology and food safety risk assessment. During these months, I acquired valuable skills that were essential to prepare for my second internship in Denmark. I performed statistical data analysis in the software “R” and did literature review in food safety risk assessment and in specific consumer phase models, to have more in depth knowledge on the subject before heading to Denmark.
The second internship took place at the National Food Institute, Technical University of Denmark, for three and a half months (from January and April). In this institute work researchers from all over the world, who perform studies in the areas of food safety, toxicology, food microbiology, microbiological risk assessments, risk benefits assessment and nutrition. I had the opportunity to experience a new working environment and interact with highly dedicated scientists on a daily basis. The atmosphere was friendly and people were welcoming, which contributed to make my experience a memorable one.
During my internship, I was supervised by Dr. Maarten Nauta for my Master’s dissertation about “the Importance of consumer phase models in Quantitative Microbiological Risk Assessment”. With the support from Maarten and due to our weekly meetings, I was able to gain a broad range of skills in a short period of time. I performed literature review and critical analysis on the subject of Quantitative Microbiological Risk Assessment and specifically analysed different consumer phase models in the literature to include in my project. I also learnt advanced risk assessment and modelling techniques by implementing some of the models in Excel spread sheets using Monte Carlo software @risk 5.5 (Palisade). I gained valuable knowledge on interpreting the results obtained from risk assessment modelling techniques accurately, in order to improve food safety.
At the end of my internship in Denmark, I had the opportunity share in more detail the type of work performed during the internship and the results obtained in an oral presentation. This presentation allowed me to practice my oral presentation skills, as well as to think critically and answering questions related to the study conducted.
I. Review on microbiological risk assessment
1. Introduction
Zoonotic diseases may be transferred from animals to humans through the production, handling and consumption of contaminated foods, and are considered a significant and widespread global public health threat. In the European Union (EU), over 320,000 human cases are reported each year, but it is likely that the real number is in fact much higher. Campylobacter spp., Sealmonella spp., and Listeria monocytogenes are important pathogenic microorganisms that cause foodborne diseases in humans. In 2014, Campylobacter was the most commonly reported gastrointestinal bacterial pathogen in humans in the European Union (EU), and has been so since 2005. The number of reported confirmed cases of human campylobacteriosis in the EU in 2014 was 236.851. In the same year, Salmonella was the second most commonly reported gastrointestinal bacterial pathogen in humans in the EU, with a total of 88.715 confirmed salmonellosis cases reported. Listeriosis has had a statistically significant increase over 2008-2014, with 2.161 confirmed human cases of listeriosis in the EU in 2014 (EFSA-ECDC, 2015).
Assessing risks in the food chain and assuring food safety is a challenging task in the current highly globalized world (Quested et al., 2010). Global changes such as international trade of food and animal feed, international travel and migration, population growth, poverty, aging population and newly emerging pathogens, are important factors that influence incidence and profile of food borne illnesses (Miyagishima & Ka ̈ferstein, 2003). International bodies such as World Trade Organization, World Health Organization, Food and Agricultural Organization of the United Nations and the Codex Alimentarius, promote the of use scientific-based approaches to prevent food borne illness. This implies an increasing use of risk assessment, a systematic tool used to develop consistent and science-based standards for international trade (Codex Alimentarius Commission, 1999; World Health Organization, 1995).
2. Purposes of microbiological risk assessment
As the production, processing, distribution, marketing, preparation, and consumption of food is a complex and interdependent activity, it is important to stress that food safety is assured through a pragmatic management of a broad array of potential risks. Food safety risks can be controlled by implementation of good hygienic practices (GHPs) and through the hazard analysis of critical control point (HACCP) system. HACCP is a “risk management system based on an evaluation of hazards that are reasonably likely to occur, followed by the
implementation of mitigations to control those hazards to an acceptable level” (Heredia et al., 2008). There are several steps in the food production chain at which control can be applied to prevent or eliminate a food safety hazard or reduce it to an acceptable level. These are called critical control points (CCP), and can only be identified through a deep understanding of the dynamics of microbial composition in food during processing. (CAC, 1997; Heredia et al., 2008; Kilsby and Pugh, 1981).
Microbiological risk assessment (MRA) tools allow to measure the risk of foodborne infection associated to the consumption of contaminated food, by providing a framework to model microbial changes along the food chain. It is stated by (Buchanan & Whiting, 1998), that if MRA is associated with HACCP, has an enormous potential to relate operations in food manufacturing to public health demands.
The information obtained in a MRA is used to support risk-based management decisions, to establish standards for food in international trade, for evaluation of proposed management and intervention strategies, by measuring the risk reduction potential of various risk control options, highlighting data and information gaps and identifying research needs. (Havelaar et al., 2008; Heredia et al., 2008; Lammerding & Paoli, 1997)
2.1 Risk definition and how to measure it
Risk is defined as “a function of the probability of an adverse health effect and the severity of that effect, consequential to a hazard(s) in food” (CAC, 2011). In 1995, the Codex Alimentarius defined risk assessment as “the estimation of the severity and likelihood of harm or damage, resulting from exposure to hazardous agents or substances” (Food and Agriculture Organization of the United Nations/WHO, 1995).
In MRA, these hazardous agents and substances represent microorganisms and/or their toxins. The final output of a risk assessment, i.e., the risk, is obtained by combining data and analytical models, that measure the probability of human exposure to pathogenic microorganisms and the degree of human response to that exposure (Heredia et al.,2008).
3. History of microbiological risk assessment
It is known that for long, efforts have been made to assess and measure risks attributed to hazards in the food production chain. As early as in 1983, the use of risk assessment was promoted by the National Research Council (NRC), United States, to support the scientific basis of risk-based decision making. A report entitled “Risk Assessment in the Federal Government: Managing the Process”, formalized for the first time the basic concepts of risk
international trade disputes, due to the increasing growth of the global food trade verified in the mid 1990s (WHO, 1995). MRA was one of the strategies used to evaluate food borne illnesses and manage food safety risks. In 1996, a document on principles and guidelines for risk assessment was published by FAO/WHO Joint Expert Consultation for the Codex Committee on Food Hygiene (CCFH) (CCFH, 1996). In the same year, a framework for conducting microbiological risk assessments was also published by the International Life Sciences Institute (ILSI).
The first quantitative microbiological risk assessment (QMRA) of a food chain was published in 1997. It concerned E. coli O157:H7 in hamburgers (Cassin et al., 1998). Since that, several QMRAs have been conducted by international organizations, industry groups and national governments, and nowadays, this tool is consistently used to support free trade and ensure public health. (Schroeder et al., 2007).
4. Risk assessment framework
MRA is one of the three components of the risk analysis paradigm, along with risk management and risk communication (Voysey & Brown, 2000). Fig.1 describes the risk analysis framework and the interactions between the three components.
Risk management consists in the analysis of policy alternatives based on the results of risk assessments, and selecting and implementing appropriate control measures (including regulatory measures), if required.
Risk assessment is the scientific evaluation of actual or potential adverse health effects in humans, following exposure to hazards.
Risk communication involves an exchange of information between risk assessors, risk managers, consumers, industry and other interested parties, for subjects regarding risk and risk management processes (CAC, 1999).
5. Components of microbiological risk assessment:
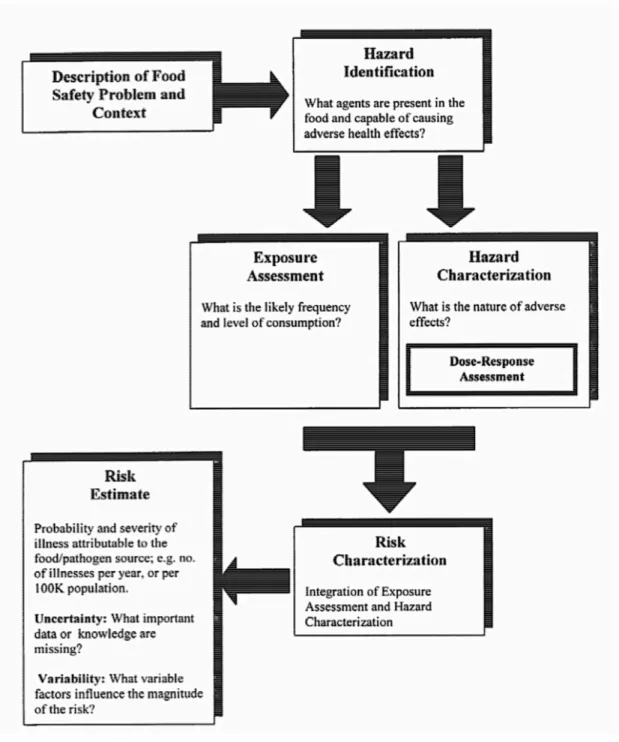
The four cornerstones of MRA, defined as hazard identification, exposure assessment, hazard characterization (dose–response), and risk characterization (FAO/WHO, 1999) are described in Figure 2.
5.1 Statement of purpose
Prior to starting a risk assessment, the purpose of the study should be clearly defined. The output form of a risk assessment and possible output alternatives should also be defined. Examples of output forms include: estimate of the prevalence of illness, estimate of annual rate (incidence of human illness per 100,000) or estimate of the rate of human illness and severity per eating occurrence (CAC, 1999).
5.2 Hazard identification
The first step in a formal risk assessment is hazard identification. In a MRA, this activity aims to identify the microorganisms or the microbial toxins that may be present in a specific food and the adverse health effects that can possibly occur due to its presence. (CAC,1999; Center for Disease Control and Prevention, 2005).
The process of hazard identification is predominantly qualitative. To identify hazards, search is conducted on relevant data sources. To obtain information on these hazards, search is conducted in the scientific literature, in databases from the food industry, government agencies or relevant international organizations, and through elicitation of expert opinion. (CAC, 1999).
5.3 Exposure assessment
According to the Codex Alimentarius Comission (1999), this step includes an assessment of the magnitude of actual or anticipated human exposure. In MRA, the exposure assessment might consider the potential extent contamination of food by microorganisms or its toxins, as well as the dietary information. The unit of food that is of interest, i.e., the portion size in most/all cases of acute illness should be specified in this step.
Several factors should be considered when conducting an exposure assessment. The frequency of contamination of foods by the pathogenic agent, its level in foods over time are greatly influenced by intrinsic characteristics of the pathogen, microbiological interactions in the food environment, the initial contamination of the pathogen in the raw material, the type and extent of sanitation and process controls, the methods of processing, packaging, distribution and storage of the foods, and food preparation steps (i.e, cooking and storage). Patterns of food consumption should also be considered in this step. They are determined by the consumers’ socio-economic and cultural background, their ethnicity, age (population demographics), regional location, preferences and behaviour. Specific groups, such as infants, children, pregnant women, elderly or immunocompromised individuals, who can be more susceptible to infection or illness than the rest of the population, should also be included in an exposure assessment whenever possible (Gerba et al., 1996). The possibility of food handlers
to act as a source of contamination should also be taken into account, as well as the extent of contact between their hands and the product, and the potential impact of abusive environmental factors like time and temperature (CAC, 1999).
It is important to realize the existing dynamics of the levels of microbial pathogens in food. While levels might be low during food processing due to proper time and temperature controls, they can increase considerably in the following processes of the food chain if these conditions are not controlled (Heredia et al., 2008). Therefore, in the exposure assessment, the transmission of the hazard is often modeled through the food pathway, which includes a series of processes from the source of the raw ingredients (e.g., the farm) to the moment of consumption (Nauta, 2000). Modelling hazard transmission usually involves separating the food pathway into unit operations. These describe the treatments applied to the ingredients during their conversion into food and what is their impact in the hazard. Data is found through direct observation (e.g., surveillance studies measuring the changes in hazards in a production environment), laboratory experimentation (eg. simulation in the laboratory of the processes occurring during manufacturing), or mathematical modelling based on established physicochemical principles (e.g., thermodynamic relationship associated with a heat process) to allow an identification of an input–output relationship for each operation unit (Notermans et al., 1998).
In the exposure assessment, scenarios simulating intervention measures in the food pathway can predict a range of possible exposures. Interventions measures can include the effects of processing (i.e, hygienic design, cleaning and disinfection) but also time/temperature and other conditions of the food history. Food handling, consumption patterns, regulatory controls, and surveillance systems can also be modeled in this step (CAC, 1999).
5.3.1 Predictive microbiology
It is known that numbers of bacteria in food can change at all stages of the food pathway, depending on several factors. The presence, growth, survival, or death of microorganisms in food, can be influenced by the type of food and the way it is handled, stored, and processed. Predictive microbiology tools allow to estimate changes in bacterial numbers (Heredia et al., 2008). The study from McMeekin et al. (1993) describes predictive microbiology as a scientific discipline where microbial behaviour (e.g., growth, survival, inactivation) is predicted as a function of environmental factors. In predictive microbiology, mathematical models are used to predict in a quantitative estimate the increase or decrease in concentrations
Predictive models can be classified as primary or secondary level models, depending on the degree of precision and sensitivity to environmental factors (Whiting & Buchanan, 1994). Primary models are usually developed in first place to determine the impact of the responses of interest, like the maximum specific growth rate, lag phase duration, or death rate. Afterwards, a secondary model is constructed, which shows the dependence of these factors on environmental conditions. Primary and secondary models can be combined to obtain tertiary models with the use of advanced software packages and expert systems (Buchanan & Whiting, 1998: Ross et al., 2000).
Predictive microbial models allow an estimation of changes in the concentration of the microorganism in the different step of the food pathway, like production, processing and preparation. This information is used by food manufacturers and food safety authorities for developing and evaluating production processes, determining shelf life and setting food safety standards (Bott, 2014; Foegeding, 1997).
5.4 Hazard characterization (dose-response)
Hazard characterization describes the severity and duration of adverse effects that may result from the ingestion of a microorganism or its toxin in food, either qualitatively or quantitatively. The severity and duration of adverse health effects can vary a lot within the population after exposure to food borne pathogens, due to several factors. Factors that should be considered in a hazard characterization are the virulence characteristics of the pathogen, the numbers of cells ingested, the general health and immune status of the hosts, and the attributes of the food that alter microbial or host status. In addition, the likelihood that an individual becomes ill due to an exposure to a foodborne pathogen depends on the integration of host, pathogen, and food matrix effects (Buchanan et al., 2000).
Mathematical models have been used to describe dose-response relationships. (Buchanan et al., 2000) The exponential (Table 1, Eq. (1)) and beta-Poisson (Table 1, Eq. (2)), are two of the most used models to describe dose-response relationships. They were initially introduced by (Haas, 1983), and have been used over the years, for different classes of biological agents (Buchanan et al., 1997; Coleman & Marks, 1998; Crockett et al., 1996; Haas, 1983; Medema et al., 1996; Rose & Gerba, 1991).
In the exponential model it is assumed that the probability of a cell causing infection is independent of dose, whereas in the beta-Poisson it is assumed that infectivity is dose dependent.(Haas, 1983).
Expert elicitation could be included in a hazard characterization when a dose-response relationship is not known. These can give insight in considering factors like infectivity and to devise ranking systems that describe severity and/or duration of disease.(CAC, 1999).
5.5 Risk characterization
In this step, qualitative or quantitative information obtained from the hazard identification, hazard characterization, and exposure assessment are combined to obtain a risk estimate. This results in a qualitative or quantitative estimate of the probability and severity of adverse health effects in a given population, taking uncertainties in to account and describing them accordingly. Information can be obtained through suitable data or expert judgements. Estimates can be assessed through further comparison with independent epidemiological data that relates hazards to disease prevalence. It is important to stress that the final assessment of the risk will be influenced by all the assumptions made in the previous steps, as well as variability and uncertainty. (CAC, 1999)
Figure 3: Mathematical models (Exponential and Beta-Poisson) that have been used to empirically describe dose-response data for foodborne pathogenic bacteria. (From: Buchanan et al., (2000)).
5.5.1 Variability and uncertainty
Variability represents the true heterogeneity of the population of subjects considered, and it can be observed and quantified. As it is a consequence of the physical system, it can not be reduced by adding further measurements. Stochasticity and inter-individual variability are two types of variability. Stochasticity occurs when heterogeneity is a consequence of randomness (eg. the result of throwing a dice). Inter-individual variability describes the differences between individuals of a population (eg. the variability of children’s heights in school class), which is influenced by genetics, nutrition, other environmental conditions, but also some randomness. Uncertainty is described as a lack of perfect knowledge, meaning that increasing knowledge by implementing further measurements, for example, can help to reduce it (Anderson & Hattis, 1999; Bott, 2014; Murphy, 1998);
In addition to accounting for variability and uncertainty, it is important to assess the influence of the estimates and assumptions used in a risk assessment. In a quantitative risk assessment this is achieved by conducting sensitivity and uncertainty analyses (CAC, 1999).
6. Quantitative risk assessment
Risk assessment can be qualitative or quantitative (CAC, 1999). Qualitative risk assessments are descriptive or categorical treatments of information. Quantitative assessments are mathematical expressions or models that describe the probability of occurrence of an adverse effect. Models are simplified representations of a part of reality (Coleman & Marks, 1998; Alban et al., 2002; Haas et al., 2014; Havelaar et al., 2008). Considering the objectives of the risk assessment and the data available, two types of mathematical models are combined: exposure assessment models and dose-response models (Heredia et al., 2008).
If quantitative information and resources are available, it is preferable to conduct a quantitative risk assessment. If, however, there are limitations regarding data, time and / or other resources, conducting a qualitative risk assessment may be the only option. Qualitative assessments may be used for an initial evaluation of a food safety issue, to evaluate if a specific risk is significant enough and requires more detailed analysis. In a quantitative risk assessment, by combining the likelihood and magnitude of each harm, one is able to quantify the risk of each individual getting ill (Alban et al., 2002; Haas et al., 2014; Nauta & Havelaar, 2008).
Quantitative Microbiological Risk Assessment (QMRA) is used to support several risk management purposes (Nauta et al., 2009). Although it can be used to assess the human health risk associated with the ingestion of microorganisms in food in terms of estimated human
incidence, it is generally not the best tool to use for this purpose. This is explained due to the uncertainty present in the exposure assessment and the dose-response relation. For this purpose, epidemiological data may offer better tools to assess the baseline risk estimate. (Havelaar et al., 2007).
QMRA is also used to assess the effects of intervention measures in the food pathway that aim to reduce risk. If QMRA covers all the food chain, it allows risk managers to compare the evaluation of control measures implemented in all the food chain (Nauta et al., 2009). Intervention measures are assessed considering absolute risks and relative risk reduction. Absolute risk is the risk estimate itself, which will be a lower risk after implementation of an intervention measure. Relative risk is the ratio of the lower incidence estimate and the incidence estimate without intervention. The lower the relative risk, the higher the risk reduction is in an intervention scenario compared to the baseline. As relative risk is associated with less uncertainty than absolute risk, it is considered a more valuable statistic than absolute risk estimates (Nauta et al., 2005b; Duarte et al., 2016).
The efficiency of intervention measures implemented in the food production chain can also be assessed when conducting a QMRA. By incorporating costs of intervention measures, the risk assessor is able to compare the effectiveness of different intervention in reducing human health risks. A balance between costs and benefits of intervention measures can be achieved when costs are incorporated in a QMRA. (Havelaar et al., 2007; Nauta & Havelaar, 2008).
6.1 Stochastic versus deterministic risk assessment
Risk assessment models can be deterministic/‘point estimate’ or stochastic/‘probabilistic’. Deterministic models use single values to describe the inputs that impact the final outcome. Therefore, the risk estimate that they produce is a single value, which can be the average or a worst-case scenario, for example. Probabilistic models use probability distributions to describe the inputs that influence the final outcome. For that reason, the risk estimate produced is a distribution describing a range of values of the risks that an individual or a population might experience. (Heredia et al., 2008; Lammerding & Fazil, 2000). Probability distributions can be attributed based on empirical data, understanding the basic biological phenomena, or on expert opinion elicitation, when there are no other sources of information (Vose, 1998).
Despite the fact that probabilistic models are more complex than deterministic models, they are the preferred method of choice for quantitative risk assessments. This is because variability and uncertainty, described previously in this study, are ignored in a deterministic
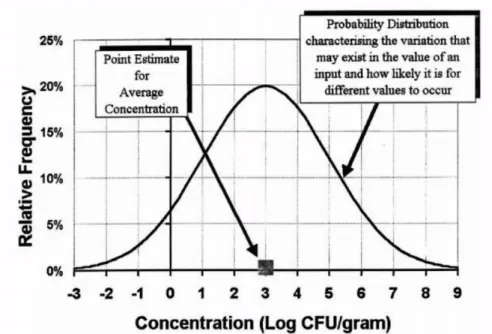
necessity of including variability and uncertainty is based on the fact that it is unlikely that microbial risks that affect human health are uniformly distributed and that ‘average’ episodes or events are likely to cause significant problems (Potter, 1994). Risk management decisions should take into account the extremes of the distributions, the likelihood of occurrence of such events and who might be affected. Figure 4 illustrates the difference between a point-estimate and a probability distribution to describe an input. In this hypothetical example, the graph describes the concentration of a pathogen in a unit of food. The deterministic approach specifies a single value that a parameter could take, while the stochastic approach specifies a range of values that a parameter can take, and how frequently these different values can occur. When a single point value is used to describe a complete data set, it is observed that a considerable amount of information is lost. (Lammerding & Fazil, 2000).
Figure 4: Comparison between a point-estimate and a probability distribution to
6.1.1 Monte Carlo simulation
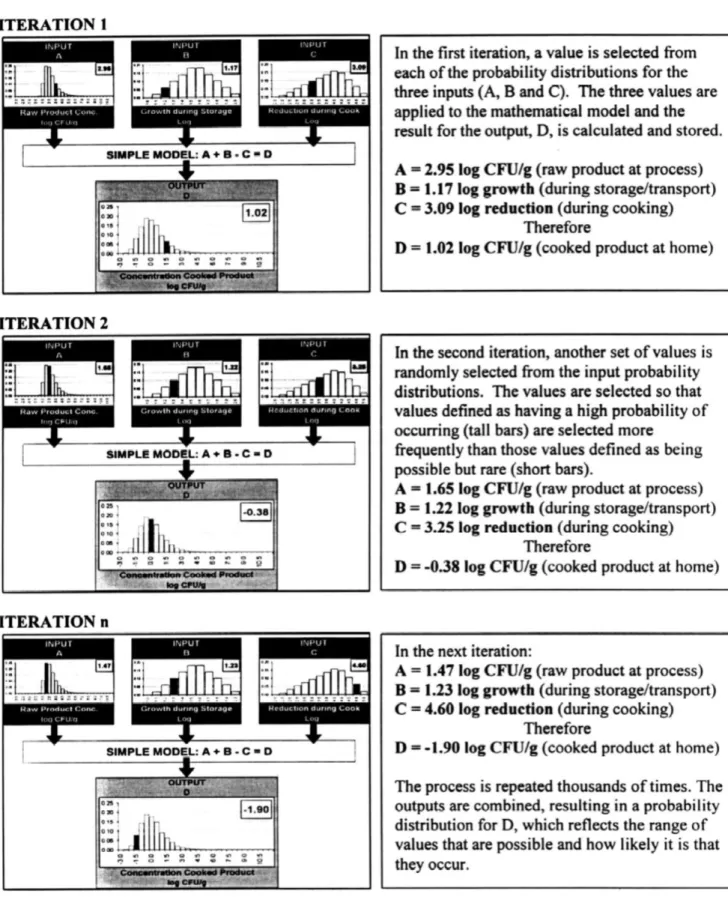
Monte Carlo Simulation is an alternative to using analytical techniques to evaluate a risk assessment, as this can be a tedious task, even for a single model. Is it described as a numerical technique, specifically suited for computer applications, which randomly selects a single ‘point-estimate’ value from each of the probability distributions applied for each input parameter. The selected single values are used to calculate a mathematical solution, which is specified in the risk assessment model. Each result is stored, and the sequence is repeated for a several number of times (iterations). In each iteration a different value is selected, according to the defined probability for each one. Values associated with higher probabilities are more likely to occur, and therefore are selected more frequently. The result of a Monte Carlo analysis is an output described by a frequency distribution of values, which combine the ranges and the frequencies of each input parameters (Lammerding & Fazil, 2000).
Fig. 5 describes a simplified illustration of a Monte Carlo simulation for a hypothetical exposure assessment.
Figure 5: Illustration of Monte Carlo simulation performed to determine the concentration of a
pathogen in a food product. There are three inputs: (A) is the concentration of a pathogen in the raw food product, log CFU/g; (B) is the log growth that can occur during transport and storage; and (C) is the log reductions that occur when the product is cooked to various degrees of doneness. (From: Lammerding & Fazil (2000)).
II. The importance of consumer phase models in quantitative
microbiological risk assessment
1. Introduction
Risk assessments that consider the influence of various factors in the food pathway, from food production until food consumption and the effect on human health, provide valuable information for risk managers. These have been described as farm-to-fork risk assessments, and have been conducted for different food-pathogen combination (Buchanan et al., 2000; Lammerding & Fazil, 2000; Nauta & Christensen, 2011).
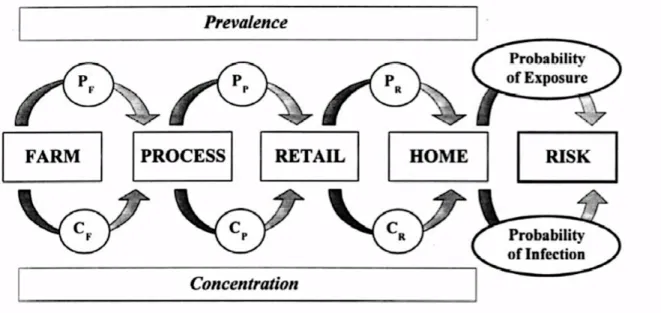
Figure 6 shows the elements of a farm-to-fork risk assessment. The changes in prevalence and concentration of a pathogen are assessed from the farm level through processing and retail to final consumption by the consumer (Lammerding & Fazil, 2000).
Some risk assessments start at primary production, while others may start at a later stage of the food chain (Buchanan et al., 2000; Nauta & Christensen, 2011). As described before in this study, according to the Codex Alimentarius, all risk assessments should include an exposure assessment. As this step describes the probability of intake of pathogens by consumers (CAC, 1999), it is necessary that risk assessments include models or assumptions that account for the consumer phase. By considering this phase, an essential link between previous phases in the food chain and the dose-response relation is established.
Figure 6: Elements of a ‘farm-to-fork’ risk assessment. Factors that influence or alter the prevalence and/or concentration at the farm (PF and CF), during food processing (PP, CP), retail storage and handling (PR, CR) and in the home (PH, CH) are described in the exposure assessment (From: Lammerding & Fazil (2000)).
The consumer phase is the part of the food chain following the production and retail, when the consumer transports, stores, prepares and consumes produced food (Nauta & Christensen, 2011). This step is different from all the other steps of the food chain, because it is associated with high variability aspects of human behaviour (Nauta et al., 2009).
Food safety managers have lower interest in this step than in the other stages of the food chain, because in this phase, food can no longer be controlled by food authorities and there is no possibility of enforcing controls by legislation. In this step, proper and safe food handling is the consumer’s responsibility, and the only form of control at this point is through education of the population and provision of other types of information (Fischer et al., 2005; Hill et al., 2011).
Representative quantitative data on consumer food handling practices to use in a risk assessment remains scarce. This is due to the difficulty of obtaining unbiased, representative data on human behaviour in the domestic setting in general (Redmond & Griffith, 2003), which restrains research in the consumer phase. Also, because there is high variability in food handling practices, and cultural and social differences between the considered population groups in relation to food preparation practices need to be accounted for (Nauta et al., 2009). Despite these challenges, a consumer phase model (CPM) needs to be included in a risk assessment, to allow an evaluation of the effectiveness of intervention measures in food production and processing, in terms of human health risk.
To this day, several CPMs have been developed. These may differ substantially in terms of complexity depending on the purpose of the QMRA and the availability of data. Some may only include a few simplifying assumptions, while others may describe in detail the food handling practices, their frequencies of occurrence and use plenty of data sources (Zwietering, 2009).
With the current rapid progress of science and technology, rapid risk management measures of acute public health events are indispensable. These can reduce or prevent disease in affected populations, reduce negative social and economic consequences, and enable implementation of appropriate and timely control measures (WHO, 2012).
This implies that in an acute public health event, it is desired that risk assessment models are built in short period of time, in order to provide a fast scientific ground for further implementation of control measures and more efficient risk management.
An important question to answer in the development of CPMs is to what extent these models need to include a detailed description of the processes that may result in exposure (Nauta & Christensen, 2011). The study from Nauta et al., (2009), suggests that “There is no alternative but for a probabilistic approach to risk assessment models of the consumer phase.”. This implies that there is no possibility other than using stochastic CPMs to obtain accurate risk estimates when modelling the consumer phase.
2. Purpose of the project
The purpose of this study is to compare the results given by seven published stochastic consumer phase models found in the literature for Campylobacter, Salmonella and Listeria monocytogenes, with two simpler modelling techniques, which don’t include variation. The modelling techniques are compared by means of absolute risk estimates and relative risk estimates, by simulating the effect on the risk of six hypothetical intervention scenarios in the food production chain.
This project aims to identify particular scenarios in which simpler surrogates that don’t include variation estimate similar results to stochastic CPMs. If so, modelling the consumer phase of the exposure assessment stage of a risk assessment would become a faster and simpler process, ideal for use in acute public health disease outbreaks (WHO, 2012; Zwietering, 2009).
The objectives of the study are summarised in the following order below:
• To assess absolute risk estimates and relative risk estimates (by simulation of intervention measures) for different stochastic consumer phase models found in the literature for three pathogens: Campylobacter, Salmonella and L. monocytogenes. • To assess absolute risk estimates and relative risk estimates (by considering
intervention scenarios) of two simpler approaches that don’t include variation: “a-factor” model (Duarte et al., 2016) and deterministic consumer phase models.
• To compare the results in terms of absolute risk estimates and relative risk estimates of the modelling approach using a stochastic CPM, with the approach using an “a-factor” model and a deterministic consumer phase model.
3. Materials and methods
Literature research on Quantitative Microbiological Risk Assessment was conducted in order to obtain published Consumer Phase Models for three microorganisms responsible for food borne zoonoses: Campylobacter in broiler chicken (Calistri & Giovannini, 2008; Christensen et al., 2001; Nauta et al., 2008), Salmonella in pork (Hill et al., 2011; Messens et al., 2009; Mürmann et al., 2011) and Listeria monocytogenes in cold-smoked-salmon (Berjia, 2013; Pouillot & Lubran, 2011). The information was obtained through searching in websites containing large databases of scientific articles and journals, such as Science Direct, Pub-med, Dtu-Find it and Research Gate.
Seven models in total were chosen after the literature research. The simpler models were implemented in Monte Carlo software @Risk 5.5 (Palisade), while the more complex models were provided by my supervisor, Maarten Nauta. These models had already been implemented in the software in a project performed by Mungai, (2015). Dose-Response models specific for each pathogen were also found in the literature.
3.1 Modelling approach using stochastic CPMs
The modelling approach used for all the stochastic CPMs in this study can be divided in two main parts. The first part describes the transport of the food by the consumer, its storage, preparation and consumption. Not all the models describe all these stages. Some models only include the preparation and consumption, while others also include the transport and storage. Each model is described in detail further in this study. The second part includes the dose-response relationship.
- Overview of the modelling approach:
3.1.1.1 Input distributions
The inputs applied for each CPM are described in this step. The relevant parameters are specified, as well as their corresponding notation and distribution.
3.1.1.2 Consumer phase model description
In this step, the consumer phase model is briefly described and its formulas and diagrams are provided.
3.1.1.3. Dose-response model
The dose-response model applied for each pathogen is described and the corresponding formula provided.
3.1.1 Campylobacter CPMs
Three CPMs for Campylobacter in chicken meat were selected from a study performed by Nauta and Christensen (2011): Nauta CPM (Nauta et al., 2008), Christensen CPM (Christensen et al., 2001) and Calistri CPM (Calistri & Giovannini, 2008). A recent review of the performance of these models is given in a study by Chapman et al., (2016). The models describe the transfer and survival of Campylobacter in raw chicken meat, from retail purchase to meal consumption, with Campylobacter originating from that meat.
Human exposure to Campylobacter can occur as a result of undercooking or cross-contamination during meal preparation. It is largely accepted that all Campylobacter are inactivated through heating of the meat and that proper hygiene measures can prevent cross-contamination. An episode of undercooking is assumed to be unlikely and may be especially important when whole carcasses are considered (FAO/WHO, 2009).
In all Campylobacter CPMs described, cross-contamination is considered to be the dominant route of exposure, which does not necessarily occur via the meat itself but via a ready-to-eat (RTE) food item (e.g. salad)
For this reason, at the point of exposure, Campylobacter may be in the prepared meat itself, but more likely in a RTE food at side dish, like a salad prepared on the same cutting board as the raw chicken meat (Nauta et al., 2009).
3.1.1.1- Input distribution
According to the approach used by (Nauta & Christensen, 2011), the input distributions (initial concentration, prevalence and portion size) are assumed to be the same for all the considered Campylobacter CPMs. The same dose-response model was also applied for the three CPMs. By using this approach, the difference of the risk estimates is expected to be only attributable to differences inherent to the models, which allows further comparison of the results.
The input distributions are described as:
• Concentration of Campylobacter at retail, Cret (in cfu/g), is defined by a normal
distribution of the logs (mean= 1.5, standard deviation= 1.2).
• With prevalence pprev of 0.25, log Cret is sampled from a normal distribution with
mean= 1.5 and standard deviation= 1.2, otherwise Cret is 0 cfu/g.
• Portion sizes, wc, are sampled from a lognormal distribution with mean= 189 g,
The number of Campylobacter in cfus on one portion of consumed meat, Nportion, is defined by
the Poisson distribution described below:
𝑁!"#$%"& ~ 𝑃𝑜𝑖𝑠𝑠𝑜𝑛 (𝐶!"#×𝑊!) (1)
where ∼ represents “is a sample from,” so Nportionvaries with different portions.
3.1.1.2- Consumer phase models
The purpose of each CPM is to describe the probability distribution of ingested doses consequential to the distribution of Nportion for a large set of meat portions. Empirical distributions to model uncertainty and variability are used to characterize the parameters in all the CPMs related to Campylobater described below. All the parameters of the CPMs are described in more detail in Annex II.
- Nauta CPM
The study from Nauta et al (2008) relied on other studies (De Jong et al., 2008; Van Asselt et al., 2008) to use Lactobaccili as a tracer for Campylobacter in an observational study. The study considered bacterial transfer from inoculated chicken breast fillets to salads in ready-to-eat chicken salad prepared at home by consumer volunteers. From this study, a data set describing the variability of transfer rates from raw meat to salad was obtained, and an empirical distribution was used for the transfer rates ptr (described in Appendix in Nauta & Christensen (2011)). If ptr is variable and sampled from this distribution, this allows:
𝑑 ~𝐵𝑖𝑛𝑜𝑚𝑖𝑎𝑙 𝑁!"#$%"&, 𝑝!" . (2)
where ∼ represents “is a sample from,” so Nportion varies with different portions, and ptr represents the probability of a single cfu from the portion ending up in the dose.
- Christensen CPM
This model is a simplified version of the CPM by (Christensen et al., 2001), which still gives very similar results to the original version. It describes the transfer of bacteria from raw chicken to equipment (board or knife), and from equipment to cooked chicken or accompanying salad.
𝑑~𝐵𝑖𝑛𝑜𝑚𝑖𝑎𝑙 [𝑁!"#$%"&, 𝑡𝐶𝐸, 𝑡𝐸𝐶 × 𝑓𝐶𝐶 + 1 − 𝑡𝐸𝐶 × 𝑓𝐶𝐶 ×𝑡𝐸𝑆 ×𝑓𝐶𝑆 ] (3)
where,
• The transfer rate chicken to equipment tCE, is defined by ten to the power of minus Pert distribution, with minimum value=1; most likely value= 2 and maximum value= 6. ~10^−Pert(1,2,6)
• The transfer rate equipment to chicken, tEC is defined by ten to the power of minus Pert distribution, with minimum value=1; most likely value= 2 and maximum value= 6. ~10^−Pert(1,2,6)
• The frequency of chicken to chicken contamination, fCC is considered to be =1. • The transfer rate equipment to salad, tES is defined by defined by ten to the power of
minus Pert distribution, with minimum value=1; most likely value= 2 and maximum value= 6. ~10^−Pert(1,2,6)
• The frequency of chicken to salad contamination, fCS is considered to be =1.
- Calistri CPM
For this model, Calistri and Giovaninni (2008) use the same transfer rate data as the Brynestad CPM (Luber et al., 2006), but derived different empirical distributions. It describes the transfer of bacteria from raw chicken to equipment (board or knife) and to hands, and from hands and equipment to cooked chicken or accompanying salad:
where:
• The transfer rates tCE, tER, tCH and tHR are defined by empirical distributions. Variables are summarized in Table 4 in Calistri and Giovaninni (2008).
• Chicken to environment contamination fCE, is defined by a Bernoulli distribution that returns =1 with probability pCE= 0.124, otherwise returns = 0.
• Chicken to hand contamination fCH, is defined by a Bernoulli distribution that returns =1 with probability pCH= 0.259, otherwise returns = 0.
The output from Nauta, Christensen and Calistri CPMs return the probability distribution of the number of cfu’s ingested (i.e. the dose) consequential to the distribution of Nportion over a large set of meat portions.
3.1.1.3- Dose-response model
For Campylobacter, a Beta-Poisson model was used to describe the probability of infection from an ingested dose d (WHO/FAO, 2009):
𝑝 𝑖𝑛𝑓𝑒𝑐𝑡𝑖𝑜𝑛|𝑑𝑜𝑠𝑒 = 1 − 1 +𝑑 𝛽
!! (5)
where α = 0.145 and β= 7.59.
As the classic Beta-Poisson model describes the response in terms of probability of infection, and the desired output is the probability of illness Qill , a standard multiplier of 0.33 is used, based in studies from Black et al. (1988) and from WHO/FAO (2009). Subsequently, the mean of the probability of illness was considered for comparison of the results.
After implementation of each CPM and the dose-response model, the final outputs obtained are the probabilities of illness for each individual after exposure to a certain dose d, the number of cfus of Campylobacter in contaminated salad.
3.1.2- Salmonella CPMs
3.1.2.1- Input Distribution
Following a similar approach used for Campylobacter CPMs, the same inputs (initial concentration, prevalence) and dose-response model were applied to all Salmonella models, to assure that the risk estimates are only attributable to differences in the models. The inputs applied to all the models were obtained from Messens et al. (2009), while the dose-response model used was obtained from FAO/WHO Risk assessments of Salmonella in eggs and broiler chickens (WHO/FAO, 2002).
The input distributions are described as:
• Concentration of Salmonella at retail (log cfu/g), is defined by a Normal distribution (mean= 1.4; standard deviation= 0.7)
• Prevalence, p is = 0.12
• Weight of portion, is defined by a Normal distribution with mean= 93 and SD=14.83
3.1.2.2- Consumer phase models
- Bollaerts CPM:
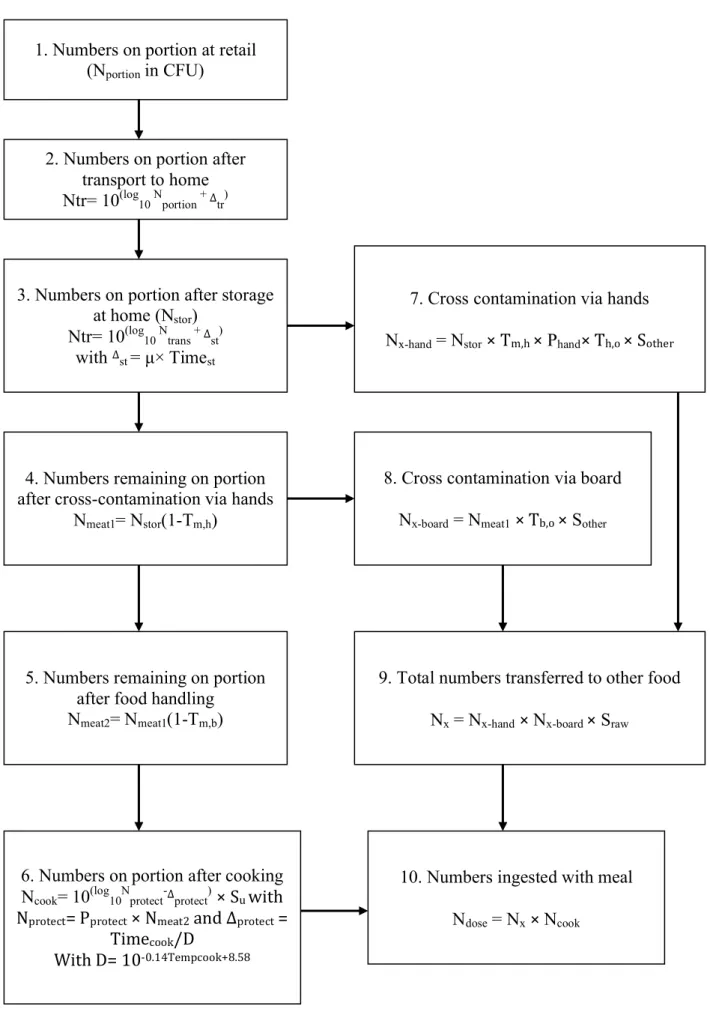
Bollaerts CPM is part of a QMRA conducted to evaluate the risk of human salmonellosis through household consumption of fresh minced pork meat in Belgium (Messens et al., 2009). It is included in module 6 of the exposure assessment, where the process of preparing meat in households is simulated, considering that the meal partially consists of a portion of minced pork meat and another food item. It is assumed that pork meat is cooked in all situations, while the other food item is sometimes consumed raw.
To account for variability and uncertainty, empirical distributions are used to describe the growth of Salmonella during transport and storage at home, cross contamination during meal preparation of a ready to eat meal (from meat to the other food product via cook’s hands or carving board), and microbial inactivation during cooking.
It is assumed that cross-contamination to another food item occurs via the cook’s hands (step 7 on Fig. 7) or via the carving board used to manipulate the minced meat (step 8 on Fig. 7). Cross-contamination via the carving board is firstly modelled as transfer of Salmonella from the meat after manipulation by hands to the board, and from the board to another food item
(step 9 on Fig. 7). After food handling, the number of Salmonella present on the minced meat is described in step 5 of the diagram in Figure 7.
The effect of undercooking is modelled in this CPM, and it is assumed that only a proportion of Salmonella cells in the protected area will survive to the cooking process (step 6 in Fig. 7). The final output of the model is the number of Salmonella ingested at the moment of consumption, which includes the sum of the number of Salmonella in the minced meat that survived cooking and the number transferred to another food item consumed raw (step 10 in Fig. 7).
Bollaert’s CPM output gives the number of Salmonella on the minced pork meat which survived the cooking process, as well as the number transferred to another food item that is consumed raw.
Figure 7: Schematic representation of Bollaerts CPM. See details in Table 10 in Annex II.
(Adapted from: Messens et al., (2009) and Mungai (2015)).
1. Numbers on portion at retail (Nportion in CFU)
2. Numbers on portion after transport to home Ntr= 10(log10 Nportion + Δtr)
3. Numbers on portion after storage at home (Nstor)
Ntr= 10(log10 Ntrans + Δst) with Δst = µ× Timest
4. Numbers remaining on portion after cross-contamination via hands
Nmeat1= Nstor(1-Tm,h)
5. Numbers remaining on portion after food handling
Nmeat2= Nmeat1(1-Tm,b)
6. Numbers on portion after cooking Ncook= 10(log10Nprotect-Δprotect) × Su with Nprotect= Pprotect × Nmeat2 and Δprotect =
Timecook/D
With D= 10-0.14Tempcook+8.58
7. Cross contamination via hands Nx-hand = Nstor × Tm,h × Phand× Th,o × Sother
8. Cross contamination via board Nx-board = Nmeat1 × Tb,o × Sother
9. Total numbers transferred to other food Nx = Nx-hand × Nx-board × Sraw
10. Numbers ingested with meal Ndose = Nx × Ncook
- EFSA CPM
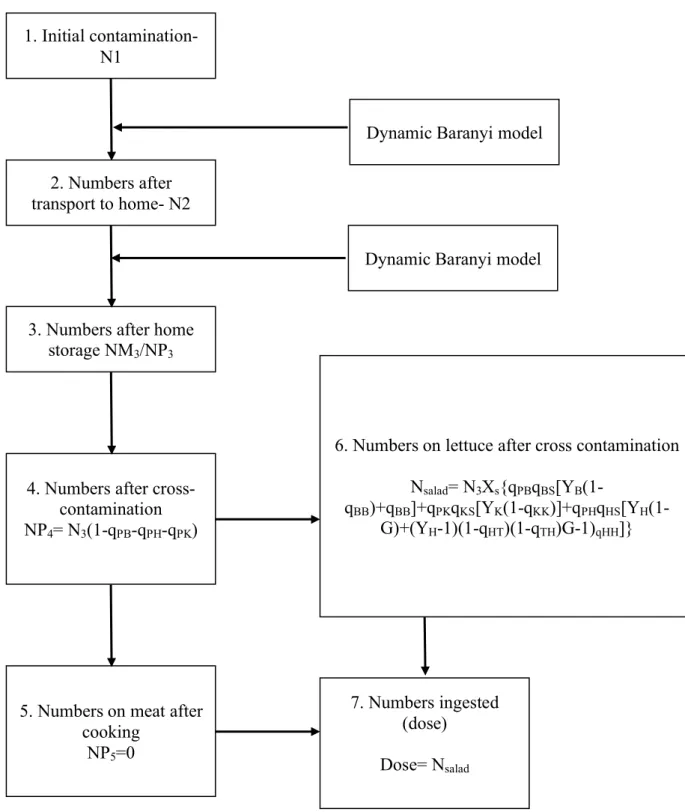
EFSA CPM is part of a full risk assessment model for Salmonella in the pork production chain in selected European Union member states (Hill et al., 2011). This CPM can also be found in a more recent study by Swart et al., (2016). In this risk assessment three types of pork meat are considered: minced pork, pork cuts and fermented sausages. For the purpose of this study, the only model considered was for pork cuts.
Empirical distributions are used to model variability and uncertainty related to the processes of transport, storage and meal preparation of 10,000 portions of pork cuts.
The growth of Salmonella in transport and storage (at home) is modeled by using time and temperature parameters (Baranyi’s dynamic growth model).
The preparation of pork cuts is modelled in the most part as a cross-contamination process, from pork products to ready-to-eat food (eg. salads or bread). Transmission of Salmonella can occur within the household from raw meat juice present in surfaces, equipment or personnel carrying the bacteria.
The parameters below are considered to describe cross-contamination:
• Transfer between pork cuts, knife, cutting board and hands through cutting. • Cross-contamination between hands and tap, through washing of the board. • Cross-contamination between hands and tap , through washing the knife • Cross-contamination between hands and tap, through washing hands. • Cutting the salad
Inadequate cooking is not considered in this CPM due the assumption that the heating will destroy all Salmonella cells, since they are present exclusively on the outside of the product (step 5 in Fig. 8).
EFSA’s CPM output is the number of cfus of Salmonella in each portion of pork cuts at the point of consumption (step 7 in Fig. 8).
1. Initial contamination- N1
2. Numbers after transport to home- N2
3. Numbers after home storage NM3/NP3
4. Numbers after cross-contamination NP4= N3(1-qPB-qPH-qPK)
5. Numbers on meat after cooking
NP5=0
Dynamic Baranyi model
Dynamic Baranyi model
6. Numbers on lettuce after cross contamination Nsalad= N3Xs{qPBqBS[YB(1- qBB)+qBB]+qPKqKS[YK(1-qKK)]+qPHqHS[YH(1-G)+(YH-1)(1-qHT)(1-qTH)G-1)qHH]} 7. Numbers ingested (dose) Dose= Nsalad
Figure 8: Schematic representation of EFSA CPM. See details in Table 11 in Annex II.