EUROPEAN ORGANISATION FOR NUCLEAR RESEARCH (CERN)
Submitted to: JHEP CERN-EP-2016-010
5th July 2016
Identification of high transverse momentum top quarks in pp
collisions at
√
s
= 8 TeV with the ATLAS detector
The ATLAS Collaboration
Abstract
This paper presents studies of the performance of several jet-substructure techniques, which are used to identify hadronically decaying top quarks with high transverse momentum con-tained in large-radius jets. The efficiency of identifying top quarks is measured using a sample of top-quark pairs and the rate of wrongly identifying jets from other quarks or gluons as top quarks is measured using multijet events collected with the ATLAS experiment in 20.3 fb−1 of 8 TeV proton–proton collisions at the Large Hadron Collider. Predictions from Monte Carlo simulations are found to provide an accurate description of the performance. The techniques are compared in terms of signal efficiency and background rejection using simulations, covering a larger range in jet transverse momenta than accessible in the dataset. Additionally, a novel technique is developed that is optimized to reconstruct top quarks in events with many jets.
c
2016 CERN for the benefit of the ATLAS Collaboration.
Reproduction of this article or parts of it is allowed as specified in the CC-BY-4.0 license.
Contents
1 Introduction 3
2 The ATLAS detector 4
3 Monte-Carlo simulation 4
4 Object reconstruction and event selection 6
4.1 Object reconstruction 6 4.2 Event selection 7 4.2.1 Signal sample 7 4.2.2 Background sample 10 5 Top-tagging techniques 11 5.1 Substructure-variable taggers 12 5.2 Shower Deconstruction 15 5.3 HEPTopTagger 24 6 Systematic uncertainties 27 6.1 Experimental uncertainties 27
6.2 In situ determination of the subjet energy scale for the HEPTopTagger 29
6.3 Uncertainties in the modelling of physics processes 30
7 Study of top-tagging performance using Monte-Carlo simulation 32
7.1 Comparison of top-tagging performance 32
7.2 HEPTopTagger04 performance 36
8 Measurement of the top-tagging efficiency and mistag rate 39
8.1 Top-tagging efficiency 39
8.1.1 Efficiency of the substructure-variable taggers 40
8.1.2 Efficiency of Shower Deconstruction 43
8.1.3 Efficiency of the HEPTopTagger 44
8.2 Mistag rate 47
8.2.1 Mistag rate for the substructure-variable taggers 48
8.2.2 Mistag rate for Shower Deconstruction 48
8.2.3 Mistag rate for the HEPTopTagger 48
9 Summary and conclusions 51
Appendix 54
1. Introduction
Conventional top-quark identification methods reconstruct the products of a hadronic top-quark decay (t → bW → bq0¯q) as jets with a small radius parameter R (typically R = 0.4 or 0.5).1 There are usually several of these small-R jets in a high-energy, hard proton–proton (pp) collision event at the Large Hadron Collider (LHC). Hadronic top-quark decays are reconstructed by taking those jets which, when combined, best fit the kinematic properties of the top-quark decay, such as the top-quark mass and the W-boson mass. These kinematic constraints may also be fulfilled for a collection of jets which do not all originate from the same top-quark decay chain.
In analyses of LHC pp collisions, conventional top-quark identification methods are inefficient at high top-quark energies because the top-quark decay products are collimated and the probability of resolving separate small-R jets is reduced. Top quarks with high transverse momentum (pT & 200 GeV) may
instead be reconstructed as a jet with large radius parameter, R ≥ 0.8 (large-R jet) [1–13]. An analysis of the internal jet structure is then performed to identify and reconstruct hadronically decaying top quarks (top tagging).
Since a single jet that contains all of the decay products of a massive particle has different properties from a jet of the same transverse momentum originating from a light quark or gluon, it is possible to use the substructure of large-R jets to distinguish top quarks with high pT from jets from other sources, for
example from multijet production. These differences in the jet substructure can be better resolved after contributions from soft gluon radiation or from additional pp interactions in the same or adjacent bunch crossings (pile-up) are removed from the jets. Such methods are referred to as jet grooming and consist of either an adaptive modification of the jet algorithm or a selective removal of soft radiation during the process of iterative recombination in jet reconstruction [14–16].
The jet-substructure approach aims to reduce combinatorial background from assigning small-R jets to top-quark candidates in order to achieve a more precise reconstruction of the top-quark four-momentum and a higher background rejection. In searches for top–anti-top quark (t¯t) resonances, the improved kinematic reconstruction leads to a better mass resolution for large resonance masses (≥ 1 TeV) compared to the conventional approach, resulting in an increased sensitivity to physics beyond the Standard Model (SM) [17].
ATLAS has published performance studies of jet-substructure methods for top tagging at a pp centre-of-mass energy of √s= 7 TeV [18]. In the paper presented here, the performance of several approaches to top tagging at √s = 8 TeV is documented. Top tagging based on the combination of jet-substructure variables, Shower Deconstruction [19, 20], and the HEPTopTagger [21, 22] is studied, as described in Section5. A new method, HEPTopTagger04, is introduced. Optimised for top tagging in events with many jets, it uses a preselection of small-R jets as input to the HEPTopTagger algorithm.
Monte-Carlo (MC) simulation is used to compare the efficiencies and misidentification rates of all ap-proaches over a large kinematic range. The performance of the different methods is studied in data using
1 The ATLAS experiment uses a right-handed coordinate system with its origin at the nominal interaction point (IP) in the
centre of the detector and the z-axis along the beam line. The x-axis points from the IP to the centre of the LHC ring, and the y-axis points upwards. Cylindrical coordinates (r, φ) are used in the transverse plane, φ being the azimuthal angle around the beam line. Observables labelled “transverse” are projected into the x–y plane. The pseudorapidity is defined in terms of the polar angle θ as η= − ln tan θ/2. The transverse momentum is defined as pT = p sin θ = p/ cosh η, and the transverse
energy EThas an analogous definition. The distance in η–φ space is referred to as∆R = p(∆η)2+ (∆φ)2. The rapidity of a
particle is defined as y = 1 2ln
E+pz
E−pz, in which E and pzare the energy and momentum z-component of the particle. The jet radius parameter R sets the range in y–φ space over which clustering to form jets occurs.
two different event samples: a signal sample enriched with top quarks and a background sample dom-inated by multijet production. The signal sample is used to measure top-tagging efficiencies from data, which are compared to the predictions obtained from MC simulations. Quantifying the degree to which MC simulations correctly model the top-tagging efficiency observed in data is crucial for any physics ana-lysis in which top-tagging methods are used because MC simulations are commonly used to model signal and background processes. The signal sample is also used to determine the energy scale of subjets in situ from the reconstructed top-quark mass distribution. Top-tagging misidentification rates are measured in the background sample and are also compared to the prediction of MC simulations.
2. The ATLAS detector
The ATLAS detector consists of an inner tracking detector system (ID), which is surrounded by elec-tromagnetic (EM) and hadronic calorimeters and a muon spectrometer (MS). The ID consists of silicon pixel and strip detectors and a transition-radiation tracker covering |η| < 2.5, and it is immersed in a 2 T axial magnetic field. The EM calorimeters use lead/liquid argon (LAr) technology to provide calorimetry for |η| < 3.2, with copper/LAr used in the forward region 3.1 < |η| < 4.9. In the region |η| < 1.7, hadron calorimetry is provided by steel/scintillator calorimeters. In the forward region, copper/LAr and tung-sten/LAr calorimeters are used for 1.5 < |η| < 3.2 and 3.1 < |η| < 4.9, respectively. The MS surrounds the calorimeter system and consists of multiple layers of trigger and tracking chambers within a toroidal mag-netic field generated by air-core superconducting magnets, which allows for the measurement of muon momenta for |η| < 2.7. ATLAS uses a three-level trigger system [23] with a hardware-based first-level trigger, which is followed by two software-based trigger levels with an increasingly fine-grained selection of events at lower rates. A detailed description of the ATLAS detector is given in Ref. [24].
3. Monte-Carlo simulation
MC simulations are used to model different SM contributions to the signal and background samples. They are also used to study and compare the performance of top-tagging algorithms over a larger kinematic range than accessible in the data samples.
Top-quark pair production is simulated with POWHEG-BOX r2330.3 [25–28] interfaced with PYTHIA v6.426 [29] with the set of tuned parameters (tune) Perugia 2011C [30] and the CT10 [31] set of par-ton distribution functions (PDFs). The hdamp parameter, which effectively regulates the high-pT gluon
radiation in POWHEG, is left at the default value of hdamp = ∞. This MC sample is referred to as the
POWHEG+PYTHIA t¯t sample. Alternative t¯t samples are used to evaluate systematic uncertainties. A sample generated with MC@NLO v4.01 [32,33] interfaced to Herwig v6.520 [34] and JIMMY v4.31 [35] with the AUET2 tune [36], again simulated using the CT10 PDF set, is used to estimate the uncertainty related to the choice of generator. To evaluate the impact of variations in the parton shower and hadroniz-ation models, a sample is generated with POWHEG-BOX interfaced to Herwig and JIMMY. The effects of variations in the QCD (quantum chromodynamics) initial- and final-state radiation (ISR and FSR) modelling are estimated with samples generated with ACERMC v3.8 [37] interfaced to PYTHIA v.6.426 with the AUET2B tune and the CTEQ6L1 PDF set [38], where the parton-shower parameters are varied in the range allowed by data [39]. For the study of systematic uncertainties on kinematic distributions
resulting from PDF uncertainties, a sample is generated using POWHEG-BOX interfaced with PYTHIA v.6.427 and using the HERAPDF set [40]. For all t¯t samples, a top-quark mass of 172.5 GeV is used. The t¯t cross section for pp collisions at a centre-of-mass energy of √s = 8 TeV is σt¯t = 253+13−15 pb
for a top-quark mass of 172.5 GeV. It has been calculated at next-to-next-to-leading order (NNLO) in QCD including resummation of next-to-next-to-leading logarithmic (NNLL) soft gluon terms with top++2.0 [41–47]. The PDF and αsuncertainties were calculated using the PDF4LHC prescription [48]
with the MSTW2008 68% CL NNLO [49,50], CT10 NNLO [31,51] and NNPDF2.3 5f FFN [52] PDF sets, and their effect is added in quadrature to the effect of factorization- and renormalization-scale uncer-tainties. The NNLO+NNLL value is about 3% larger than the exact NNLO prediction, as implemented in Hathor 1.5 [53].
In measurements of the differential t¯tproduction cross section as a function of the top-quark pT, a
discrep-ancy between data and MC predictions was observed in 7 TeV data [54]. Based on this measurement, a method of sequential reweighting of the top-quark-pTand t¯t-system-pTdistributions was developed [55],
which gives better agreement between the MC predictions and 8 TeV data. In this paper, this reweighting technique is applied to the POWHEG+PYTHIA t¯t sample, for which the technique was developed. The predicted total t¯t cross section at NNLO+NNLL is not changed by the reweighting procedure.
Single-top-quark production in the s- and Wt-channel is modelled with POWHEG-BOX and the CT10 PDF set interfaced to PYTHIA v6.426 using Perugia 2011C. Single-top-quark production in the t-channel is generated with POWHEG-BOX in the four-flavour scheme (in which b-quarks are generated in the hard scatter and the PDF does not contain b-quarks) using the four-flavour CT10 PDF set interfaced to PYTHIA v6.427. The overlap between Wt production and t¯t production is removed with the diagram-removal scheme [56] and the different single-top-production processes are normalized to the approximate NNLO cross-section predictions [57–59].
Events with a W or a Z boson produced in association with jets (W+jets or Z+jets) are generated with ALPGEN [60] interfaced to PYTHIA v6.426 using the CTEQ6L1 PDF set and Perugia 2011C. Up to five additional partons are included in the calculation of the matrix element, as well as additional c-quarks, c¯c-quark pairs, and b¯b-quark pairs, taking into account the masses of these heavy quarks. The W+jets contribution is normalized using the charge asymmetry in W-boson production in data [61,62] by selecting µ+jets events and comparing to the prediction from MC simulations. The Z+jets contribution is normalized to the calculation of the inclusive cross section at NNLO in QCD obtained with FEWZ [63]. For the comparison of the different top-tagging techniques using MC simulation only, multijet samples are generated with PYTHIA v8.160 with the CT10 PDF set and AU2. As a source of high-transverse-momentum top quarks, samples of events with a hypothetical massive Z0resonance decaying to top-quark pairs, Z0 → t¯t, are generated with resonance masses ranging from 400 GeV to 3000 GeV and a resonance width of 1.2% of the resonance mass [64] using PYTHIA v8.175 with the MSTW2008 68% CL LO PDF set [49,50] and AU2.
For a study of top-quark reconstruction in a final state with many jets, the process2pp → H+¯t(b) → t ¯b¯t(b) is generated in a type-II 2HDM model [65] with a mass of 1400 GeV of the charged Higgs boson using POWHEG-BOX interfaced to PYTHIA v8.165 with AU2 and the CT10 PDF set. The width of the charged Higgs boson is set to zero and the five-flavour scheme is used. The additional b-quark (in parentheses above) can be present or not, depending on whether the underlying process is gg → H+¯tb or g¯b → H+¯t.
2The process pp → H−
t(¯b) → ¯tbt(¯b) is also simulated. For simplicity only the positively charged Higgs boson is indicated explicitly in this paper, but it should be understood to denote both signs of the electric charge.
All MC samples are passed through a full simulation of the ATLAS detector [66] based on GEANT4 [67], except for the t¯t samples used to estimate systematic uncertainties due to the choice of MC generator, par-ton shower, and amount of ISR/FSR, which are passed through a faster detector simulation with reduced complexity in the description of the calorimeters [68]. All MC samples are reconstructed using the same algorithms as used for data and have minimum-bias events simulated with PYTHIA v8.1 [69] overlaid to match the pile-up conditions of the collision data sample.
4. Object reconstruction and event selection
4.1. Object reconstructionElectron candidates are reconstructed [70, 71] from clusters in the EM calorimeter and are required to have a track in the ID, associated with the main primary vertex [72], which is defined as the one with the largestP p2
T,track. They must have ET > 25 GeV and |ηcluster| < 2.47 excluding the
barrel/end-cap-calorimeter transition region 1.37 < |ηcluster| < 1.52, where ηclusteris the pseudorapidity of the cluster in
the EM calorimeter. The shape of the cluster in the calorimeter must be consistent with the typical energy deposition of an electron and the electron candidate must satisfy the mini-isolation [17,73] requirement to reduce background contributions from non-prompt electrons and hadronic showers: the scalar sum of track transverse momenta within a cone of size∆R = 10 GeV/EelT around the electron track must be less than 5% of the electron transverse energy ETel(only tracks with pT > 1 GeV are considered in the sum,
excluding the track matched to the electron cluster).
Muons are reconstructed [74] using both the ID and the MS and must be associated with the main primary vertex of the event. Muons are required to have pT> 25 GeV and |η| < 2.5 and are required to be isolated
with requirements similar to those used for electron candidates: the scalar sum of the track transverse momenta within a cone of size∆R = 10 GeV/pµT around the muon track must be less than 5% of pµT, where pµTis the transverse momentum of the muon.
Jets are built [75] from topological clusters of calorimeter cells, which are calibrated to the hadronic energy scale [76] using a local cell-weighting scheme [77]. The clusters are treated as massless and are combined by adding their four-momenta, leading to massive jets. The reconstructed jet energy is calibrated using energy- and η-dependent corrections obtained from MC simulations. These corrections are obtained by comparing reconstructed jets with geometrically matched jets built from stable particles (particle level). The corrections are validated using in situ measurements of small-R jets [78].
Jets reconstructed with the anti-kt [79] algorithm using a radius parameter R = 0.4 must satisfy pT >
25 GeV and |η| < 2.5. The jet vertex fraction (JVF) uses the tracks matched to a jet and is defined as the ratio of the scalar sum of the transverse momenta of tracks from the main primary vertex to that of all matched tracks. A jet without any matched track is assigned a JVF value of −1. For anti-kt R= 0.4 jets
with pT < 50 GeV and |η| < 2.4, the JVF must be larger than 0.5 [80] to suppress jets from pile-up.
Large-R jets are reconstructed with the anti-ktalgorithm using R = 1.0 and with the Cambridge/Aachen
algorithm [81] (C/A) using R= 1.5. Anti-ktR= 1.0 jets are groomed using a trimming procedure [16]:
the constituents of the anti-ktR= 1.0 jet are reclustered using the ktalgorithm [82] with R= 0.3. Subjets
with a pT of less than 5% of the large-R jet pT are removed [18]. The properties of the trimmed jet are
are corrected to be, on average, equal to the particle-level jet mass, pT, and pseudorapidity using MC
simulations [18,83]. An illustration of trimming is given in Figure 4 of Ref. [18].
The C/A R = 1.5 jets are required to satisfy pT > 200 GeV. These jets are used as input to the
HEPTopTagger, which employs an internal pile-up suppression, and are therefore left ungroomed. For trimmed anti-ktR= 1.0 jets, the minimum pTis raised to 350 GeV to reduce the fraction of jets not
con-taining all top-quark decay products due to the smaller jet radius parameter. All large-R jets must satisfy |η| < 2.0.
The missing transverse momentum is calculated from the vector sum of the transverse energy of clusters in the calorimeters, and it is corrected for identified electrons, muons and anti-kt R= 0.4 jets, for which
specific object-identification criteria are applied [84]. The magnitude of the missing transverse momentum is denoted by EmissT .
4.2. Event selection
The data used in this paper were taken in 2012 at a centre-of-mass-energy √s = 8 TeV and correspond to an integrated luminosity of 20.3 fb−1[85]. Data are used only if all subsystems of the detector as well as the trigger system were fully functional. Baseline quality criteria are imposed to reject contamination from detector noise, non-collision beam backgrounds, and other spurious effects. Events are required to have at least one reconstructed primary vertex with at least five associated ID tracks, each with a pT
larger than 400 MeV. This vertex must be consistent with the LHC beam spot [72]. In addition, all anti-kt
R = 0.4 jets in the event which have pT > 20 GeV are required to satisfy the “looser” quality criteria
discussed in detail in Ref. [78], otherwise the event is rejected.
Two different event samples are used to study the performance of top-tagging algorithms in data: a signal sample enriched in hadronically decaying top quarks and a background sample consisting mainly of multijet events.
4.2.1. Signal sample
For the signal sample, a selection of t¯t events in the lepton+jets channel is used, in which one of the W bosons from t¯t → W+bW−¯b decays hadronically and the other W boson decays leptonically. The selection is performed in the muon channel and the electron channel.
The selection criteria for the muon and electron channels differ only in the requirements imposed on the reconstructed leptons. For the muon channel, the events are required to pass at least one of two muon triggers, where one is optimized to select isolated muons with a transverse momentum of at least 24 GeV and the other selects muons with at least 36 GeV without the isolation requirement. Exactly one muon with pT > 25 GeV is required as defined in Section4.1. Muons are rejected if they are close to an anti-kt
R= 0.4 jet that has pT > 25 GeV. The rejection occurs if ∆R(µ, jet) < (0.04 + 10 GeV/pµT). Events in the
muon channel are rejected if they contain an additional electron candidate.
For the electron channel, events are required to pass at least one of two triggers. The first is designed for isolated electrons with pT > 24 GeV and the second trigger requires electrons with pT > 60 GeV without
the isolation requirement. Exactly one electron is required with ET > 25 GeV as defined in Section4.1.
An electron–jet overlap removal is applied based on the observation that the electron pT contributes a
subtracted from the jet momentum before kinematic requirements are applied to the jet, so that jets close to an electron often fall below the jet pTthreshold. If the electron-subtracted jet still fulfils the kinematic
requirements for anti-ktR= 0.4 jets and the electron is still close, the electron is considered not isolated.
In this case, the electron is removed from the event and the original non-subtracted jet is kept. Events in the electron channel are rejected if they also contain a muon candidate.
To select events with a leptonically decaying W boson, the following requirements are imposed. The events are required to have missing transverse momentum ETmiss> 20 GeV. Additionally, the scalar sum of EmissT and the transverse mass of the leptonic W-boson candidate must satisfy EmissT + mWT > 60 GeV, where mWT =
q
2p`TEmissT (1 − cos∆φ) is calculated from the transverse momentum of the lepton, p`T, and ETmissin the event. The variable∆φ is the azimuthal angle between the lepton momentum and the ETmiss direction.
To reduce contamination from W+jets events, each event must contain at least two b-tagged anti-ktR= 0.4
jets with pT > 25 GeV and |η| < 2.5. A neural-network-based b-tagging algorithm [86] is employed,
which uses information on the impact parameters of the tracks associated with the jet, the secondary vertex, and the decay topology as its input. The operating point chosen for this analysis corresponds to a b-tagging identification efficiency of 70% in simulated t¯t events. In t¯t events with high-momentum top quarks, the direction of the b-quark from the leptonic decay of a top quark is often close to the lepton direction. Hence, at least one b-tagged jet is required to be within∆R = 1.5 of the lepton direction. A second b-tag away from the lepton is required that fulfils∆R(lepton, b-tag) > 1.5. This b-tagged jet is expected to originate from the b-quark from the hadronic top-quark decay, and is expected to be well separated from the decay products of the leptonically decaying top quark.
Each event is required to contain at least one large-R jet that fulfils the requirement∆R(lepton, large-R jet) > 1.5. This criterion increases the probability that the large-R jet originates from a hadronically decaying top quark. The large-R jet has to fulfil |η| < 2 and exceed a pT threshold. The jet algorithm, the radius
parameter, and the pTthreshold depend on the top tagger under study. An overview is given in Table1.
The top taggers are introduced in Section5where also the choice of particular large-R jet types is motiv-ated. If several large-R jets in an event satisfy the mentioned criteria, only the jet with the highest pT is
considered. This choice does not bias the measurements presented in this paper, because the top-tagging efficiencies and misidentification rates are measured as a function of the large-R jet kinematics.
In simulated events containing top quarks, large-R jets are classified as matched or not matched to a hadronically decaying top quark. The classification is based on the distance∆R between the axis of the large-R jet and the flight direction of a generated hadronically decaying top quark. The top-quark flight direction at the top-quark decay vertex is chosen, so as to take into account radiation from the top quark changing its direction. Matched jets are those with∆R smaller than a predefined value Rmatch, while
not-matched jets are those with∆R > Rmatch. The radius Rmatchis 0.75 for the anti-ktR= 1.0 jets and 1.0 for
Tagger Jet algorithm Grooming Radius parameter pT range |η| range Tagger I–V
anti-kt
trimming
R= 1.0 > 350 GeV < 2
W0top tagger (Rsub= 0.3,
Shower Deconstruction fcut= 0.05)
HEPTopTagger C/A none R= 1.5 > 200 GeV < 2
the C/A R = 1.5 jets. Changing Rmatchto 1.0 for the anti-kt R = 1.0 jets has a negligible impact on the
size of the not-matched t¯t contribution (less than 1%). Alternative matching schemes were tested but did not show improved matching properties, such as a higher matching efficiency.
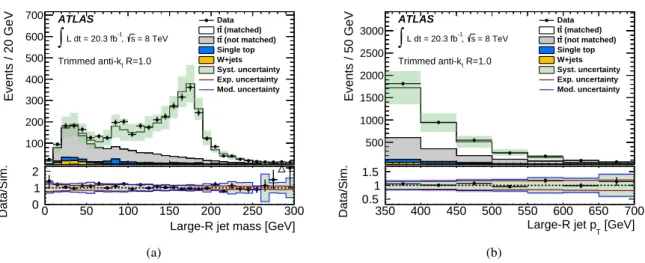
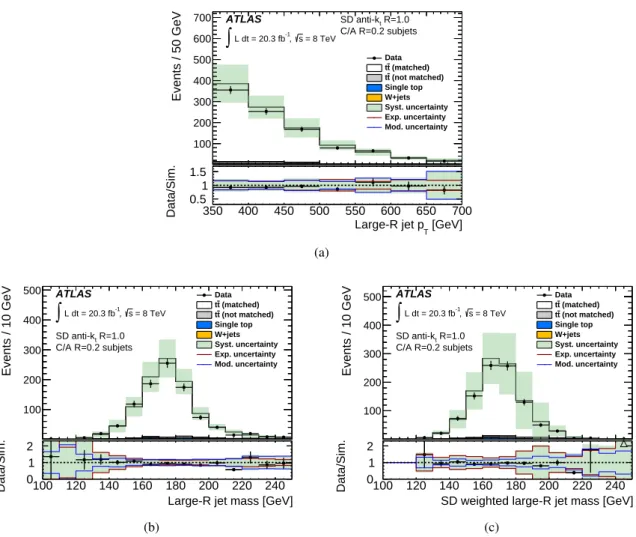
Distributions for the signal selection with at least one trimmed anti-kt R= 1.0 jet with pT > 350 GeV are
shown in Figure1. The top-quark purity in this sample is 97%, with a small background contribution from W+jets production (3%). Single-top production accounts for 4% of the event yield and the t¯t prediction accounts for 93% (62% from matched and 31% from not-matched events). Not-matched t¯t events are an intrinsic feature of the signal selection. With different selection criteria the fraction of not-matched t¯t events varies, as does the total number of selected events. The chosen signal selection in the lepton+jets channel was found to be a good compromise between a reduced fraction of not-matched t¯t events and a sizeable number of selected events.
The mass and the transverse momentum of the highest-pT trimmed anti-kt R = 1.0 jet are shown in
Figures1(a) and1(b), respectively. The systematic uncertainties shown in these plots are described in detail in Section6. The mass distribution shows three peaks: one at the top-quark mass, a second at the W-boson mass and a third around 35 GeV. According to simulation, which describes the measured distribution within uncertainties, the top-quark purity in the region near the top-quark mass is very high, with the largest contribution being matched t¯t. The peak at the position of the W-boson mass originates from hadronically decaying top quarks where the b-jet from the decay is not contained in the large-R jet. Even smaller masses are obtained if one of the decay products of the hadronically decaying W boson is not contained in the large-R jet or if only one top-quark-decay product is captured in the large-R jet. In these cases, a small mass is obtained due to the kinematic requirements imposed during trimming. The fraction of not-matched t¯t increases for decreasing large-R jet mass indicating a decreasing fraction of jets with a close-by hadronically decaying top quark. Only a small fraction of the peak at small mass is due to matched t¯t. The large-R jet pTexhibits a falling spectrum, and the application of the sequential pT
reweighting to the simulation (cf. Section3) yields a good description of the data.
The dominant systematic uncertainties in Figure1result from uncertainties in the large-R jet energy scale (JES), the PDF, and the t¯t generator. The contributions from these sources are approximately equal in size, except for large-R jets with pT> 500 GeV where the choice of t¯tgenerator dominates. These uncertainties
affect mostly the normalization of the distributions. For the PDF and t¯t generator uncertainties, this normalization uncertainty comes about as follows: while the total t¯t cross section is fixed when the different MC event samples are compared, the pTdependence of the cross section varies from sample to
sample, leading to a change in normalization for the phase space considered here (pT > 350 GeV).
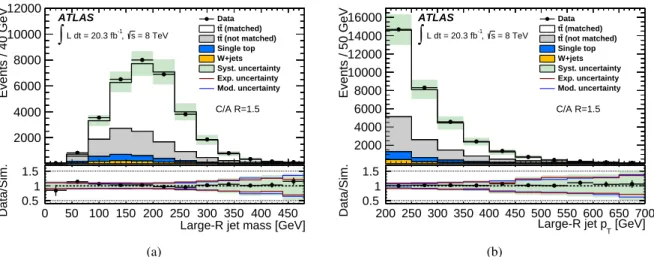
Distributions for events fulfilling the signal selection with at least one C/A R = 1.5 jet with pT >
200 GeV, to be used in the HEPTopTagger studies, are shown in Figure 2. According to the simula-tion, the top quark purity in this sample is 97%. The only non-negligible background process is W+jets production (3%). The t¯t prediction is split into a matched part (59%) and a not-matched part (29%). Single-top production contributes 9% to the total event yield. The mass of the highest-pTC/A R= 1.5 jet
with pT > 200 GeV is shown in Figure2(a)and it exhibits a broad peak around 190 GeV. The large-R-jet
mass distributions from not-matched t¯t, single-top production, and W+jets production have their maxima at smaller values than the distribution from matched t¯t. No distinct W-boson peak is visible, because the C/A R= 1.5 jets are ungroomed. The pTspectrum of the highest-pTC/A R= 1.5 jet is smoothly falling
and well described by simulation after the sequential pTreweighting is applied (Figure2(b)).
The C/A R= 1.5 jet distributions are described by the simulation within the uncertainties. The systematic uncertainties are slightly smaller than those in the distributions shown in Figure1for anti-ktR= 1.0 jets
0 50 100 150 200 250 300 Events / 20 GeV 100 200 300 400 500 600 700 Data (matched) t t (not matched) t t Single top W+jets Syst. uncertainty Exp. uncertainty Mod. uncertainty ATLAS = 8 TeV s , -1 L dt = 20.3 fb
∫
R=1.0 t Trimmed anti-kLarge-R jet mass [GeV]
0 50 100 150 200 250 300 Data/Sim. 0 1 2 (a) 350 400 450 500 550 600 650 700 Events / 50 GeV 500 1000 1500 2000 2500 3000 Data (matched) t t (not matched) t t Single top W+jets Syst. uncertainty Exp. uncertainty Mod. uncertainty ATLAS = 8 TeV s , -1 L dt = 20.3 fb
∫
R=1.0 t Trimmed anti-k [GeV] T Large-R jet p 350 400 450 500 550 600 650 700 Data/Sim. 0.5 1 1.5 (b)Figure 1: Detector-level distributions of variables reconstructed in events passing the signal-sample selection (t¯t) with at least one trimmed anti-ktR= 1.0 jet with pT> 350 GeV. Shown in (a) is the mass and in (b) the transverse
momentum of the highest-pT anti-ktR = 1.0 jet. The vertical error bar indicates the statistical uncertainty of the
measurement. Also shown are distributions for simulated SM contributions with systematic uncertainties (described in Section6) indicated as a band. The t¯t prediction is split into a matched part for which the large-R jet axis is within ∆R = 0.75 of the flight direction of a hadronically decaying top quark and a not matched part for which this criterion does not hold. The ratio of measurement to prediction is shown at the bottom of each subfigure and the error bar and band give the statistical and systematic uncertainties of the ratio, respectively. The impacts of experimental and t¯tmodelling uncertainties are shown separately for the ratio.
with pT > 350 GeV because the t¯t modelling uncertainties increase with large-R jet pT. The
uncertain-ties in the large-R JES, the b-tagging efficiency, the prediction of the t¯t cross section, and t¯t modelling uncertainties from the choice of generator, parton shower, and PDF set all contribute to the systematic uncertainty in the large-R-jet mass distribution. The uncertainty from the choice of generator increases in the high-mass tail, which is particularly sensitive to additional radiation close to the hadronically de-caying top quark. The modelling uncertainties for the large-R-jet pT distribution increase with pT due
to increasing uncertainties from the large-R JES, the b-tagging efficiency, and the t¯t modelling uncertain-ties. The increase of the t¯t modelling uncertainty with large-R-jet pT is an observation consistent with
Figure1(b).
Distributions of other kinematic variables are also well described by the simulation and are shown in AppendixA.
4.2.2. Background sample
Due to the high threshold of the unprescaled jet triggers, such triggers do not provide an unbiased back-ground sample of large-R jets from multijet production. Therefore, the misidentification rate is measured in a multijet sample collected with single-electron triggers, where the event is triggered by an object which in the detailed offline analysis fails the electron-identification requirements.
For the electron candidate used at the trigger level, the requirements on the pseudorapidity of the cluster of calorimeter cells are the same as for reconstructed electrons (cf. Section 4.1). Events with an off-line reconstructed electron satisfying loose identification requirements [71] (these loose identification
Large-R jet mass [GeV] 0 50 100 150 200 250 300 350 400 450 Events / 40 GeV 2000 4000 6000 8000 10000 12000 ATLAS = 8 TeV s , -1 L dt = 20.3 fb
∫
C/A R=1.5 Data (matched) t t (not matched) t t Single top W+jets Syst. uncertainty Exp. uncertainty Mod. uncertaintyLarge-R jet mass [GeV] 0 50 100 150 200 250 300 350 400 450 Data/Sim. 0.5 1 1.5 (a) [GeV] T Large-R jet p 200 250 300 350 400 450 500 550 600 650 700 Events / 50 GeV 2000 4000 6000 8000 10000 12000 14000 16000 ATLAS = 8 TeV s , -1 L dt = 20.3 fb
∫
C/A R=1.5 Data (matched) t t (not matched) t t Single top W+jets Syst. uncertainty Exp. uncertainty Mod. uncertainty [GeV] T Large-R jet p 200 250 300 350 400 450 500 550 600 650 700 Data/Sim. 0.5 1 1.5 (b)Figure 2: Detector-level distributions of (a) the mass and (b) the transverse momentum of the highest-pT C/A
R= 1.5 jet in events passing the signal-sample selection (t¯t) with at least one C/A R = 1.5 jet with pT> 200 GeV.
The vertical error bar indicates the statistical uncertainty of the measurement. Also shown are distributions for simulated SM contributions with systematic uncertainties (described in Section6) indicated as a band. The t¯t prediction is split into a matched part for which the large-R jet axis is within∆R = 1.0 of the flight direction of a hadronically decaying top quark and a not matched part for which this criterion does not hold. The ratio of measurement to prediction is shown at the bottom of each subfigure and the error bar and band give the statistical and systematic uncertainties of the ratio, respectively. The impacts of experimental and t¯t modelling uncertainties are shown separately for the ratio.
requirements do not include isolation criteria) are rejected to reduce contributions from electroweak pro-cesses. Only large-R jets well separated from the electron-trigger candidate are studied. This selection provides a sample that is largely dominated by multijet production, for which the electron-trigger can-didate is a jet misidentified as an electron. Events are required to be selected by the trigger for electrons with pT > 60 GeV and not by the trigger for isolated electrons with a threshold of 24 GeV (described
in Section4.2.1). Not using the isolated electron trigger reduces top-quark contamination in the selec-ted jet sample. The fraction of t¯t events before requiring a tagged top candidate is negligible. After requiring a tagged top candidate, the t¯t events are subtracted for the top taggers for which they present a non-negligible part of the sample, as detailed in Section8.2.
At least one large-R jet is required with a jet axis separated from the electron-trigger object by∆R > 1.5. The algorithm, radius parameter, and pT threshold of the jet depend on the particular top-tagging
algorithm under study (see Table1). If several large-R jets satisfying these criteria are found, only the jet with the highest pT is considered for the study of the misidentification rate. This choice does not bias the
measurements, because the misidentification rate is measured as a function of the large-R-jet pT.
5. Top-tagging techniques
Top tagging classifies a given large-R jet as a top jet if its substructure satisfies certain criteria. This paper examines several top-tagging methods, which differ in their substructure analysis and which are described in the following subsections.
Due to the different substructure criteria applied, the methods have different efficiencies for tagging signal jets and different misidentification rates for background jets. High efficiency is obtained for loose criteria and implies a high misidentification rate. The performance of the taggers in terms of efficiencies and misidentification rates is provided in Section7.1.
5.1. Substructure-variable taggers
The choice of trimmed anti-kt R = 1.0 jets (as defined in Section4.1) for substructure-based analyses
has been previously studied in detail [18], including comparisons of different grooming techniques and parameters. The following jet-substructure variables are used for top tagging in this analysis:
• trimmed mass - The mass, m, of the trimmed anti-kt R = 1.0 jets is less susceptible to energy
depositions from pile-up and the underlying event than the mass of the untrimmed jet. On average, large-R jets containing top-quark decay products have a larger mass than background jets.
• ktsplitting scales- The kt splitting scales [87] are a measure of the scale of the last recombination
steps in the ktalgorithm, which clusters high-momentum and large-angle proto-jets last. Hence, the
kt splitting scales are sensitive to whether the last recombination steps correspond to the merging
of the decay products of massive particles. They are determined by reclustering the constituents of the trimmed large-R jet with the kt algorithm and are defined as
q
di j = min(pTi, pT j) ×∆Ri j , (1)
in which∆Ri j is the distance between two subjets i and j in η–φ space, and pTi and pT j are the
corresponding subjet transverse momenta. Subjets merged in the last kt clustering step provide
the √d12observable, and
√
d23 is the splitting scale of the second-to-last merging. The expected
value of the first splitting scale √d12for hadronic top-quark decays captured fully in a large-R jet
is approximately mt/2, where mt is the top quark mass. The second splitting scale
√
d23 targets the hadronic decay of the W boson with an expected value of approximately mW/2. The use of
the splitting scale for W-boson tagging in 8 TeV ATLAS data is explored in Ref. [88]. Background jets initiated by hard gluons or light quarks tend to have smaller values of the splitting scales and exhibit a steeply falling spectrum.
• N-subjettiness - The N-subjettiness variables τN[89,90] quantify how well jets can be described as
containing N or fewer subjets. The N subjets found by an exclusive ktclustering of the constituents
of the trimmed large-R jet define axes within the jet. The quantity τN is given by the pT-weighted
sum of the distances of the constituents from the subjet axes: τN = 1 d0 X k pTk×∆Rmink with d0≡ X k pTk× R , (2)
in which pTkis the transverse momentum of constituent k,∆Rmink is the distance between constituent
kand the axis of the closest subjet, and R is the radius parameter of the large-R jet. The ratio τ3/τ2
(denoted τ32) provides discrimination between large-R jets formed from hadronically decaying top
quarks with high transverse momentum (top jets) which have a 3-prong subjet structure (small values of τ32) and non-top jets with two or fewer subjets (large values of τ32). Similarly, the ratio
τ2/τ1 ≡ τ21 is used to separate large-R jets with a 2-prong structure (hadronic decays of Z or W
The variable τ21is studied in the context of W-boson tagging with the ATLAS and CMS detectors
in Ref. [88] and Ref. [91], respectively. A method that distinguishes hadronically decaying high-pT
Zbosons from W bosons is studied in Ref. [92].
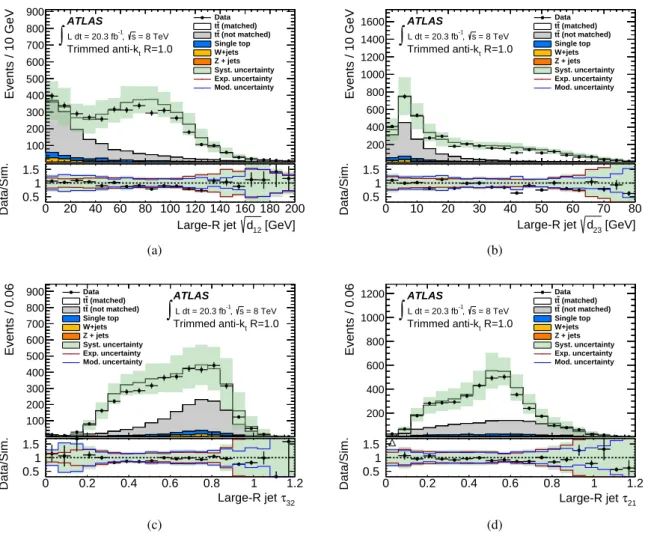
Distributions of the ktsplitting scales and N-subjettiness variables for large-R jets in a top-quark-enriched
event sample (cf. Section4.2.1) are shown in Figure 3. The √d12 distribution shows a broad shoulder
at values above 40 GeV and the matched t¯t contribution exhibits a peak near mt/2 as expected. For the
not-matched t¯t contribution and the W+jets process, √d12takes on smaller values and the requirement of a minimum value of √d12can be used to increase the ratio of top-quark signal to background (S /B). For
the second splitting scale √d23, signal and background are less well separated than for
√ d12, but
√ d23
also provides signal–background discrimination. The distribution of τ32 shows the expected behaviour,
with the matched t¯t contribution having small values, because the hadronic top-quark decay is better described by a three-subjet structure than by two subjets. For not-matched t¯t and W+jets production, the distribution peaks at ≈ 0.75. Requiring a maximum value of τ32increases the signal-to-background ratio.
For τ21, the separation of signal and background is less pronounced, but values above 0.8 are obtained
primarily for background. Thus, τ21also provides signal–background discrimination.
The distributions are well described by the simulation of SM processes within systematic uncertainties, which are described in Section6. For all distributions shown, the large-R JES, t¯t generator, and parton-shower uncertainties give sizeable contributions, as do the uncertainties of the modelling of the respective substructure variables shown. The uncertainties for √d12 and √d23 are dominated by the t¯t generator and ISR/FSR uncertainties, respectively, for low values of the substructure variable. Low values of these variables are mainly present for not-matched t¯t, for which the modelling is particularly sensitive to the amount of high-pTradiation in addition to t¯t, because these large-R jets do not primarily originate from
hadronically decaying top quarks. The modelling of additional radiation in t¯t events is also an important uncertainty for the number of events at low values of τ32and τ21, for which the t¯t ISR/FSR uncertainties
dominate the total uncertainty. The modelling of the substructure variables themselves dominates for high values of √d12,
√
d23, τ32, and τ21.
Different top taggers, based on these substructure variables, are defined (Table2). A large-R jet is tagged as a top jet by the corresponding tagger if the top-tagging criteria are fulfilled. Substructure tagger III was optimized for a search for t¯t resonances in the single-lepton channel [17]. Compared to other taggers, it has a rather high efficiency and misidentification rate because the analysis required only little background rejection, as the background was already much reduced by a lepton requirement. Removing the mass requirement or the requirement on √d12 further increases the efficiency (taggers I and II). The W0 top
tagger was optimized for a search for tb resonances (W0) in the fully-hadronic decay mode [2], where a high background suppression is required. The efficiency of this tagger is therefore lower than that of taggers I to III. Taggers IV and V are introduced to study the effect of a requirement on √d23in addition
to the requirements of tagger III.
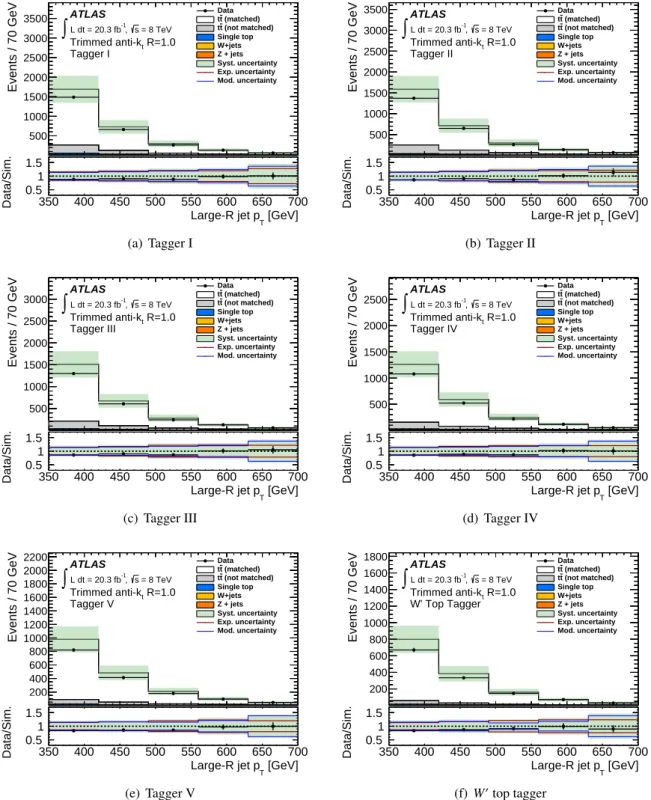
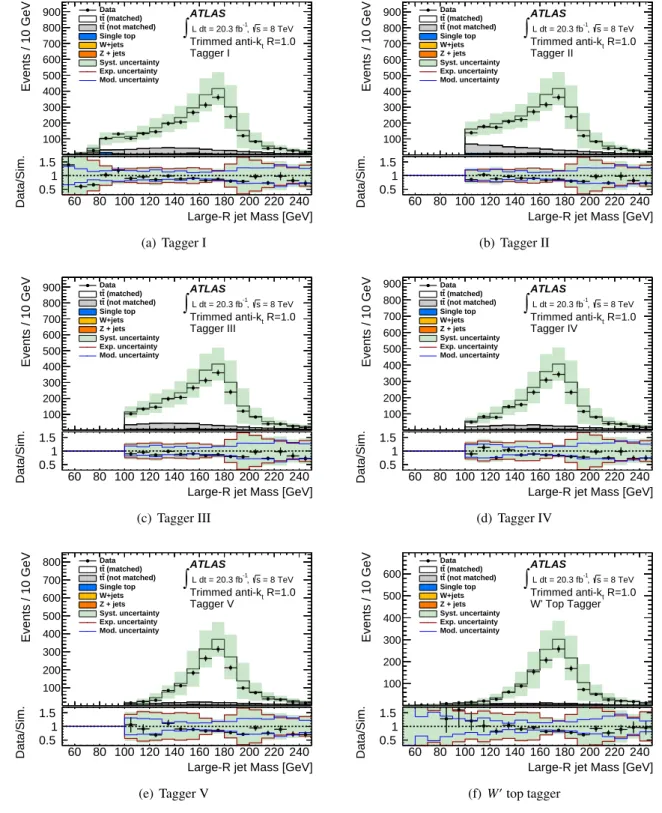
Distributions of the pT and mass of trimmed anti-kt R = 1.0 jets after applying the six different taggers
based on substructure variables are shown in Figures4 and5, respectively, for events passing the full signal selection of Section4.2.1. While the pTspectra look similar after tagging by the different taggers,
the mass spectra differ significantly due to the different substructure-variable requirements imposed by the taggers. Taggers II to V require the mass to be greater than 100 GeV, and this cut-off is visible in the distributions. The mass distribution after the √d12 > 40 GeV requirement of Tagger I (Figure5(a))
differs from that of the pre-tag distribution (Figure1(a)), because √d12 is strongly correlated with the trimmed mass. The impact of the √d12 > 40 GeV requirement plus the N-subjettiness requirements of
0 20 40 60 80 100 120 140 160 180 200 Events / 10 GeV 100 200 300 400 500 600 700 800 900 Data (matched) t t (not matched) t t Single top W+jets Z + jets Syst. uncertainty Exp. uncertainty Mod. uncertainty ATLAS = 8 TeV s , -1 L dt = 20.3 fb
∫
R=1.0 t Trimmed anti-k [GeV] 12 d Large-R jet 0 20 40 60 80 100 120 140 160 180 200 Data/Sim. 0.5 1 1.5 (a) 0 10 20 30 40 50 60 70 80 Events / 10 GeV 200 400 600 800 1000 1200 1400 1600 Datatt (matched) (not matched) t t Single top W+jets Z + jets Syst. uncertainty Exp. uncertainty Mod. uncertainty ATLAS = 8 TeV s , -1 L dt = 20.3 fb∫
R=1.0 t Trimmed anti-k [GeV] 23 d Large-R jet 0 10 20 30 40 50 60 70 80 Data/Sim. 0.5 1 1.5 (b) 0 0.2 0.4 0.6 0.8 1 1.2 Events / 0.06 100 200 300 400 500 600 700 800 900 Data (matched) t t (not matched) t t Single top W+jets Z + jets Syst. uncertainty Exp. uncertainty Mod. uncertainty ATLAS = 8 TeV s , -1 L dt = 20.3 fb∫
R=1.0 t Trimmed anti-k 32 τ Large-R jet 0 0.2 0.4 0.6 0.8 1 1.2 Data/Sim. 0.5 1 1.5 (c) 0 0.2 0.4 0.6 0.8 1 1.2 Events / 0.06 200 400 600 800 1000 1200 Data (matched) t t (not matched) t t Single top W+jets Z + jets Syst. uncertainty Exp. uncertainty Mod. uncertainty ATLAS = 8 TeV s , -1 L dt = 20.3 fb∫
R=1.0 t Trimmed anti-k 21 τ Large-R jet 0 0.2 0.4 0.6 0.8 1 1.2 Data/Sim. 0.5 1 1.5 (d)Figure 3: Detector-level distribution of substructure variables of the highest-pT trimmed anti-kt R = 1.0 jet with
pT > 350 GeV in events passing the signal selection. The splitting scales (a)
√
d12 and (b)
√
d23 and the
N-subjettiness ratios (c) τ32 and (d) τ21 are shown. The vertical error bar indicates the statistical uncertainty of the
measurement. Also shown are distributions for simulated SM contributions with systematic uncertainties (described in Section6) indicated as a band. The t¯t prediction is split into a matched part for which the large-R jet axis is within ∆R = 0.75 of the flight direction of a hadronically decaying top quark and a not matched part for which this criterion does not hold. The ratio of measurement to prediction is shown at the bottom of each subfigure and the error bar and band give the statistical and systematic uncertainties of the ratio, respectively. The impacts of experimental and t¯tmodelling uncertainties are shown separately for the ratio.
Tagger Top-tagging criterion Substructure tagger I √d12> 40 GeV Substructure tagger II m> 100 GeV
Substructure tagger III m> 100 GeV and √d12> 40 GeV
Substructure tagger IV m> 100 GeV and √d12> 40 GeV and
√
d23> 10 GeV
Substructure tagger V m> 100 GeV and √d12> 40 GeV and
√
d23> 20 GeV
W0top tagger √d12> 40 GeV and 0.4 < τ21< 0.9 and τ32< 0.65
the W0top tagger on the mass spectrum is visible by comparing Figure5(f)with the pre-tag distribution (Figure1(a)). The prominent peak around the top-quark mass shows that the sample after tagging is pure in jets which contain all three decay products of the hadronic top-quark decay.
All distributions are described by the MC simulation within uncertainties, indicating that the kinematics and the substructure of tagged large-R jets are well modelled by simulation. The uncertainty in the large-R jet pTrequiring a top tag is dominated by the large-R JES and the parton-shower and t¯t generator
uncertainties. Hence, the same uncertainties dominate in the different regions of the pTspectrum as before
requiring a top tag (Section4.2.1). The uncertainty on the large-R-jet mass distributions is dominated by the jet-mass scale uncertainty for all substructure taggers. The large-R JES as well as t¯t modelling uncertainties also contribute, but have a smaller impact. For all substructure taggers, the uncertainties in the substructure variables used in the respective taggers have a non-negligible impact, in particular for low large-R jet masses, i.e. in the regime which is sensitive to the modelling of not-matched t¯t and extra radiation.
5.2. Shower Deconstruction
In Shower Deconstruction (SD) [19, 20], likelihoods are separately calculated for the scenario that a given large-R jet originates from a hadronic top-quark decay and for the scenario that it originates from a background process. The likelihoods are calculated from theoretical hypotheses, which for the application in this paper correspond to the SM. The signal process is the hadronic decay of a top quark and for the background process, the splitting of hard gluons into q ¯q is considered. For signal and background, the effect of the parton shower is included in the calculation of the likelihood. Subjets of the large-R jet are used as proxies for partons in the underlying model and a weight is calculated for each possible shower that leads to the observed subjet configuration. This weight is proportional to the probability that the assumed initial particle generates the final configuration, taking into account the SM amplitude for the underlying hard process and the Sudakov form factors for the parton shower. A discriminating variable χ is calculated as the ratio of the sum of the signal-hypothesis weights to the sum of the background-hypothesis weights. For a set {pκi} of N observed subjet four-momenta pκi, in which i ∈ [1, N], the value of χ is given by χ({pκ i})= P perm.P({pκi}|signal) P perm.P({pκi}|background) , (3)
with P({pκi}|signal) being the weight for the hypothesis that a signal process leads to the observed con-figuration {pκi} and the sum in the numerator is over all showers, in which signal processes lead to this configuration. Similarly, the denominator sums the weights for the background processes. If χ is larger than a certain cut value, the large-R jet is tagged as a top jet. By adjusting the threshold value for χ, the tagging efficiency can be changed continuously.
The inputs to SD are the four-momenta of the subjets in the large-R jet. SD has an internal mechanism to suppress pile-up, which is based on the fact that the weights of the likelihood ratio contain the probability that a subset of the subjets did not originate from the hard interaction but are the result of pile-up. Details can be found in Refs. [19, 20]. In this paper, trimmed anti-kt R = 1.0 jets are used as input to SD, but
the subjets of the untrimmed jet are fed to the SD algorithm, and the kinematic properties (pT, η) of
the trimmed jet are only used to preselect the signal sample. This procedure avoids interference of the trimming with the SD-internal pile-up suppression.
350 400 450 500 550 600 650 700 Events / 70 GeV 500 1000 1500 2000 2500 3000 3500 Data (matched) t t (not matched) t t Single top W+jets Z + jets Syst. uncertainty Exp. uncertainty Mod. uncertainty ATLAS = 8 TeV s , -1 L dt = 20.3 fb
∫
R=1.0 t Trimmed anti-k Tagger I [GeV] T Large-R jet p 350 400 450 500 550 600 650 700 Data/Sim. 0.5 1 1.5 (a) Tagger I 350 400 450 500 550 600 650 700 Events / 70 GeV 500 1000 1500 2000 2500 3000 3500 Data (matched) t t (not matched) t t Single top W+jets Z + jets Syst. uncertainty Exp. uncertainty Mod. uncertainty ATLAS = 8 TeV s , -1 L dt = 20.3 fb∫
R=1.0 t Trimmed anti-k Tagger II [GeV] T Large-R jet p 350 400 450 500 550 600 650 700 Data/Sim. 0.5 1 1.5 (b) Tagger II 350 400 450 500 550 600 650 700 Events / 70 GeV 500 1000 1500 2000 2500 3000 Data (matched) t t (not matched) t t Single top W+jets Z + jets Syst. uncertainty Exp. uncertainty Mod. uncertainty ATLAS = 8 TeV s , -1 L dt = 20.3 fb∫
R=1.0 t Trimmed anti-k Tagger III [GeV] T Large-R jet p 350 400 450 500 550 600 650 700 Data/Sim. 0.5 1 1.5 (c) Tagger III 350 400 450 500 550 600 650 700 Events / 70 GeV 500 1000 1500 2000 2500 Data (matched) t t (not matched) t t Single top W+jets Z + jets Syst. uncertainty Exp. uncertainty Mod. uncertainty ATLAS = 8 TeV s , -1 L dt = 20.3 fb∫
R=1.0 t Trimmed anti-k Tagger IV [GeV] T Large-R jet p 350 400 450 500 550 600 650 700 Data/Sim. 0.5 1 1.5 (d) Tagger IV 350 400 450 500 550 600 650 700 Events / 70 GeV 200 400 600 800 1000 1200 1400 1600 1800 2000 2200 Data (matched) t t (not matched) t t Single top W+jets Z + jets Syst. uncertainty Exp. uncertainty Mod. uncertainty ATLAS = 8 TeV s , -1 L dt = 20.3 fb∫
R=1.0 t Trimmed anti-k Tagger V [GeV] T Large-R jet p 350 400 450 500 550 600 650 700 Data/Sim. 0.5 1 1.5 (e) Tagger V 350 400 450 500 550 600 650 700 Events / 70 GeV 200 400 600 800 1000 1200 1400 1600 1800 Data (matched) t t (not matched) t t Single top W+jets Z + jets Syst. uncertainty Exp. uncertainty Mod. uncertainty ATLAS = 8 TeV s , -1 L dt = 20.3 fb∫
R=1.0 t Trimmed anti-k W' Top Tagger [GeV] T Large-R jet p 350 400 450 500 550 600 650 700 Data/Sim. 0.5 1 1.5 (f) W0 top taggerFigure 4: Detector-level distributions of the pT of the highest-pT trimmed anti-kt R = 1.0 jet after tagging with
different top taggers based on substructure variables in events passing the signal selection. The vertical error bar in-dicates the statistical uncertainty of the measurement. Also shown are distributions for simulated SM contributions with systematic uncertainties (described in Section6) indicated as a band. The t¯t prediction is split into a matched part for which the large-R jet axis is within∆R = 0.75 of the flight direction of a hadronically decaying top quark and a not matched part for which this criterion does not hold. The ratio of measurement to prediction is shown at the bottom of each subfigure and the error bar and band give the statistical and systematic uncertainties of the ratio,
60 80 100 120 140 160 180 200 220 240 Events / 10 GeV 100 200 300 400 500 600 700 800 900 Data (matched) t t (not matched) t t Single top W+jets Z + jets Syst. uncertainty Exp. uncertainty Mod. uncertainty ATLAS = 8 TeV s , -1 L dt = 20.3 fb
∫
R=1.0 t Trimmed anti-k Tagger ILarge-R jet Mass [GeV] 60 80 100 120 140 160 180 200 220 240 Data/Sim. 0.5 1 1.5 (a) Tagger I 60 80 100 120 140 160 180 200 220 240 Events / 10 GeV 100 200 300 400 500 600 700 800 900 Data (matched) t t (not matched) t t Single top W+jets Z + jets Syst. uncertainty Exp. uncertainty Mod. uncertainty ATLAS = 8 TeV s , -1 L dt = 20.3 fb
∫
R=1.0 t Trimmed anti-k Tagger IILarge-R jet Mass [GeV] 60 80 100 120 140 160 180 200 220 240 Data/Sim. 0.5 1 1.5 (b) Tagger II 60 80 100 120 140 160 180 200 220 240 Events / 10 GeV 100 200 300 400 500 600 700 800 900 Data (matched) t t (not matched) t t Single top W+jets Z + jets Syst. uncertainty Exp. uncertainty Mod. uncertainty ATLAS = 8 TeV s , -1 L dt = 20.3 fb
∫
R=1.0 t Trimmed anti-k Tagger IIILarge-R jet Mass [GeV] 60 80 100 120 140 160 180 200 220 240 Data/Sim. 0.5 1 1.5 (c) Tagger III 60 80 100 120 140 160 180 200 220 240 Events / 10 GeV 100 200 300 400 500 600 700 800 900 Data (matched) t t (not matched) t t Single top W+jets Z + jets Syst. uncertainty Exp. uncertainty Mod. uncertainty ATLAS = 8 TeV s , -1 L dt = 20.3 fb
∫
R=1.0 t Trimmed anti-k Tagger IVLarge-R jet Mass [GeV] 60 80 100 120 140 160 180 200 220 240 Data/Sim. 0.5 1 1.5 (d) Tagger IV 60 80 100 120 140 160 180 200 220 240 Events / 10 GeV 100 200 300 400 500 600 700 800 Data (matched) t t (not matched) t t Single top W+jets Z + jets Syst. uncertainty Exp. uncertainty Mod. uncertainty ATLAS = 8 TeV s , -1 L dt = 20.3 fb
∫
R=1.0 t Trimmed anti-k Tagger VLarge-R jet Mass [GeV] 60 80 100 120 140 160 180 200 220 240 Data/Sim. 0.5 1 1.5 (e) Tagger V 60 80 100 120 140 160 180 200 220 240 Events / 10 GeV 100 200 300 400 500 600 Data (matched) t t (not matched) t t Single top W+jets Z + jets Syst. uncertainty Exp. uncertainty Mod. uncertainty ATLAS = 8 TeV s , -1 L dt = 20.3 fb
∫
R=1.0 t Trimmed anti-k W' Top TaggerLarge-R jet Mass [GeV] 60 80 100 120 140 160 180 200 220 240 Data/Sim. 0.5 1 1.5 (f) W0 top tagger
Figure 5: Distribution of the mass of the highest-pT trimmed anti-kt R = 1.0 jet after tagging with different top
taggers based on substructure variables in events passing the signal selection. The vertical error bar indicates the statistical uncertainty of the measurement. Also shown are distributions for simulated SM contributions with systematic uncertainties (described in Section6) indicated as a band. The t¯t prediction is split into a matched part for which the large-R jet axis is within∆R = 0.75 of the flight direction of a hadronically decaying top quark and a not matched part for which this criterion does not hold. The ratio of measurement to prediction is shown at the
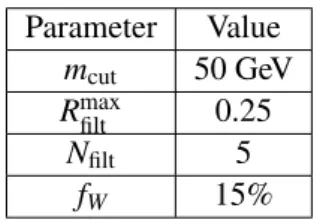
To obtain the best SD performance, the smallest structures in the flow of particles should be resolved by the subjets used as input to SD. Therefore, C/A R= 0.2 subjets are used, as they are the jets with the smal-lest radius parameter for which ATLAS calibrations and calibration uncertainties have been derived [18, 76]. Only the nine hardest subjets of the large-R jet are used in the present study to reduce the processing time per event, which grows with the number of subjets considered in the calculation. The signal weight is zero for large-R jets with fewer than three subjets because a finite signal weight requires the existence of at least three subjets which are identified with the three partons from the top-quark decay. To speed up the computation of the signal weights, the signal weight is set to zero if no combination of at least three subjets can be found that has an invariant mass within a certain range around the top-quark mass. The rationale for this mass requirement is that subjet combinations outside of this mass range would receive only a very small (but finite) weight due to the Breit–Wigner distribution assumed for the signal hypo-thesis. Similarly, a subset of the subjets which have a combined invariant mass close to the top-quark mass must give an invariant mass within a given range around the W-boson mass. Due to detector effects, the values of these ranges around the top-quark mass and the W-boson mass must be tuned to optimize the performance and cannot be extracted directly from the model. The values used in this study are a range of 40 GeV around a top-quark mass of 172 GeV and a range of 20 GeV around a W-boson mass of 80.4 GeV. For the background hypothesis, no constraint on the subjet multiplicity is present and also no mass-range requirements are imposed.
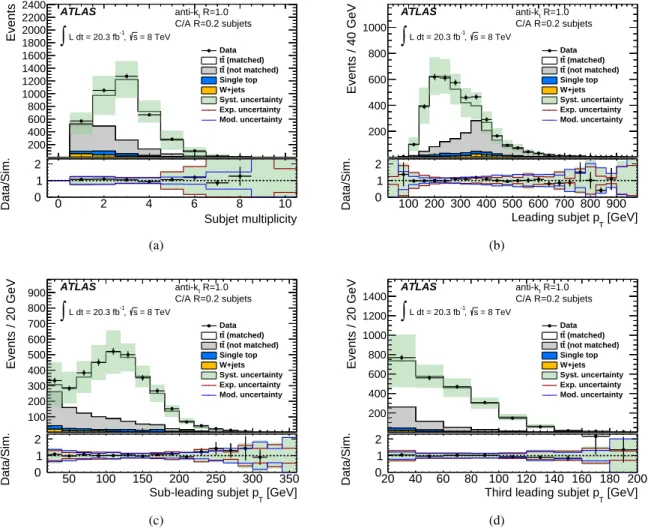
Distributions of the multiplicity and pT of C/A R = 0.2 subjets found in the untrimmed anti-kt R = 1.0
jets from the signal selection are shown in Figure6. These subjets are used as input to SD and must satisfy the kinematic constraints pT > 20 GeV and |η| < 2.1. The subjet multiplicity of the large-R jet is shown
in Figure6(a). Most of the large-R jets have two or three subjets and only a small fraction have more than four subjets. Of the large-R jets, 41% have fewer than three subjets and are hence assigned a SD signal weight of zero. The simulation describes the data within statistical and systematic uncertainties indicating that the input to the SD algorithm, the subjet multiplicity and kinematics, are well described. For two and three subjets, the uncertainty is dominated by uncertainties in the large-R JES and the PDF. For one subjet and for four or more subjets, as well, the uncertainty is dominated by the subjet energy-resolution uncertainty. The source of most events with only one subjet is not-matched t¯t, for which the modelling of additional low-pT radiation exceeding the minimum subjet pT depends on the precision of the subjet
energy scale and resolution. The same effect is present for four or more subjets, because hadronically decaying top quarks are expected to give rise to a distinct three-subjet structure and additional subjets may be due to additional low-pTradiation close to the top quark.
The pTdistributions of the three hardest subjets are shown in Figures6(b)–6(d). The pTof the highest-pT
subjet is larger than ≈ 100 GeV and has a broad peak from 200 to 400 GeV. The shoulder at 370 GeV is caused by large-R jets from not-matched t¯t and W+jets background, as many of these jets have only one subjet, as shown in Figure6(a), and in that case the single subjet carries most of the momentum of the large-R jet, i.e. most of the momentum is concentrated in the core of the jet. Therefore, the shoulder at 370 GeV is due to the requirement pT > 350 GeV for the large-R jet. The systematic uncertainty in
the region mainly populated by jets with one dominant subjet (pT > 350 GeV) or by jets with many
subjets (100 < pT < 150 GeV) in Figure6(a)has sizeable contributions from the modelling of the subjet
properties, here the subjet energy scale. While the large-R JES also contributes for 100 < pT < 150 GeV,
it is dominant for jets mainly showing the expected distinct two-subjet or three-subjet structure (150 < pT < 350 GeV). For pT > 500 GeV, the largest uncertainty results from the difference between the t¯t
generators, as this is the main source of uncertainties for the modelling of t¯t events in the upper range of the pTspectrum studied.
0 2 4 6 8 10 Events 200 400 600 800 1000 1200 1400 1600 1800 2000 2200 2400 Data (matched) t t (not matched) t t Single top W+jets Syst. uncertainty Exp. uncertainty Mod. uncertainty ATLAS = 8 TeV s , -1 L dt = 20.3 fb
∫
R=1.0 t anti-k C/A R=0.2 subjets Subjet multiplicity 0 2 4 6 8 10 Data/Sim. 0 1 2 (a) 100 200 300 400 500 600 700 800 900 Events / 40 GeV 200 400 600 800 1000 Data (matched) t t (not matched) t t Single top W+jets Syst. uncertainty Exp. uncertainty Mod. uncertainty ATLAS = 8 TeV s , -1 L dt = 20.3 fb∫
R=1.0 t anti-k C/A R=0.2 subjets [GeV] T Leading subjet p 100 200 300 400 500 600 700 800 900 Data/Sim. 0 1 2 (b) 50 100 150 200 250 300 350 Events / 20 GeV 100 200 300 400 500 600 700 800 900 Data (matched) t t (not matched) t t Single top W+jets Syst. uncertainty Exp. uncertainty Mod. uncertainty ATLAS = 8 TeV s , -1 L dt = 20.3 fb∫
R=1.0 t anti-k C/A R=0.2 subjets [GeV] T Sub-leading subjet p 50 100 150 200 250 300 350 Data/Sim. 0 1 2 (c) 20 40 60 80 100 120 140 160 180 200 Events / 20 GeV 200 400 600 800 1000 1200 1400 Data (matched) t t (not matched) t t Single top W+jets Syst. uncertainty Exp. uncertainty Mod. uncertainty ATLAS = 8 TeV s , -1 L dt = 20.3 fb∫
R=1.0 t anti-k C/A R=0.2 subjets [GeV] TThird leading subjet p 20 40 60 80 100 120 140 160 180 200 Data/Sim. 0
1 2
(d)
Figure 6: Detector-level distributions of C/A R = 0.2 subjets found in the untrimmed anti-kt R = 1.0 jet
corres-ponding to the highest-pT trimmed anti-kt R = 1.0 jet with pT > 350 GeV in the signal selection: (a) the subjet
multiplicity, and (b) the pTof the highest-pTsubjet, (c) the second-highest-pTsubjet, and (d) the third-highest-pT
subjet. The vertical error bar indicates the statistical uncertainty of the measurement. Also shown are distributions for simulated SM contributions with systematic uncertainties (described in Section6) indicated as a band. The t¯t prediction is split into a matched part for which the large-R jet axis is within∆R = 0.75 of the flight direction of a hadronically decaying top quark and a not matched part for which this criterion does not hold. The ratio of measurement to prediction is shown at the bottom of each subfigure and the error bar and band give the statistical and systematic uncertainties of the ratio, respectively. The impacts of experimental and t¯t modelling uncertainties are shown separately for the ratio.
For the second-highest subjet pT, the background distribution peaks near the 20 GeV threshold. These
are subjets in large-R jets with only two subjets where the highest-pTsubjet carries most of the large-R
jet momentum. These asymmetric configurations, where the highest-pT subjet carries a much larger pT
than the second-highest-pT subjet, are seen mainly for the not-matched t¯t and W+jets processes. The
acceptance limit at 20 GeV cuts into the pT distributions of all but the highest-pT subjet, as also seen
for the distribution of the third-highest-pT subjet. The uncertainties in the distributions of the
second-highest-pT and third-highest-pT subjet are again dominated by the uncertainty of the subjet modelling,
not-matched t¯t events) and for high values of pT. For intermediate values (60–150 GeV for the
second-highest-pT subjet and 40–100 GeV for the third-highest-pT subjet), where jets with a distinct top-like
subjet structure dominate the distributions, the large-R JES uncertainty dominates. If 40 < pT < 60 GeV
for the second-highest subjet, the large-R JES uncertainty contributes significantly, but does not dominate due to significant contributions from the PDF and generator uncertainties.
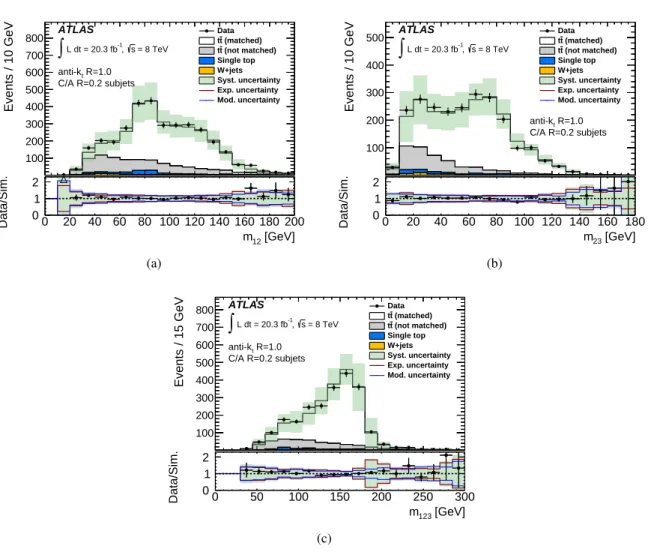
The following invariant masses of combinations of the C/A R = 0.2 subjets are shown in Figure7for events fulfilling the signal selection: the mass of the two highest-pTsubjets, m12, the mass of the
second-highest-pTand third-highest-pTsubjet, m23, and the mass of the three hardest subjets, m123. These
distri-butions illustrate some of the masses built from subjet combinations which are used by SD to reject subjet combinations that lead to masses outside the top-quark and W-boson mass ranges. Also these distributions are described by the simulation within statistical and systematic uncertainties and give further confidence in the description of the inputs to the SD algorithm. The uncertainty for large values of m12, m23 and
m123, i.e. for values larger than 140 GeV, 120 GeV and 165 GeV, respectively, is dominated by the subjet
energy-scale uncertainty, consistent with this uncertainty also being dominant for large values of the sub-jet transverse momenta (Figure6). The parts of the distributions which are populated with jets showing primarily a distinct top-like substructure again show large contributions from the large-R JES uncertainty (60 < m12< 140 GeV, 80 < m23< 120 GeV, 135 < m123< 165 GeV), where the ISR/FSR and the subjet
JES uncertainties also contribute for m23. For lower values, the three different invariant masses are all
sensitive to radiation effects in a region populated by not-matched t¯t events, i.e. jets which do not origin-ate from a hadronically decaying top quark. ISR/FSR uncertainties contribute to 20 < m12< 30 GeV, the
subjet energy resolution contributes significantly to m23< 60 GeV and m123< 135 GeV, and also the PDF
uncertainty has an increasing effect with increasing m23for 10 < m23< 60 GeV with the uncertainty from
the subjet energy resolution decreasing with increasing m23. For 20 < m12 < 30 GeV, the large-R JES
uncertainty dominates the total uncertainty together with the ISR/FSR uncertainty. For m23< 10 GeV, the
uncertainty is dominated by the uncertainty on the subjet energy resolution and the differences between the t¯t generators. For 30 < m12 < 60 GeV, the choice of t¯t generator and the large-R JES dominate the
total uncertainty.
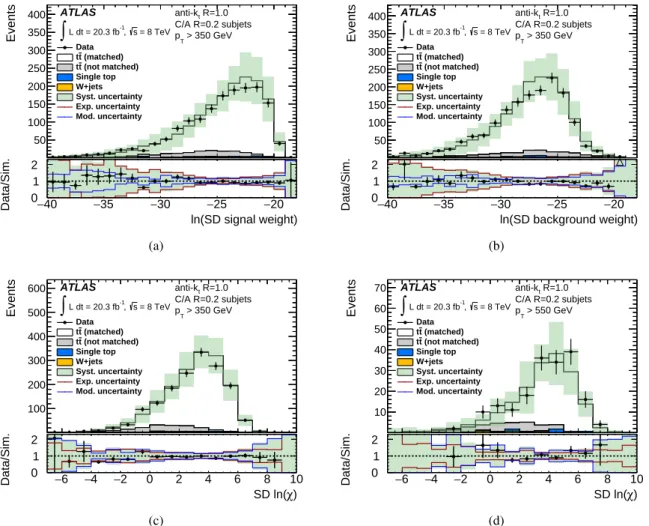
The distributions of the SD weights and the ratio of the weights, i.e. the final discriminant χ (Eq. (3)), are shown in Figure 8for events fulfilling the signal-selection criteria. For ≈ 60% of the large-R jets, the signal weight is zero because there are fewer than three subjets or the top-quark or W-boson mass-window requirements are not met. These cases are not shown in Figure8. The natural logarithm of the sumP
perm.P({pκi}|signal) of all weights obtained with the assumption that the subjet configuration in the
large-R jet is the result of a hadronic top-quark decay is shown in Figure 8(a). The logarithm of the sum of all weights for the background hypothesis is shown in Figure8(b). For the signal hypothesis the distribution peaks between −23 and −21, while for the background hypothesis the peak is at lower values, between −26 and −25. The logarithm of the ratio of the sums of the weights χ, is shown in Figure8(c). The ln χ distribution is also shown in Figure8(d)for large-R jet pT > 550 GeV, which defines a different
kinematic regime for which the probability to contain all top-quark decay products in the large-R jet is higher than for the lower threshold of 350 GeV. All distributions of SD output variables are described by simulation within the statistical and systematic uncertainties. The subjet energy-resolution uncertainty dominates for low values of the logarithm of the SD signal weight (region < −26), the logarithm of the SD background weight (region < −30) and ln χ (region < 1 in Figure8(c)). Hence, this uncertainty dominates, consistent with the observations in previous figures, in the phase space not primarily populated by jets from hadronically decaying top quarks. The large-R JES contributes significantly for the central parts of the signal-weight distribution, i.e. from −26 to −23 in Figure8(a), and ln χ, i.e. from 1 to 5 in Figure8(c). In the region, 1 < ln χ < 5, there are equally large contributions to the total uncertainty from