Developmental Profile of Young Children with Autism Spectrum
Disorder Submitted to Early Childhood Intervention
Joana Isabel de Figueiredo Corrêa de Barros Braz
6º ano
Mestrado Integrado em Medicina
Joana Isabel de Figueiredo Corrêa de Barros Braz
Developmental Profile of Young Children with Autism Spectrum
Disorder Submitted to Early Childhood Intervention
Dissertation for application to the Master’s degree in
Medicine, submitted to the Institute of Biomedical
Sciences Abel Salazar of University of Porto.
Mentor – Paula Maria Figueiredo Pinto de Freitas,
MD, PhD.
Assistant Professor at the Institute of Biomedical
Sciences Abel Salazar - University of Porto
Affiliation - Institute of Biomedical Sciences Abel
Salazar of University of Porto
Address - Rua de Jorge Viterbo Ferreira, nº 228,
4050-313 Porto
1 Table of Contents Resumo ... 2 Abstract ... 3 Abbreviations ... 4 Introduction ... 5 Objective ... 6 Methods ... 7 Study Design ... 7 Sample Selection... 7 Eligibility Criteria ... 7 Variables ... 7 Procedures ... 7 Data Sources ... 8
Methods of Measurement Analysed ... 8
Griffiths Mental Development Scales ... 8
The Autism Diagnostic Observation Schedule ... 8
Study Size ... 9 Data Analysis ... 9 Study Approval ... 9 Results ... 10 Demographic Data... 10 Developmental Profile ... 12
Griffiths Mental Development Scales ... 13
Autism Diagnostic Observation Schedule ... 18
Expressive Language and ADOS Modules ... 23
Discussion ... 24
Acknowledgment ... 28
Bibliography ... 29
2 Resumo
Introdução | A prevalência das Perturbações do Espetro do Autismo (PEA), tem vindo a
aumentar, sendo esta uma doença de etiologia ainda mal definida e para a qual não existe tratamento curativo. A Intervenção Precoce (IP) surge como forma de apoio às crianças e suas famílias e também de melhorar o prognóstico. A comparação do Perfil Desenvolvimental das crianças nos momentos da admissão e da alta após a intervenção propicia um melhor conhecimento dos efeitos do programa implementado.
Objetivo | Avaliar o Perfil Desenvolvimental de crianças com diagnóstico de Perturbação
do Espetro de Autismo sujeitas a Intervenção Precoce na APPDA-Norte a partir da avaliação desenvolvimental realizada em dois momentos: admissão e alta.
Metodologia | Estudo analítico de uma coorte histórica de crianças, com diagnóstico de
Perturbação do Espetro de Autismo, sujeitas a Plano Individual de Intervenção Precoce (PIIP) na APPDA-Norte, entre 2008 e 2014, com tempo de intervenção mínimo de um ano letivo. Os dados foram colhidos dos processos clínicos anonimizados.
Resultados | Da amostra de 29 crianças, com Perturbação do Espetro de Autismo,
82,8% eram rapazes, resultando num ratio masculino/feminino de 5:1. Destas crianças, 55,2% frequentava o infantário e a maioria tinha apoio educativo por educadora de ensino especial. Grande parte das mães tinha 25 a 39 anos ao nascimento do filho e 62% dos pais tinham entre 30 e 40 anos. A idade média de admissão é de 3,5 anos e a duração média da intervenção é de 2,4 anos. O ADOS Total-CSS após a intervenção mostrou agravamento estatisticamente significativo em relação à admissão, (n=13), Z=-2,101,
p=0,036, 2-tailed. Os resultados do Quociente Geral da Griffiths Final apresentaram
valores mais altos que os do Quociente Geral da Griffiths Inicial, com diferença estatisticamente significativa, (n=19) Z=-2,05, p=0,04.
Conclusão | O estudo ajuda a caracterizar o Perfil Desenvolvimental de crianças com
PEA antes e após a intervenção, ressaltando a necessidade de uma amostra maior para aumentar a validade estatística. A gravidade da PEA (n=13) aumentou significativamente confirmando o diagnóstico de Autismo. Relativamente ao Perfil Desenvolvimental, o Quociente Geral da Griffiths apresenta, após a intervenção, uma melhoria com significância estatística, em grande parte pelos resultados alcançados nas áreas do desenvolvimento Pessoal e Social, Audição e Linguagem e Coordenação Motora-Visual. Estes dados suportam a importância da Intervenção Precoce no prognóstico da PEA.
Palavras-chave: Perturbação do Espetro de Autismo, Perfil Desenvolvimental, Escala de
Desenvolvimento Mental de Griffiths, ADOS, Intervenção Precoce, Plano Individual de Intervenção Precoce, APPDA-Norte.
3 Abstract
Introduction | Autism Spectrum Disorder (ASD) overall prevalence is increasing
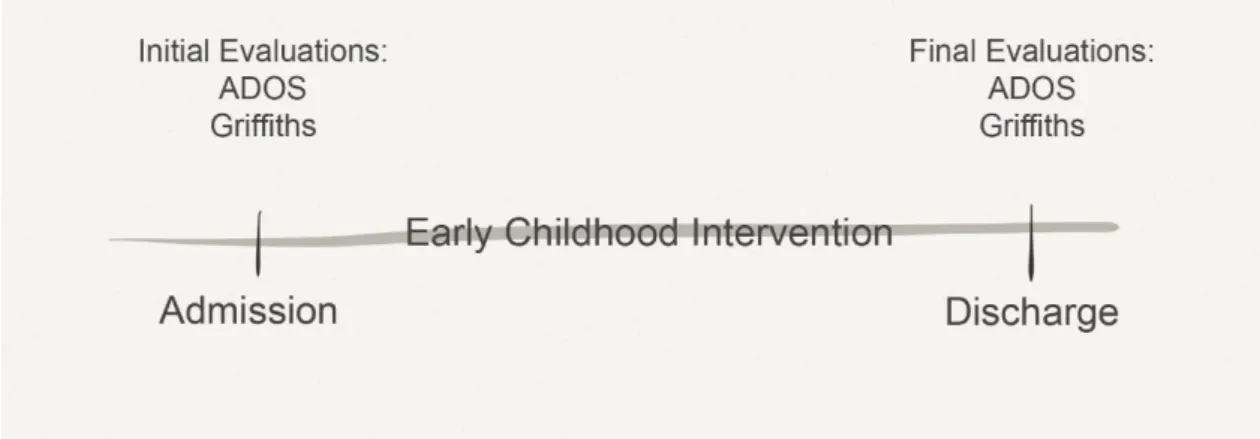
worldwide although it has no cure and the etiology is poorly understood. In this scenario, Early Childhood Intervention (ECI) offers a way to support children with ASD and their family as well as to improve prognosis. Comparing the children Developmental Profiles before and after the intervention could help enlighten the methods and the outcome of the Early Childhood Intervention program.
Objective | To assess the Developmental Profile of young children diagnosed with ASD
who underwent ECI at APPDA-Norte using the developmental exams ADOS-Generic and Griffiths Mental Developmental Scales, in two moments: admission and discharge of ECI.
Methods | Analytic observational study of a historical cohort of young children with ASD,
submitted to ECI, from 2004 to 2014, with minimum ECI length of 1 academic year and complete ADOS-G and/or Griffiths at the admission and discharge. Data collected from anonymized medical records at APPDA-Norte.
Results | Of the sample of 29 young children with ASD, 82,8% were boys, presenting a
male-to-female ratio of 5:1. Nurseries were attended by 55,2% of the children and most of them with a special needs education support. The families were mainly of the nuclear type with 1 or 2 children. The majority of the mothers were 25 to 39 years old at birth while the fathers were a bit older, 62% between 30 and 40 years old. The mothers showed higher educational achievements while half the fathers (52%) stopped at 3rd Cycle of Basic Education. The mean age of admission for ECI was 3,5 years old and the mean duration of ECI was 2,4 years. ADOS Total-CSS Final Evaluation showed patent worsening with statistically significant difference from the Initial Evaluation, (n=13) Z=-2,101, p=0,036, 2-tailed. Griffiths GQ - Final Evaluation (after ECI) had higher scores than the Initial Evaluation, differing significantly with (n=19) Z=-2,05, p=0,04, 2-tailed.
Conclusion | The study helps characterize the Developmental Profiles of the children with
ASD before and after ECI and underlines the need to use a bigger sample to gain validity. ASD severity (n=13) increased significantly confirming the Autism diagnosis even after ECI. Nonetheless, Griffiths GQ final scores improved (26%, n=19) with overall statistical significance, mostly due to big development achievements on Personal-Social skills, Hearing and Language and Hand-Eye Coordination. This data reinforces the importance of Early Intervention.
Keywords: Autism Spectrum Disorders, Developmental Profile, Early Intervention,
Griffiths Mental Development Scale, Autism Diagnostic Observation Score (ADOS), APPDA-Norte.
4
Abbreviations
ADOS – Autism Diagnostic Observation Score
ADOS CSS - Autism Diagnostic Observation Score Calibrated Severity Scores
ADOS RRB-CSS - Autism Diagnostic Observation Score Restricted and Repetitive Behaviours Calibrated Severity Score.
ADOS SA-CSS – Autism Diagnostic Observation Score Social Affect Calibrated Severity Score.
ADOS T-CSS - Autism Diagnostic Observation Score Total Calibrated Severity Score. APPDA–Norte – Associação Portuguesa para as Perturbações do Desenvolvimento e Autismo
ASD – Autism Spectrum Disorder
CEACF – Centro de Estudos e Apoio à Criança e à Família
DSM-5 – Diagnostic and Statistical Manual of Mental Disorders, 5th Edition ECI – Early Childhood Intervention
EIIP – Early Intervention Individual Plan Griffiths – Griffiths Mental Development Scale Griffiths GQ – Griffiths General Quotient Griffiths SQ – Griffiths Subquotient
ICBAS – Instituto de Ciências Biomédicas de Abel Salazar IFSP – Individual Family Service Plan
5
Introduction Autism Spectrum Disorder (ASD) is a chronic neurodevelopmental disorder characterized by impaired verbal and nonverbal communication and social interaction, restricted interests and rigid and repetitive behaviours. Since 2013 this definition includes autistic disorder, childhood disintegrative disorder, pervasive developmental disorder – not otherwise specified (PDD-NOS) and Asperger syndrome following the new Diagnostic and Statistical Manual of Mental Disorders or DSM-5 (American Psychiatry Association, 2013) (1).
The overall prevalence of ASD in Europe is about 1% and in the USA (2)(3)(4)(5)(6), where many studies have addressed this subject, 1 in 68 children has been identified with ASD(7) in 2010. North American prevalence has undoubtedly been increasing since 2000 but it is unclear if it is a true increase in the number of people with ASD or consequence of a better effort in diagnosis and broader definition of the disorder.
ASD’s prevalence in Portuguese school-aged children was close to 10 per 10000 (8) in 2007.
The male-to-female ratio is high in overall studies ranging between 4 and 5 males to 1 female(3)(5)(9)(10).
Etiology is poorly understood and as research moves forward some risk factors are being uncovered, confirming the multifactorial etiology for the multiple types of ASD. Recent discoveries shed light upon some risk factors like parents’ age(11)(12)(13), pregnancy complications(14)(15) and genetic mutations(16).
Diagnosing ASD is difficult and the early diagnostic (before 30 months) even more since there is no biological markers and the development warning signs and their legibility vary according to inherent neurological challenges and its severity. Clinical variation can be huge and for that reason the diagnostic methods are updated regularly and are subject of constant study.
Child development refers to how children become able to do more complex things as they get older and it differs from growth definition as it refers to the children getting bigger in size. A normal child development is well described and a development delay is said to be occurred when a child does not reach developmental milestones which are a set of functional skills or age-specific tasks that most children do at a certain age. These skills can be divided in gross motor, fine motor, language, cognitive and social.
A pediatrician uses checklists and development milestones to help screening but the age (in months) in which a child reaches a milestone can fluctuate a bit.
ASD diagnosis is usually made by a developmental-behavioral pediatrician or a child and adolescent psychiatrist. After each diagnostic evaluation the child undergoes specialized intervention. An early intervention plan is designed individually (EIIP) with the child and
6
the family by multidisciplinary team of psychology, speech and language therapy and occupational therapy resulting in the IFSP (Individual Family Service Plan) and the EIIP (Early Intervention Individual Plan).(17)
Even though there isn’t a cure for ASD, it is believed that early diagnosis and ECI can significantly improve the prognosis of the disease.(18)(19)
According to the Portuguese governmental guidelines (Despacho Conjunto nº 891/99, from 19th October), “Early Childhood Intervention is an integrated service (support) provision, child-centred and family-centred, which must include preventive and habilitative interventions, namely, in what concerns education, health and social ones”.
The Associação Portuguesa para as Perturbações do Desenvolvimento e Autismo -
Norte (APPDA – Norte) was established in 1984 and since then it is a non-governmental,
private institution of social solidarity (IPSS) that supports the child with ASD and its family. In 2001 a new area was created - Centro de Estudos e Apoio à Criança e à Família (CEACF) which has specialized in Early Childhood Intervention. It consists of a multidisciplinary team of professionals (psychiatrist, psychologist, speech and language therapists, occupational therapists, special educators, social workers) that diagnoses, evaluates and supports children with ASD and age less than or equal to 6 years old and their families. Since its foundation it has supported about 80 children and families with a set of standardized procedures which include an initial evaluation, follow-up and a final evaluation. The average intervention time is thought to be of 3 years.
Objective To assess the Developmental Profiles of young children with ASD submitted to Early Childhood Intervention (ECI) at APPDA-Norte, using the developmental exams ADOS-Generic and Griffiths Mental Developmental Scales, in two moments: admission (from now on referred as Initial Evaluation) and discharge (from now on referred as Final Evaluation) of ECI.
7
Methods
Study Design
Analytic observational study of a historical cohort of patients.
Sample Selection
Children diagnosed with ASD who underwent Early Childhood Intervention at APPDA-Norte, from 2008 to 2014.
Eligibility Criteria
Minimum intervention length of 1 academic year (9 months considered). Finished ECI at APPDA-Norte.
Existence of complete development evaluations using ADOS and Griffiths scales.
Variables
Variables collected: child’s birth date, date of admission and date of discharge of the EI, parental age at birth, parental education, family type, number of siblings, attendance of nursery school at the date of admission, the initial and final results of Griffiths and ADOS scales for each child.
Exposure: Early Childhood Intervention by CEACF’s team at APPDA-Norte.
Procedures
A psychiatric evaluation was performed to all children admitted to APPDA by the APPDA-Norte’s Child and Adolescent Psychiatrist, who follows them through the ECI.
ECI was executed by the team of professionals of CEACF at APPDA-Norte.
ADOS and Griffiths scales examination were assessed by 2 trained psychologists, either one or another, from the team of CEACF at APPDA-Norte.
8 Data Sources
Data collected from anonymized medical records in paper, given by the psychiatrist or the psychologists of the APPDA-Norte.
Methods of Measurement Analysed
Scales used to measure child’s development and ASD’s severity at the Initial Evaluation and the Final Evaluation:
Griffiths Mental Development Scales – are used to measure the rate of development of infants and young children. Can be applied to children between 2 and 8 years old. An accredited training course and a kit of standard equipment are necessary for a qualified professional to apply the scale. The kit consists of 39 pieces such as building blocks; a drawing book and a record form(20). The examination has a duration of 50 to 60 minutes. Six subscales (A-F) are analysed and quoted as a mental age: Locomotor, Personal-Social, Hearing and Language (receptive and expressive), Hand and Eye coordination, Performance and Practical Reasoning (this latter being measured only in elder children). After that a coefficient between the mental age and the chronological age of the child is done for each of the subscales resulting in Sub-Quotients for each subscale (from A to F) and finally the mean is calculated giving each child a Griffiths General Quotient Score.(21) Clinical use of the Griffiths scales is restricted to psychologists, developmental pediatricians and child psychiatrists.
The bigger the value of the quotients, the better developmental achievement for each subscale and consequently for the mean value of the GQ (Griffiths General Quotient).
The Autism Diagnostic Observation Schedule (ADOS) is a semi structured, standardized assessment of social interaction, communication, play, and imaginative use of materials for individuals with ASD. The observational schedule consists of four 30 minute modules, each designed to be administered to different individuals according to their level of expressive language and age.(22) Module 1 is subdivided in “No Words” and “Some Words”; Module 2 requires mastering spontaneous, non-echoed phrases made up of three independent units one of which is a verb, regardless of age and is subdivided in “Younger than Age 5” and “Aged 5 Years or Older”(23). Module 3 is intended for verbally fluent children and Module 4 is for verbally fluent adolescents and adults. Use of expressive language was selected to determine the appropriate module for an individual because research has shown that expressive language is the strongest predictor of an individual’s ASD profile (24).
9
Then the behavioral items are scored for each 3 big domains: Communication and Reciprocal Social Interaction (Social Affect) and Restricted and Repetitive Behaviours raw values. These raw values are summed up into ADOS Total raw score. New 10-point calibrated severity scores (CSS) are mapped from ADOS raw totals according to standardized conversion tables: ADOS Social Affect CSS, ADOS Restrict and Repetitive Behaviours CSS(25) and ADOS Total-CSS(26). Finally, ADOS Total-CSS is divided in 3 thresholds, which results in a severity classification of: Non-spectrum (1-3); Autism Spectrum Disorder (4-5) and Classic Autism (6-10).
Summing up, the lower the value for each division the better developmental achievement and consequently for the total value as described above. The direction of the values is different from the Griffiths scale and is important for the correct interpretation of the developmental outcome after ECI.
Study Size
No sample size calculation was done. Sample size depended on the available historical data at APPDA-Norte.
Data Analysis
Analysed with IBM SPSS Statistics 24.
As the sample isn’t normally distributed and is of small size the following non-parametric tests were chosen according to the studied variables: Wilcoxon Signed-Rank test and Spearman’s Rank correlation coefficient.
Study Approval
Study methodology was approved by the Institutional Board Review and ICBAS Ethics Commission with the guarantee of participants’ identity protection and confidentiality of the collected data.
10
Results
From the initial sample, cases were excluded for not having neither of the developmental scales, due to misplaced registry and non-attendance to the scheduled evaluation. The total sample size analysed was of 29 children (24 boys and 5 girls).
Demographic Data n missing %
Sex
Boys 24 82,8
Girls 5 17,2
Nursery attendance at admission
Yes 16 2 55,2 No 11 37,9 Family Type Nuclear 19 65,5 Extended 7 24,1 Single parent 2 6,9 Others 1 3,4 Phratry 1 child 11 37,9 2 children 14 48,3 3 children 1 3,4 4 children 2 6,9 5 children 1 3,4
Mother’s age at birth (years)
< 20 1 3,4 20 – 24 3 10,3 25 – 29 6 20,7 30 – 34 8 27,6 35 – 39 9 31,0 40 or plus 2 6,9
Father’s age at birth (years)
<20 1 3,4 20 – 24 2 6,9 25 – 29 8 27,6 30 - 34 7 24,1 35 - 39 4 13,8 40 or plus 7 24,1 Mother’s Education
1st and 2nd cycle of Basic Education 6 20,7
3rd cycle of Basic Education 7 24,1
Upper Secondary Education 10 34,5
Tertiary Education 6 20,7
Father’s Education
1st and 2nd cycle of Basic Education 5 17,2
3rd cycle of Basic Education 15 51,7
Upper Secondary Education 5 17,2
11
Table I. Demographic characteristics of the sample.
From these 29 children, 82,9% are male resulting in a very high male-to-female ratio of 5:1. More than a half were attending nursery at the time of the admission and had special educational needs support.
The majority of the families, 65,5%, are of the nuclear type, followed by the extended family type with 24,1%. The other types including single parent were a lot less expressive constituting roughly 11% of the sample. Most families have a household with one, 37,9%, or two children, 48,3%.
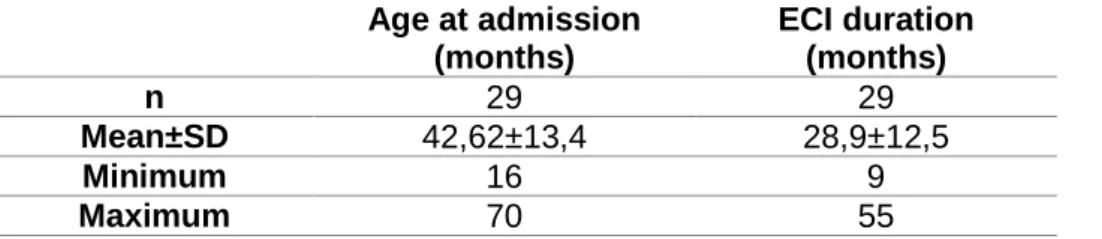
The parents’ age and education achievement were also registered and showed that the majority of the mothers gave birth between the age of 25 and 39 years old while the parents were a bit older, 62% between 30 and 40 years old. Upper Secondary Education counts for 34,5% of the mothers while 3rd cycle of Basic Education counts for the majority of the fathers with a redundant 51,7%. Also Tertiary Education is higher on the mother’s side. Age at admission (months) ECI duration (months) n 29 29 Mean±SD 42,62±13,4 28,9±12,5 Minimum 16 9 Maximum 70 55
Table II. Child’s age at admission in months and duration of the ECI therapy in months.
The mean age of admission for ECI at APPDA-Norte was about 3,5 years old (SD±1year) and 34,5% was 3 years old (36 months) or less. They leave ECI at six years and the Final Evaluation is made in that period.
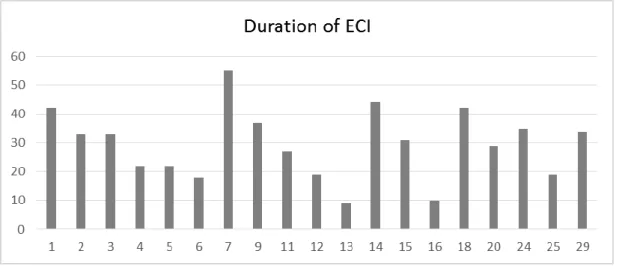
The duration of ECI for this sample was in average 2,4 years. Figure 2. Number of children by sex
12
Developmental Profile
The children developmental profile is composed of the Griffiths Mental Development Scale.
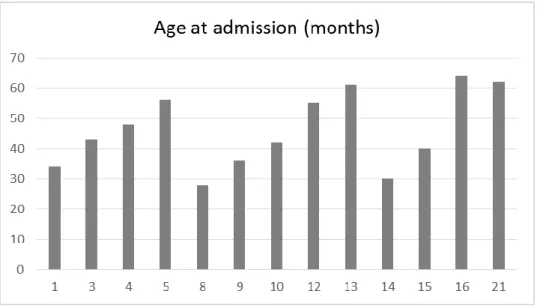
The following figures 3 and 4 represent the age of admission and the duration of the Early Childhood Intervention for each of the 19 children with the complete Griffiths evaluation. Each child was depicted individually so to be better characterized.
The numbers below the bars were attributed to each of the 29 total children of the total sample studied. The missing numbers are due to lack of data related to the complete Griffiths evaluation.
Figure 3. Age at Admission (in months) for ECI relatively to the 19 children with Griffiths evaluation.
13 0 20 40 60 80 100 120 1 2 3 4 5 6 7 9 11 12 13 14 15 16 18 20 24 25 29
Griffiths A Initial Griffiths A Final
Griffiths Mental Development Scales
The following table (Table III) represents the Initial and Final evaluations of 19 children according to the different subscales of Griffiths expressed by the score and each child with a specific number attributed.
Griffiths Mental Development Scales
G ri ff it h s Su bs ca le A – Lo co mot or G ri ff it h s Su bs ca le B – P erso na l-S oc ial G ri ff it h s Su bs ca le C – H ea ri ng an d Language 0 20 40 60 80 100 120 1 2 3 4 5 6 7 9 11 12 13 14 15 16 18 20 24 25 29
Griffiths B Initial Griffiths B Final
0 20 40 60 80 100 120 140 1 2 3 4 5 6 7 9 11 12 13 14 15 16 18 20 24 25 29
14 G ri ff it h s Su bs ca le D – H an d Ey e C oo rdi na ti on G ri ff it h s Su bs ca le E – P erf orman ce G ri ff it h s Su bs ca le F – P racti ca l R ea so ning 0 20 40 60 80 100 120 140 1 2 3 4 5 6 7 9 11 12 13 14 15 16 18 20 24 25 29
Griffiths E Initial Griffiths E Final
0 20 40 60 80 100 120 140 1 2 3 4 5 6 7 9 11 12 13 14 15 16 18 20 24 25 29
Griffiths F Initial Griffiths F Final 0 20 40 60 80 100 120 1 2 3 4 5 6 7 9 11 12 13 14 15 16 18 20 24 25 29
15
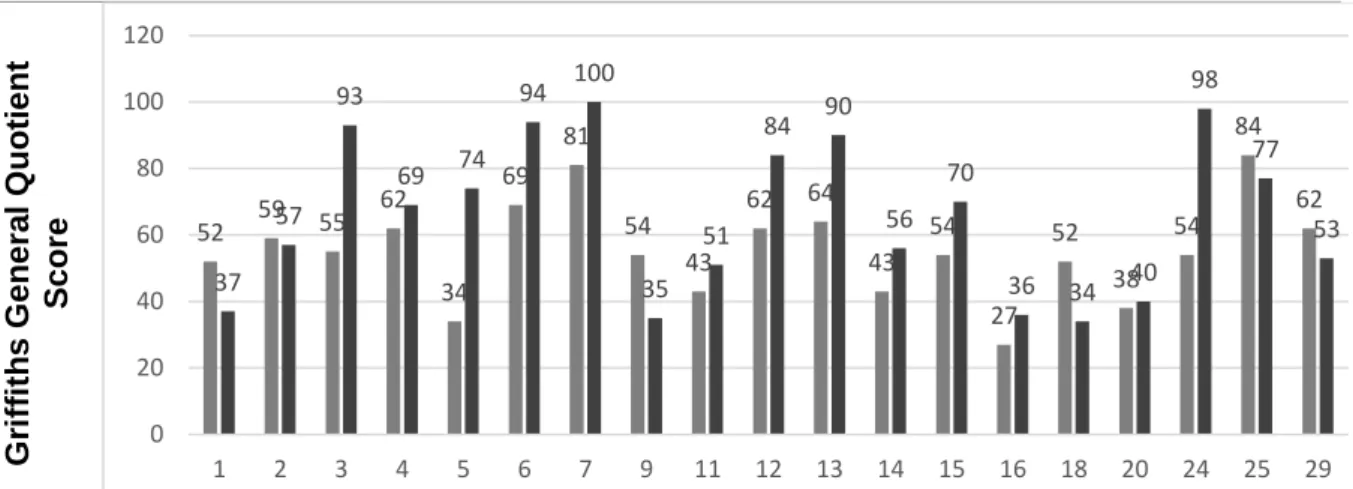
Table III. Graphics representing Griffiths Mental Development Scale at Initial and Final evaluation for each subquotient (A, B, C, D, E, F) and for the total score (or GQ). (n=19)
Analysing the median value for Griffiths GQ Initial Evaluation versus Griffiths GQ Final Evaluation the final evaluation presents a higher median value for boys and for girls, around 27% higher for the boys (n=19).
A new variable was created, called Griffiths Evolution (Griffiths GQ final minus Griffiths GQ initial), to scrutinize more profoundly the children who improved their quotients and the ones who did not. This variable is be used to test correlations with the duration of therapy and the children age of admission, page 23.
Having seen that the evolution is frankly positive in both sexes with an overall median of 9 points of difference between initial and final Griffiths GQ scores, the following hypothesis are tested:
Ho = Griffiths GQ final = Griffiths GQ initial H1 = Griffiths GQ final ≠ Griffiths GQ initial
G ri ff it h s G en era l Q uo ti en t S co re 52 59 55 62 34 69 81 54 43 62 64 43 54 27 52 38 54 84 62 37 57 93 69 74 94 100 35 51 84 90 56 70 36 34 40 98 77 53 0 20 40 60 80 100 120 1 2 3 4 5 6 7 9 11 12 13 14 15 16 18 20 24 25 29
Figure 5. Griffiths General GQ median scores by sex. (n=19)
Figure 6. Evolution of the Griffiths GQ from Initial Evaluation to Final Evaluation
16
Null hypothesis is rejected at 5%. It means that the difference between Griffiths General Quotient at Final Evaluation and Griffiths General Quotient at Initial Evaluation is statistically significant, n(19) p=0,040.
Looking further in the data, the next step is to try and find statistically significant differences between the Initial Evaluation and the Final Evaluation for each Griffiths Subscale (A to F).
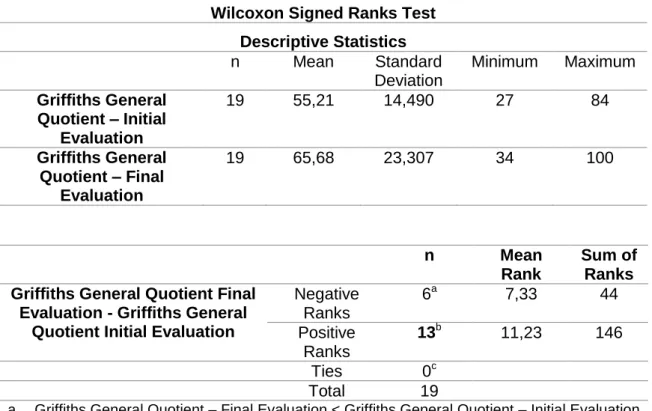
Wilcoxon Signed Ranks Test Descriptive Statistics n Mean Standard Deviation Minimum Maximum Griffiths General Quotient – Initial Evaluation 19 55,21 14,490 27 84 Griffiths General Quotient – Final Evaluation 19 65,68 23,307 34 100 n Mean Rank Sum of Ranks Griffiths General Quotient Final
Evaluation - Griffiths General Quotient Initial Evaluation
Negative Ranks 6a 7,33 44 Positive Ranks 13b 11,23 146 Ties 0c Total 19
a. Griffiths General Quotient – Final Evaluation < Griffiths General Quotient – Initial Evaluation
b. Griffiths General Quotient – Final Evaluation > Griffiths General Quotient – Initial Evaluation
c. Griffiths General Quotient – Final Evaluation = Griffiths General Quotient – Initial Evaluation
Statistics Test
Griffiths General Quotient Final Evaluation - Griffiths General Quotient Initial Evaluation
Z -2,053
Asymp. Sig. (2-tailed) 0,040
17
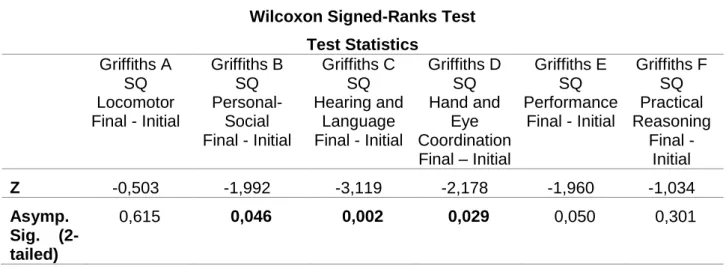
The Wilcoxon Signed-ranks test (Table V) indicates at least 3 Griffiths Subscales (B, C, D) with statistically significant differences from the Initial to the Final Evaluation.
Griffiths B SQ Personal-Social increased 27%, Z=-1,992, p=0,046, 2-tailed.
Griffiths C SQ Hearing and Language increased 64%, Z=-3,119, p=0,002, 2-tailed. Griffiths D SQ Hand and Eye Coordination increased 28%, Z=-2,178, p=0,029,
2-tailed.
The other 3 Griffiths Subscales (A, E, F) also showed better scores but not statistically significant.
Wilcoxon Signed-Ranks Test Test Statistics Griffiths A SQ Locomotor Final - Initial Griffiths B SQ Personal-Social Final - Initial Griffiths C SQ Hearing and Language Final - Initial Griffiths D SQ Hand and Eye Coordination Final – Initial Griffiths E SQ Performance Final - Initial Griffiths F SQ Practical Reasoning Final - Initial Z -0,503 -1,992 -3,119 -2,178 -1,960 -1,034 Asymp. Sig. (2-tailed) 0,615 0,046 0,002 0,029 0,050 0,301
Figure 7. Griffiths Subscales Medians at Initial and Final Evaluation.
18
Autism Diagnostic Observation Schedule
The following figures 8 and 9 represent age at admission and duration of the Early Childhood Intervention for the 13 children with the complete ADOS severity score evaluation, portraying the detailed circumstances for each children so to better characterize each one.
The numbers shown below the bars were attributed individually for each of the 29 total children of the total sample studied.
Figure 8. Age at admission relatively to the 19 children with ADOS-G evaluation.
19
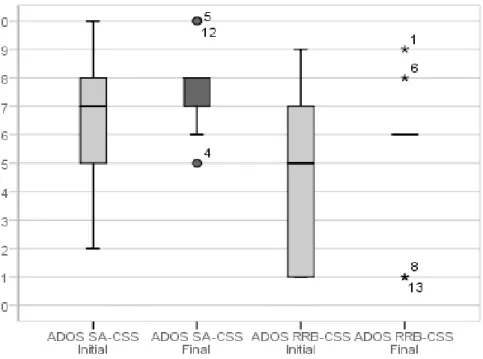
The following table (Table VI) represents the evaluations according to the different divisions of ADOS-G expressed by the calibrated severity score and each child with a specific number attributed. The Initial Evaluation is the left bar and the Final Evaluation is the right bar.
ADOS Calibrated Severity Scores
Initial Evaluation | Final Evaluation
A D O S S oc ia l A ff ec t C ali bra ted S ev er it y S c ore A D O S R es tr icted an d R ep eti ti ve B eh av io u rs C ali bra ted S ev er it y S c ore 0 1 2 3 4 5 6 7 8 9 10 1 3 4 5 8 9 10 12 13 14 15 16 21
ADOS SA-CSS Initial ADOS SA-CSS Final
0 1 2 3 4 5 6 7 8 9 10 1 3 4 5 8 9 10 12 13 14 15 16 21
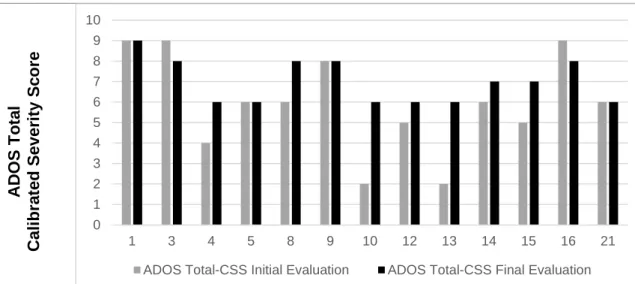
20 Figure 10. Distribution of ADOS Total
Calibrated Severity Score at Initial and Final Evaluation by sex. (n=13)
A D O S To ta l C ali bra ted S ev er it y S c ore
Table VI. Graphics representing ADOS Calibrated Severity Scores at Initial and Final Evaluation for each domain scores and for the total score. (n=13)
Analysing the median value for ADOS Total Initial Evaluation versus ADOS Total Final Evaluation the final evaluation has the same median for girls but has a higher score for boys (n=13). Nevertheless there’s only 1 girl with both ADOS Total Initial and Final evaluation and 12 boys.
A new variable, called ADOS Evolution (ADOS Total Final minus ADOS Total Initial) was created to scrutinize more profoundly the children who increased their quotients and the ones who didn’t or stayed the same.
0 1 2 3 4 5 6 7 8 9 10 1 3 4 5 8 9 10 12 13 14 15 16 21
21
For a n=13, ADOS Evolution is positive which means the severity worsened.
Thus, the following hypothesis are tested: H0 = ADOS T-CSS Final = ADOS T-CSS Initial H1 = ADOS T-CSS Final ≠ ADOS T-CSS Initial
Null hypothesis is rejected at 5%. It means that the difference between ADOS Total-CSS at Final Evaluation and ADOS Total-CSS at Initial Evaluation is statistically significant, n(13), p=0,036. There was a patent worsening with increasing ASD’s severity on the Final Evaluation.
Wilcoxon Signed-Ranks Test Descriptive Statistics
n Mean Standard
Deviation Minimum Maximum
ADOS Total-CSS Initial 13 5,92 2,397 2 9
ADOS Total-CSS Final 13 7,00 1,080 6 9
n Mean
Rank
Sum of Ranks ADOS Total-CSS Final - ADOS
Total-CSS Initial Negative Ranks 2 a 2,50 5 Positive Ranks 7 b 5,71 40 Ties 4c Total 13
a. ADOS Total-CSS - Final evaluation < ADOS Total-CSS - Initial evaluation b. ADOS Total-CSS - Final evaluation > ADOS Total-CSS - Initial evaluation c. ADOS Total-CSS - Final evaluation = ADOS Total-CSS - Initial evaluation
ADOS Total-CSS Final - ADOS Total-CSS Initial
Z -2,101
Asymp. Sig. (2-tailed) 0,036
Figure 11. ADOS Total Calibrated Severity Score Evolution (Final minus Initial) variable by frequency.
22
The ADOS domains were analysed to understand the ASD’s severity direction.
Both increased in severity, figure 10, but without statistical significance, p>0,05, 2-tailed, as described at Table VIII.
ADOS SA-CSS Final - Initial ADOS RRB-CSS Final - Initial Z -1,450 -0,997
Asymp. Sig. (2-tailed) 0,147 0,319
Figure 10. Distribution of ADOS-CSS domains (ADOS SA-CSS and ADOS RRB-CSS) at Initial and Final Evaluation. (n=13)
Table VIII. Wilcoxon-Signed Rank Test for ADOS CSS domains - Final minus Initial Evaluation. (n=13)
23
Expressive Language and ADOS Modules
Despite of the increased severity of Autism different ADOS Modules were used from the Initial to the Final Evaluation (Module 1 No Words, Module 1 Some Words and Module 2 Phrases). The following figure 11 shows the different Modules used in each evaluation.
Exploring other variables and their possible relation with the ADOS-G (Severity Evolution) and Griffiths Evolution (Developmental Profile Evolution):
Griffiths Evolution and the duration of the therapy (ECI)
The Griffiths difference score (final minus initial) did not correlate with the number of months of therapy, n=19, rs=-0,324; p=0,176, 2-tailed.
Griffiths Evolution and the children Age at admission
The Griffiths difference score (final minus initial) did not correlate with the age at admission in months, n=19, rs=-0,452; p=0,052, 2-tailed.
ADOS Total-CSS Evolution and the duration of the therapy (ECI)
The ADOS difference score (final minus initial) did not correlate with the number of months of therapy, n=13, rs=-0,061; p=0,844, 2-tailed.
0 1 2 3 4 5 6 7 8 9 10 11 Phrases Some words No words Num b e r o f Chi ld re n Expressive Language Final Evaluation 0 1 2 3 4 5 6 7 8 Phrases Some words No words Nu m b e r o f c h ild re n Expressive Language Initial Evaluation
Figure 11. Expressive Language level at initial and final evaluation according to the chosen ADOS Modules to apply. (n=13)
24
Discussion
The demographic characterization of the sample shows a clear male-to-female ratio of 5:1, in total accordance with the main worldwide studies, pushing the male gender to the unchangeable risk factors lists and some referring a “female protective model” due to genetic characteristics (27). Besides the male-to-female ratio, ASD children who attend ECI at APPDA-Norte seem to have relatively normal demographic characteristics for the Portuguese population which are well described on the Results (Table I).
Developmental Profile
At first glance, at both Initial and Final Evaluation girls (n=5) have lower scores than boys (n=24) and also have lower improvement percentage (Figure 5), suggesting more disability as preconized in other studies(27).
Even so, both genders explicitly improved when evaluated at discharge with a statistical significance not very high, p=0,04 (Table IV), but enough to think of a probable cause effect through ECI.
The Subscales described at page 17 uncover the major improvement areas: Personal-Social - B (27% improvement), Hearing Language - C (64% improvement) and Hand-Eye Coordination – D (28% improvement). These ones with statistical significance backing up the findings.
On the other areas or subscales, the Final Evaluation is also better with Performance (E) presenting a borderline p value (p=0,05), Practical Reasoning coming next and Locomotor appearing as the area with less development. In fact, children achieved only 9% better scores within the Locomotor evaluation. Practical Reasoning couldn’t be evaluated for all children since it is only used to test the older ones.
When each case is analysed (Table III), some developments are marked by big regressions like the children: 1, 9, 18 who all had reasonable and identical time of intervention, 37 to 42 months, and began ECI at similar ages, between 34 and 36 months. Other are marked by big improvements like the children: 3, 5, 6, 13, 24. Of those, number 3 and 24 had more than 30 months intervention and similar ages at admission, 43 and 38 months respectively, enabling a possible contribution from ECI on their improvements. On the other hand, children 5, 6 and 13, had less than 22 months ECI duration (13 had only 9 months) and were older than the median with 56, 50 and 61 months respectively and still had big improvements. This could be attributed to development leaps between 4 and 5 years of age although a few months of individually designed intervention at the proper time could possibly make a difference(28).
25 Autism Spectrum Disorder Severity
Besides being a diagnostic tool, the ADOS can be used to assess the Autism severity, the communication and interaction (social affect) and the restricted and repetitive behaviours, and also indirectly the expressive language abilities, providing the researcher with the opportunity to try and find traits of development in autism, relationships between diverse characteristics and phenotypic subgrouping in genetic and neurobiological research.
ADOS-Total-CSS and possible Trajectories
According to the thresholds of ADOS Total-CSS (Table VI, page 20), from the children (n=13) that were able to be evaluated with the ADOS, 8 were initially diagnosed with Autism, 3 with ASD and 2 with Non-Spectrum. At the last evaluation all had their total severity score reaching the 6-10 threshold of Autism classification (46% at 6-point ADOS Total-CSS though), a patent worsening confirmed by the statistically significant difference between the Total-CSS initially and after ECI (n=13, p=0,036, 2-tailed). Thus, closely observing the ADOS Total-CSS it is possible to fit the results in trajectories, in similar fashion of recent and relevant studies that use ADOS as groundwork for the identification of traits or aggregated trajectories of development or severity alongside other known scores like Griffiths (29)(30)(31). As such, 2 children have actually improved their score (15%), 4 maintained the same (2 remained persistently high and the other 2 persistently moderate; 31%) and 7 worsened (54%).
These ADOS Total-CSS results support the early ASD suspicion confirming the diagnosis for all 13 children.
ADOS RRB-CSS
Even though there were no statistically significant differences between the ADOS RRB-CSS initial and final, these symptoms varied and were associated to the Autism diagnosis as expected (Table VI, page 19). In the Initial Evaluation, all 8 children with Autism classification had a score in this domain and none of the 2 Non-Spectrum children did. As for the 3 ASD children, 2 didn’t score and 1 had mildly severe quotation (7 points of severity). In the Final Evaluation, all the children that changed to the Autism diagnosis show symptoms in this domain except for number 12 that quoted 6 point in the ADOS Total-CSS with null RRB symptoms (remembering that 1 point in the ADOS RBB-CSS means zero restricted and repetitive behaviours). Thus, the presence of repetitive behaviours is likely to be more meaningful than the absence of such(25).
26 Expressive Language
In the Initial Evaluation, Module 1 was applied to 11 children, 4 of whom received the “No Words” and the other 7 “Some Words” (Figure 11, page 23). The other 2 children could be evaluated with the Module 2 Phrases. So, the suitability of Module 2 in the Final Evaluation means that the majority of children developed speech language which is an important achievement towards development and autonomy.
ADOS and Griffiths Conclusions
Interpreting results of both scores combined will not lead to reliable conclusions due to the study limitations described below. Still, the significant Griffiths improvements at Hand and Eye Coordination, Personal-Social and mostly at the Hearing and Language Subscale are similar in direction to the speech language gains deducted by the ADOS Modules for the same children yet this can also be related to the path of human development.
One must bear in mind that although there were prominent improvements at these Griffiths Subscales, the children remained below the average mental age for development and thus the increased ASD severity. In reality, the ones that showed marked development among the sample could actually be the ones that improved (decreased) or maintained their ASD severity.
Other possible associations
Since the data was available, some correlations were executed in order to perceive a hidden relation of some kind. The variables chosen to explore relations were the duration of therapy and the age at admission between ADOS and/or Griffiths Evolution and no relation surfaced. Other possibilities were analysed but the small sample made it impractical.
Study Limitations Design and Sample
The primary disadvantage of historical cohorts design (or retrospective) is the limited control the investigator has over data collection. The children do not present the same age or the same ECI duration due to a wide variety of factors of difficult control. The existing data may be incomplete, inaccurate, or inconsistently measured among subjects.
Usually a historical cohort study design includes a control group or non-exposed group from the same source population(32). In this study in particular, having a non-exposed group to ECI would be unethical.
27
One of the main validity problem was the sample size. No power calculation was done to achieve the ideal sample size because we only had that data so this research is underpowered.
Furthermore, a major bias when comparing ADOS and Griffiths is that the sample isn’t exactly the same for each one throughout the study. If it were to use only the children with full complete examination at Initial and Final evaluation, 4 completed tests: ADOS Initial, Griffiths Initial, ADOS Final and Griffiths Final; the sample would be of only 10 children.
Execution of the Developmental Tests and Score Interpretation
The application of the Griffiths scales and ADOS-G is clearly related to the skill of the examiner(22). It requires practice in administering the activities, scoring, and observation and that is why it is executed by trainee professionals but who are intrinsically different from each other and can add their own bias.
A major bias when comparing ADOS and Griffiths is that the sample isn’t always the same throughout the study. If it were to use only the children with full complete examination at Initial and Final evaluation, 4 completed tests: ADOS Initial, Griffiths Initial, ADOS Final and Griffiths Final; the sample would be just of 10 children.
Suggestions
Besides increasing the sample size, collecting data concerning active parents’ involvement during the therapy and compare their children outcome with children whose parents aren’t so active and also introduce other developmental evaluation exams, would be very useful in the future.
Scientific and Clinical Importance
This study or similar are important to help characterize children Autism Developmental Profiles and their family environment, empowering the health professionals so that some situations can be predicted, modified or adjusted for each child or group.
It has the potential to have great statistical power and to become a tool to unveil predictors, risk factors and occult trends related to ECI and its execution.
28
Acknowledgment
Ao grupo de profissionais da APPDA-Norte pela valiosa ajuda no processo de colheita de dados e à minha tutora pela oportunidade de poder realizar um trabalho com um significado importante para a comunidade mas também para ciência.
À comissão de Ética do ICBAS pela disponibilidade.
Aos muito amigos que vão dando os seus conselhos e ajudando.
Um muito obrigada semper grata mas não exclusivo para os sempre pais,
29
Bibliography 1. American Psychiatric Association. Diagnostic and statistical manual of mental
disorders (5th ed.). 5th Ed. Washington, DC; 2013.
2. Baird G, Simonoff E, Pickles A, Chandler S, Loucas T, Meldrum D, et al. Prevalence of disorders of the autism spectrum in a population cohort of children in South Thames: the Special Needs and Autism Project (SNAP). Lancet. Elsevier; 2006 Jul;368(9531):210–5.
3. Kogan MD, Blumberg SJ, Schieve LA, Boyle CA, Perrin JM, Ghandour RM, et al. Prevalence of parent-reported diagnosis of autism spectrum disorder among children in the US, 2007. Pediatrics. 2009 Nov;124(5):1395–403.
4. Chien I-C, Lin C-H, Chou Y-J, Chou P. Prevalence and incidence of autism spectrum disorders among national health insurance enrollees in Taiwan from 1996 to 2005. J Child Neurol. 2011 Jul;26(7):830–4.
5. Prevalence of autism spectrum disorders--Autism and Developmental Disabilities Monitoring Network, 14 sites, United States, 2008. MMWR Surveill Summ. 2012 Mar;61(3):1–19.
6. Baxter AJ, Brugha TS, Erskine HE, Scheurer RW, Vos T, Scott JG. The epidemiology and global burden of autism spectrum disorders. Psychol Med. Cambridge University Press; 2014 Aug;45(03):1–13.
7. Prevalence of autism spectrum disorder among children aged 8 years - autism and developmental disabilities monitoring network, 11 sites, United States, 2010. MMWR Surveill Summ. 2014 Mar;63(2):1–21.
8. Oliveira G, Ataíde A, Marques C, Miguel TS, Coutinho AM, Mota-Vieira L, et al. Epidemiology of autism spectrum disorder in Portugal: prevalence, clinical characterization, and medical conditions. Dev Med Child Neurol. 2007 Oct;49(10):726–33.
9. Manning SE, Davin CA, Barfield WD, Kotelchuck M, Clements K, Diop H, et al. Early diagnoses of autism spectrum disorders in Massachusetts birth cohorts, 2001-2005. Pediatrics. 2011 Jun;127(6):1043–51.
10. Surén P, Bakken IJ, Aase H, Chin R, Gunnes N, Lie KK, et al. Autism spectrum disorder, ADHD, epilepsy, and cerebral palsy in Norwegian children. Pediatrics. 2012 Jul;130(1):e152–8.
11. Sandin S, Schendel D, Magnusson P, Hultman C, Surén P, Susser E, et al. Autism risk associated with parental age and with increasing difference in age between the parents. Mol Psychiatry. 2015;
12. Durkin MS, Maenner MJ, Newschaffer CJ, Lee L-C, Cunniff CM, Daniels JL, et al. Advanced parental age and the risk of autism spectrum disorder. Am J Epidemiol. 2008 Dec;168(11):1268–76.
13. Buizer-Voskamp JE, Laan W, Staal WG, Hennekam EAM, Aukes MF, Termorshuizen F, et al. Paternal age and psychiatric disorders: findings from a Dutch population registry. Schizophr Res. 2011 Jul;129(2-3):128–32.
14. Walker CK, Krakowiak P, Baker A, Hansen RL, Ozonoff S, Hertz-Picciotto I. Preeclampsia, placental insufficiency, and autism spectrum disorder or developmental delay. JAMA Pediatr. American Medical Association; 2015 Feb;169(2):154–62.
15. Schieve LA, Tian LH, Baio J, Rankin K, Rosenberg D, Wiggins L, et al. Population attributable fractions for three perinatal risk factors for autism spectrum disorders, 2002 and 2008 autism and developmental disabilities monitoring network. Ann
30 Epidemiol. Elsevier; 2014 Apr;24(4):260–6.
16. Tordjman S, Somogyi E, Coulon N, Kermarrec S, Cohen D, Bronsard G, et al. Gene × Environment interactions in autism spectrum disorders: role of epigenetic mechanisms. Front psychiatry. 2014 Jan;5:53.
17. Soriano V. Early Childhood Intervention: Analysis of Situations in Europe. Report to European Agency for Development in Special Needs Education. 2005.
18. Corsello CM. Early Intervention in Autism. Infants Young Child. 2005;18(2):74–85. 19. Greenspan SI, Brazelton TB, Cordero J, Solomon R, Bauman ML, Robinson R, et
al. Guidelines for early identification, screening, and clinical management of children with autism spectrum disorders. Pediatrics. 2008 Apr;121(4):828–30. 20. Bedford H, Walton S, Ahn J. Measures of Child Development : A review. Cent
Paediatr Epidemiol Biostat Univ Coll London - Inst Child Heal. 2013 Jun.
21. D. Luiz, A. Barnard, N. Knosen, N. Kotras, S. Horrocks, P. McAlinden, D. Challis & R. O’Connell. Analysis manual: D. Luiz, B. Faragher, A. Barnard, N. Knosen, N. Kotras LEB& DC. GMDS-ER: Griffiths Mental Development Scales-Extended Revised: 2 to 8 years. Administration and analysis manual. 2006.
22. Lord C, Risi S, Lambrecht L, Jr. EHC, Leventhal BL, DiLavore PC, et al. The Autism Diagnostic Observation Schedule—Generic: A Standard Measure of Social and Communication Deficits Associated with the Spectrum of Autism. J Autism Dev Disord.2000 Kluwer Academic Publishers-Plenum Publishers; 30(3):205–23. 23. Luyster R, Gotham K, Guthrie W, Coffing M, Petrak R, Pierce K, et al. The Autism
Diagnostic Observation Schedule-toddler module: a new module of a standardized diagnostic measure for autism spectrum disorders. J Autism Dev Disord. 2009 Sep;39(9):1305–20.
24. Lord C, Rutter M, DiLavore PC, Risi S. Autism Diagnostic Observation Schedule - Generic. Los Angeles: Western Psychological Services; 2002.
25. Hus V, Gotham K, Lord C. Standardizing ADOS domain scores: separating severity of social affect and restricted and repetitive behaviors. J Autism Dev Disord. 2014 Oct;44(10):2400–12.
26. Gotham K, Pickles A, Lord C. Standardizing ADOS scores for a measure of severity in autism spectrum disorders. J Autism Dev Disord. 2009 May;39(5):693–705. 27. Jacquemont S, Coe BP, Hersch M, Duyzend MH, Krumm N, Bergmann S, et al. A
Higher Mutational Burden in Females Supports a “Female Protective Model” in Neurodevelopmental Disorders. Am J Hum Genet. 2014 Mar;94(3):415–25.
28. Woods JJ, Wetherby AM. Early Identification of and Intervention for Infants and Toddlers Who Are at Risk for Autism Spectrum Disorder. Lang Speech Hear Serv Sch. American Speech-Language-Hearing Association; 2003 Jul;34(3):180–93. 29. Gotham K, Pickles A, Lord C. Trajectories of autism severity in children using
standardized ADOS scores. Pediatrics [Internet]. American Academy of Pediatrics; 2012 Nov ;130(5):e1278–84.
30. Lord C, Luyster R, Guthrie W, Pickles A. Patterns of developmental trajectories in toddlers with autism spectrum disorder. J Consult Clin Psychol. 2012 Jun [cited 2016 Jun 13];80(3):477–89.
31. Fountain C, Winter AS, Bearman PS. Six developmental trajectories characterize children with autism. Pediatrics. American Academy of Pediatrics; 2012 May;129(5):e1112–20.
32. Song JW, Chung KC. Observational studies: cohort and case-control studies. Plast Reconstr Surg. 2010 Dec;126(6):2234–42.
31
Appendices
32