C.A. Andrade et al., Rev. Bras. Crimin. 4(2), 7-18, 2015
DOI:
http://dx.doi.org/10.15260/rbc.v4i2.87
Speed determination at the accident scene: needle slap effect
C.A. Andrade
*, J.L.S. Farias, J.A. Gomes
Instituto de Criminalística, Polícia Civil do Distrito Federal, Brasília (DF), Brasil *Endereço de e-mail para correspondência: [email protected]. Tel.: +55-61-9979-9069.
Recebido em 29/03/2015; Revisado em 28/06/2015; Aceito em 02/07/2015
Resumo
Nas reconstruções de acidentes de trânsito é muito importante determinar a velocidade do veículo no momento da colisão. Como se segue, pode-se utilizar as Leis da Física ou métodos alternativos. Nesta perspectiva, uma técnica interessante para estabelecer essa velocidade é o efeito needle slap, em que uma marca é feita na face do mostrador do velocímetro pela agulha no momento do impacto. Neste artigo, mostra-se como identificar esse efeito usando as seguintes técnicas de laboratório: Espectroscopia Raman, para provar a transferência de material entre a face do painel e a agulha; Comparador Vídeo Espectral, para encontrar marcas luminescentes e de fricção da agulha no painel do velocímetro; Microscópio Óptico, para investigar alterações das características morfológicas no mostrador do velocímetro. Para isso, painéis de carros e motos que haviam se envolvido em colisões frontais foram analisados. Entretanto, como em alguns casos é inviável remover o painel de instrumentos para a análise em laboratório, será mostrado como usar um conjunto de luzes (lanternas), combinadas com vários filtros (óculos) para detectar esse fenômeno na cena do acidente.
Palavras-Chave: Efeito needle slap; Reconstrução de acidentes; Determinação de velocidade; Colisão frontal. Abstract
In the traffic crash reconstructions, it is very important to determine the vehicle speed at the instant of the collision. As follows, it can be used the Physics Laws or alternative methods. In this perspective, an interesting technique to establish this speed is the needle slap effect, in which an imprint is made at the impact time by the needle of the speedometer on the gauge face. In this paper, it will be shown how to identify this effect using these laboratory techniques: Raman Spectroscopy, to prove the material transfer between gauge face and needle; Video Spectral Comparator, to find the luminescence and friction marks of the needle at the gauge plate; and Optical Microscope, to investigate the alteration of morphological characteristic on the gauge surface. For this purpose, cars and motorcycles dashboards that had been involved in frontal traffic accidents have been analyzed. However, in some cases it is impracticable to remove the instrument panel to analyze it in the laboratory, for this, it will be shown how to use a set of lights (flashlights) combined with several filters (goggles) to detect this phenomenon at the accident scene.
Keywords: Needle slap effect; Accident reconstruction; Speed determination; Frontal collision.
1. INTRODUCTION
Traffic accidents have particular relevance among the negative externalities produced by traffic, not only because of the economic costs, but also especially due to the pain, the suffering and the loss of quality of life attributed to the victims, their families and the society [1]. According to the World Health Organization [2], about 1.2 million people die in traffic accident per year in the world and it is considered one of the top 10 leading causes of death. In addition, more than 20 million people are injured, causing an annual loss of about US$ 518
billion. However, 90% of these occurrences are recorded in emergent countries such as Brazil, where this fatality is considered one of the top 5 leading causes of death, with about 40,000 deaths annually [3]. At the same time, more than 300,000 are injured as a result of traffic accidents, which require approximately 40% of Brazilian ICU beds in emergency rooms.
In Brazil, when a traffic accident with victim happens, the Crime Scene Investigator – CSI – is called to reconstruct the event [4, 5, 6]. Differently from homicide or theft cases, in traffic accidents, generally the authorship is known. Thus, by means of evidence study, the CSI can v. 4, n. 2, p. 7-18, 2015
identify the vehicles trajectories, calculate their speeds before the collision, determine the point of collision, establish the accident dynamics and, consequently, present the root cause of the event. In other words, it is like assembling a jigsaw puzzle to see what the picture looks like [7].
In the tasks previously mentioned, one that can be considered primordial is the speed determination of the involved vehicles [8], because this parameter could represent distinct roles in accidents: a simple traffic violation code (not criminal), an aggravating factor of the consequences, and even the real cause of the collision [9]. There are many methodologies in the literature dedicated to speed calculation [10]: the use of the principles of conservation of energy and momentum, alternative methodologies as projection of fragments and computer simulation [11, 12], or empirical formulas [13, 14].
Among these alternative methodologies to determine the vehicle speed, two widely used and described in the literature are the Event Data Recorder (EDR) [15, 16] and the energy loss in vehicle collisions [17-20]. However, in emergent countries, the use of these methodologies are limited, since there are no public policies that regulate the criteria for EDR use and there are no official offices responsible for conducting crash tests in order to determine the stiffness coefficients. There are private and autonomous offices that realize crash tests like the NCAP-Latin America and the CESVI-Brazil, however, with the purpose to evaluate the passenger compartment. These tests do not provide information about the stiffness coefficients. Furthermore, the results show that Latin America vehicles have projects equivalent to those of U.S. and Europe vehicles produced in the 90 s [21].
Alternatively, a little-known methodology in Brazil is the needle slap effect, in which an imprint made by the needle of the speedometer on the gauge face at time of impact [22, 23]. This effect can be a very useful approach in countries with an old car fleet, and most of the cars has an analogical speedometer.
The trace evidence examiner can inspect the speedometer to determine if a needle slap mark exists and this can be used to determine the vehicle speed at the moment of the impact [24]. This technique is not new and it is used even in the air crash accident investigation. In 1973, the Federal Aviation Administration [25] of Oklahoma published “a summary of crashworthiness information for small airplanes”. In this report, the authors statement that without deceleration recording equipment on the airplane, it is necessary to rely on evidence at the accident scene, where sometimes a needle slap mark on the speed indicator provides the velocity of the collision.
Despite being an old methodology, infrequently the phenomenon is discussed in the World Wide Web. In literature, few papers or reports discuss about needle slap
effect. For example, in the Report of the US Superior Court [26], when the officer of Maine State Police had analyzed the speedometer in laboratory, the officer has concluded that there was no evidence of transfer from needle to the back of the speedometer, that could suggesting needle slap effect. Another example, the Accident Reconstruction Unit Laboratory of Police Department of Virginia [27] has conducted the variable-frequency ultraviolet examination to test for tachometer and speedometer needle slap (a transfer of phosphorus from the needle to the dial at the impact time). The laboratory analysis has shown a pre-crash tachometer needle position of 2,800 rpm. The examination of the speedometer has shown an initial needle slap mark interpolated between 83 and 85 mph.
Recently, Tao et al. [23] have studied minutely this phenomenon. This paper has been based on the laboratory impact system and mechanical analysis. Two potential locations of the needle marks, the tip and the middle, have been revealed, as well as the lower limit of speed detection, nearly 30 km/h. Besides, the morphological characteristics have been collected under multiband light waves on real crashes marks and the precision and limitations have been discussed, showing that needle slap effect is a simple and valid method to determinate vehicle speed.
In order to complement the study of the article cited above [23], in this paper, it was proposed to explain how the needle slap effect can be identified by means of three laboratory techniques: Raman Spectroscopy, Video Spectral Comparator and Optical Microscope. To accomplish this, cars and motorcycles dashboards that had been involved in frontal collision have been collected and analyzed. Finally, in these same panels evaluated in laboratory, it has been used a set of forensic lights (flashlights) combined with several filters (goggles) to detect the needle slap effect. Based on these experiments, a way to investigate the phenomenon has been proposed, at the accident scene, when it is not possible to remove the instrument panel to be analyzed in the laboratory. The result obtained in one of these experiments was confronted with analysis obtained by GPS-based vehicle tracking system.
2. MATERIALS AND METHODS
Samples. Fifteen car instrument panels (most of them
equipped with speedometer, tachometer, temperature gauge and fuel gauge) and thirteen motorcycle instrument panels (most of them equipped with speedometer and tachometer) have been removed from vehicles involved in traffic accidents (frontal collision). The samples, gauge plates and needles, have been carefully detached from the instrument panels and have been analyzed using Raman
C.A. Andrade et al., Rev. Bras. Crimin. 4(2), 7-18, 2015 Spectroscopy, Video Spectral Comparator, Optical
Microscope and Forensic Lights.
Raman Spectroscopy. Raman spectra of the gauge
plates and needles were collected using a Renishaw inVia Raman microscope, with the Renishaw WIRE software, to check for material transfer from the needle to the gauge plate and vice-versa. The Raman scattering has been excited with 785 nm and 514 nm lasers. A 50x objective lens has been used, giving a laser spot diameter of 5μm. Spectra have been obtained for a 10s exposure of the CCD detector in the region 100-3200 cm-1 using the extended scanning mode of the instrument. One accumulation has been collected for each measurement with between 0.1-100% laser powers. The total acquisition time has been less than three minutes.
Video Spectral Comparator. The VSC 5000 made
by Foster and Freeman has been used to examine evidences of ultraviolet luminescence as well as friction marks in the gauge plates occasioned by needle contact. The set-up employed were: a magnification between 2x and 170x; short, medium and long wave UV to excite visible fluorescence; infrared light to excite anti-Stokes emissions; oblique and transmitted lighting; co-axial lighting for examining retro-reflective features; enhanced optical filter system coupled to the high intensity incident visible light source to provide controlled illumination.
Optical Microscope. An Olympus Optical Microscope, SZX12 model, attached with digital color camera (Samsung SDC-312) connected in a computer and coupled with two mobile arms (Olympus LG-PS2) to provide oblique lighting was used in order to identify possible friction marks left by the needle in the gauge plate. The microscope provides an effective zoom range of 3.5x to 144x, or a 41:1 ratio.
Forensic Lights. The light sources Megamaxx
developed by Sirchie have been used to look for friction marks or fluorescence of the phosphorescent material in the gauge plate produced by contact with the needle. For this purpose, all seven visible light sources (455 nm, 470 nm, 505 nm, 530 nm, 590 nm, 625 nm and white) and one ultraviolet light source (395 nm) have been combined with three goggles (red, yellow, and orange).
3. RESULTS AND DISCUSSION
Toresan Jr. [13] asserts that the needle slap effect can be used to determine the vehicles speeds at the time of the collision; however, the author declares that is responsibility of the laboratories to elucidate the best methods to reveal these marks. Therefore, several experiments have been conducted in the laboratory of the
Criminalistic Institute, Civil Police of the Federal District, Brazil, using the following techniques: Raman Spectroscopy, Video Spectral Comparator and Optical Microscope.
3.1. Raman Spectroscopy
Raman spectroscopy is a technique that has been shown very promising in forensic science [28, 29] due to several factors: (i) high capacity to identify chemical compounds, (ii) unnecessary sample preparation, performing measurements directly on the material or even materials packed in plastic bags or glass, (iii) quick exam, noninvasive and nondestructive, allowing direct identification and characterization of materials. Thus, this important characteristic of preservation of the evidence is in according to the Brazilian Criminal Law [30], in which the States are required to preserve the evidence samples, when possible, to perform further examination if required. This method uses a specific laser of low power, focused on a particular point of the sample through a microscope. The laser beam interacts with the chemical compounds present in the sample, so that the light is backscattered at different frequencies, according to chemical elements and their molecular links. Therefore, it is possible to distinguish the various materials used in the manufacture of instrument panels, in particular gauge plate and needle.
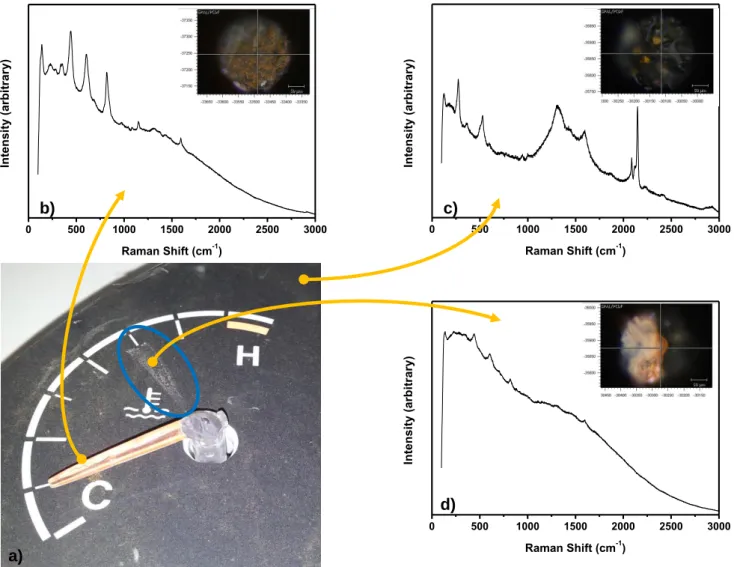
Raman measurements have been performed on the instrument panel of a Fiat/Uno Mille, which had been involved in a frontal collision with a GM/Kadett and which needle slap effect is quite visible in the region of the temperature gauge (see Figure 1a). Spectra have been collected from the gauge plate and needle using lasers with wavelengths of 514 nm and 785 nm. However, helium-neon laser (He-Ne), which wavelength is 785 nm, has presented better results. For the same material, it have been collected Raman spectra in several positions and the results show that the Raman spectra are identical, independently of the chosen region.
Figures 1b and 1c show Raman spectra, collected with the 785 nm laser excitation, to a particular region of the needle and the gauge plate, respectively, randomly selected, far-away from the area where the phenomenon is quite evident. Spectra are easily distinguishable, because of the difference in chemical compositions of the materials. The inserts of these figures show an image of magnified print of a selected area, where measurements have been performed, for each sample, using a 50x objective.
In possession of the spectra of the individual materials, gauge plate and needle, experimental measurements have been carried out in the area highlighted on blue in Figure 1a, in which it is possible to visually identify the needle slap effect. It has been used
the laser with wavelength of 785 nm and a 50x objective. The spectrum collected in this area can be seen in Figure 1d. In order to make possible the visual comparison, it has been prepared the Figure 2, which illustrates, in the range of 200-1000 cm-1, the Raman spectra of the needle (shown in Figure 1b) and the area of interest (shown in Figure 1d). In the Figure 2, it is easier to see that the
spectra have similar features, meaning that there has been material transfer from the needle to the gauge plate. Thus, it becomes apparent that upon impact, the needle of the thermometer was projected ahead; colliding with the gauge plate and, in this case, left traces adhered to the gauge plate.
Figure 1. a) Temperature gauge from a car instrument panel, blue oval form highlights the needle slap effect. b) Raman spectra results from the
needle (insert show image of magnified print of it). c) Raman spectra results from the gauge plate (insert show image of magnified print of it). d) Raman spectra results from the needle slap mark (insert show image of magnified print of it).
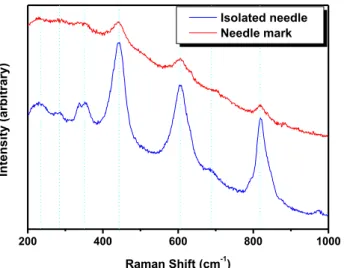
However, occurrences in which needle fragments are deposited on the gauge plate, as can easily be seen in the insert of Figure 1d - the orange color on black background - rarely happen due to the constituent material of both, needle and gauge plate. In addition, it is necessary a large amount of energy during the collision to facilitate this transfer. Thus, the most common is to detect material of the gauge plate at the back of the needle, as shown in Figure 3a. This figure shows an image of the magnified print of a needle of speedometer removed from a motorcycle instrument panel, which has collided frontwards with a fixed and undeformable obstacle, using a 50x objective, where it is possible to see small black points from the gauge plate.
With the purpose to prove that the black material is from the gauge plate, it has been collected Raman spectra in various areas of the gauge plate and the needle. Raman spectra collected at different points of the same support are identical. An example of each material spectrum is shown in Figure 3b (spectrum I for the gauge plate and spectrum II for the needle). Both spectra are different and represent each material separately. Analyzing the spectrum III in Figure 3b, taken in a dark region, we can observe that is a combination of the spectra of each individual material present. In a general analysis, this spectrum is quite similar to the characteristics of the needle spectrum. However, it is possible to observe the presence of peaks located near to 1320 cm-1 and
0 500 1000 1500 2000 2500 3000 In ten si ty (ar b itr ar y) Raman Shift (cm-1) 0 500 1000 1500 2000 2500 3000 In ten si ty (ar b itr ar y) Raman Shift (cm-1) 0 500 1000 1500 2000 2500 3000 In ten si ty (ar b itr ar y) Raman Shift (cm-1)
a)
d)
c)
b)
C.A. Andrade et al., Rev. Bras. Crimin. 4(2), 7-18, 2015 1600 cm-1, characteristic of the gauge plate material.
Thus, this analysis confirms the hypothesis that there has been material transfer from the gauge plate to the needle.
Using Raman spectroscopy, it has been possible to prove that occurred material transfer between the gauge plate and the needle. Nevertheless, in a frontal collision assuredly this will not always occur, because it requires a greater amount of energy upon impact. Further, the material transfer may be so tenuous that becomes unfeasible this methodology. For this reason, Raman spectroscopy does not seem to be a very useful methodology to be used routinely in order to determine the vehicle collision speeds. Thus, the next section is designed to identify the needle slap effect using Video
Spectral Comparator technique. Figure 2. Raman spectra obtained from the needle and needle slap mark
on the gauge plate.
Figure 3. a) Image of magnified print of the needle of speedometer from a motorcycle instrument panel showing black points, corresponding to traces
of the gauge plate on the needle back. b) Raman spectra from: I. Gauge plate; II. Needle; III. Needle Mark. Traces of the gauge plate on the back of the needle.
3.2. Video Spectral Comparator
As demonstrated above, it is possible to occur material transfer from the gauge plate to the needle and/or vice versa. Furthermore, the needle is usually composed of phosphorescent material and so, it may take place the transfer of phosphorus from the needle to the dial at the impact. Therefore, a Video Spectral Comparator (VSC) has been used to find fluorescence evidence using ultraviolet light.
Generically, a VSC is a box with many lamps (providing multiple wavelengths), mirrors and optical filters. Then, it is possible to focus the light on the surface of the gauge plate under different angles, as well as, to
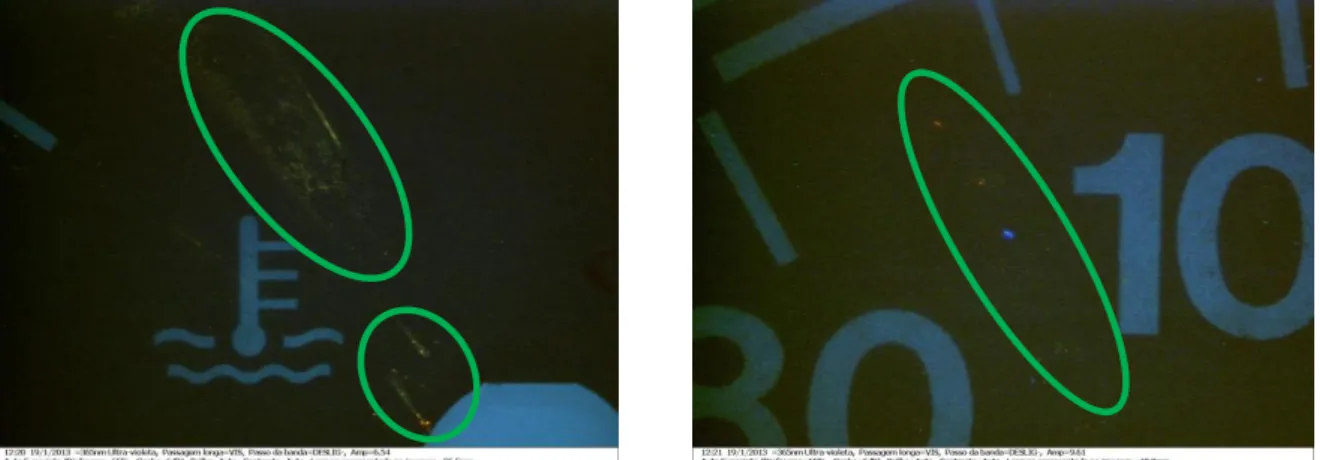
use radiation in the ultraviolet frequency. Thus, various combinations of lights and filters have been used in order to observe the fluorescence of the phosphorescent material deposited from the needle to the gauge plate. Figures 4a and 4b show a magnified image of a temperature gauge and a speedometer, respectively, from a Fiat/Uno Mille (same instrument panel adopted in Figure 1), using light in the ultraviolet region (wavelength of 365 nm), in which could be detected the effect easily.
In Figure 4, it can be seen fluorescent points deposited on the gauge surface. This fluorescent material came from the needles at the moment of impact, as a result of a frontal collision impact. From Figure 4b, it is easy to determine the vehicle speed: around 87 km/h.
200 400 600 800 1000 In ten si ty (ar b itr ar y) Raman Shift (cm-1) Isolated needle Needle mark
a)
b)
400 800 1200 1600 2000 2400 2800 I II III In ten si ty (ar b itr ar y) Raman Shift (cm-1)Figure 4. a) Magnification image of Figure 1a using light in ultraviolet region. b) Magnification image of the speedometer using light in ultraviolet
region. Green oval forms highlight the needle slap effect.
Using the VSC, it was also possible to identify friction marks on the gauge plate (without deposition of material from the needle), using only white light. In some cases, it was possible to observe with the light focusing perpendicularly on the surface, despite the best results
have been obtained with oblique lighting. An example for each configuration is shown in Figure 5, from a speedometer of a VW/Gol, which had been involved in a frontal collision against a Fiat/Prêmio.
Figure 5. Magnification image of a speedometer from a car instrument panel: a) white light focused perpendicularly on the gauge surface; b) white
light focused sideward on the gauge surface. Highlight in green, the needle slap effect.
It can be inferred from Figure 5, by the initial point of the friction mark, that the vehicle speed at the moment of impact was approximately 94 km/h. Although the VSC be capable to identify friction marks on the gauge plate, especially using oblique lighting, the results have not been as satisfactory. Given this, an Optical Microscope coupled with two mobile arms have been tested in order to better detect these marks.
3.3. Optical Microscope
With the purpose to detect friction marks on the gauge plate, it has been used an Optical Microscope coupled with mobile arms and digital camera. On one hand, the mobile arms of white light sources provide the free incidence angles calibration, on the other hand, the video camera replicate the image in a computer, where it can be captured.
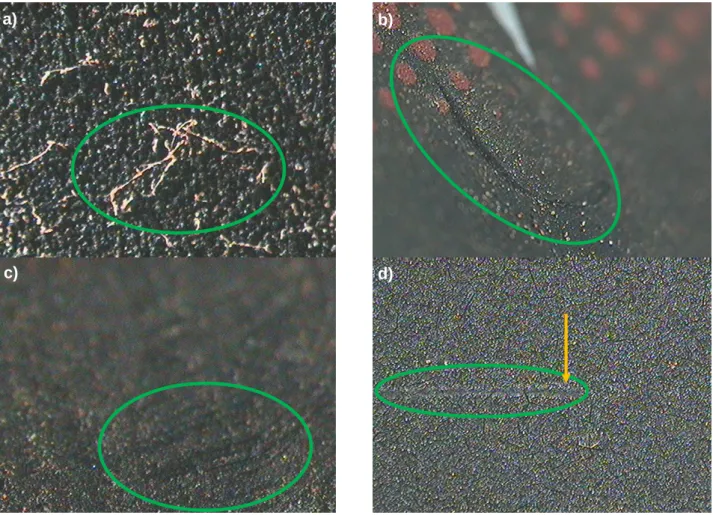
Figure 6 shows magnified images of speedometers and temperature gauges from different car instrument panels captured by optical microscope. Figure 6a is an increase of the temperature gauge shown in Figures 1a and 4a. It is easy to visualize several orange fragments, detached from the needle and attached to the gauge plate, corroborating the Raman measurements collected and analyzed at the beginning of this paper.
In Figure 6b, it can be seen the gauge plate from the motorcycle speedometer discussed at the end of section 3.1, where was possible, by Raman spectroscopy, to identify smaller fragments of the gauge plate on the back of the needle. Thus, with the support of oblique lighting, it was possible to observe friction marks produced by the needle on the gauge plate, at the instant of collision impact, indicating a speed of approximately 30 km/h.
The magnified image from a GM/Monza speedometer is shown in Figure 6c. One more time, it can be seen the
C.A. Andrade et al., Rev. Bras. Crimin. 4(2), 7-18, 2015 friction marks on the gauge plate, indicating the contact
with the needle. The speed determined using this methodology was around 70 km/h.
Finally, Figure 6d illustrates the magnified image of the same speedometer shown in Figure 5, using the VSC. Comparing both pictures, it can be seen that the image obtained with microscope gave us a more accurate and clear view of the first contact position of the needle on the gauge plate.
Given the above, the Optical Microscope coupled with mobile arms has proved to be extremely effective for identifying needle marks, even when friction marks is pretty tenuous. However, it is not always possible to collect the instrument panel for analysis into a laboratory.
Thus, the next topic is dedicated to the investigation of the needle slap effect, at the accident scene.
4. NEEDLE SLAP EFFECT: EXAMINATION AT THE ACCIDENT SCENE
The analysis carried out in the laboratory is the most recommended, notwithstanding, it should be in mind that in many cases this would be not possible: either by lack of adequate equipment, either by restriction in removing speedometer. In these cases, the exam of the needle marks can be performed at the accident scene. For this purpose, the CSI needs to possess in his kit flashlights (light sources), goggles (filters), magnifying glass and close-up filters for the camera.
Figure 6. Magnification image of speedometers and temperature gauges from different cars instruments panels: a) the same temperature gauge shown
in Figures 1a, 4a and 6a; b) speedometer discussed in Figure 3; c) speedometer of a GM/Monza; d) the same speedometer shown in Figure 5. Highlight in green, the needle slap effects.
In order to identify the needle slap effect at the accident scene, by friction marks and/or by fluorescence of the phosphorescent material in the gauge plate produced by the needle touch, it has been used light sources Megamaxx kit in the same samples described previously. This kit is composed of seven visible light sources (455 nm, 470 nm, 505 nm, 530 nm, 590 nm, 625
nm and white), one ultraviolet light source (395 nm) and three goggles (red, yellow and orange).
After combining all of the flashlights and goggles available in the kit, it has been observed that the best results were obtained:
To detect the UV fluorescence of phosphorescent material on the gauge plate: it is better to use light with wavelengths of 455 nm or 395 nm,
a)
b)
combined with red or orange goggles. Figure 7a illustrates the same speedometer shown in Figure 4a. As proved by the VSC, the combination used here was very efficient to highlight the phenomenon;
To identify friction marks on the gauge plate: it is better to use white light without goggles, focusing obliquely on the gauge surface (see Figure 7b). This figure shows the speedometer of a Fiat/Palio Weekend, which crashed frontwards against a concrete pole. It is easy to see the tip mark friction close to 34 km/h;
To enhance the validity of photographic records as forensic evidence: it is appropriate to clean the polycarbonate screen of the dashboard with
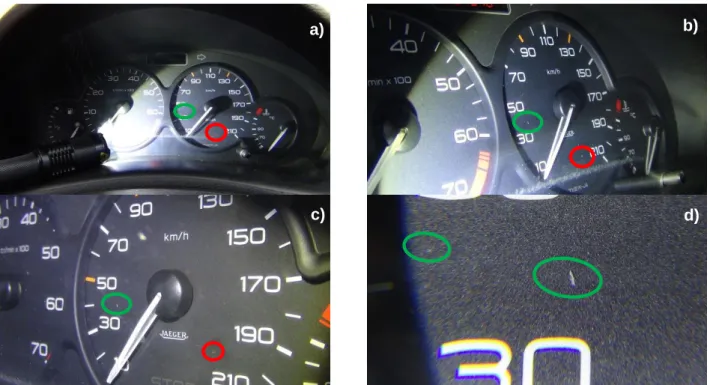
alcohol and take at least three photos. The first one perpendicular to the speedometer and two oblique in opposite sides, to ensure that scratches or smudges on instrument panel (as highlight in red in Figures 8a, 8b and 8c) will not be jumbled with marks produced by the contact between the needle and the gauge plate (highlight in green). Figure 8 shows the speedometer of a Peugeot/206, which crashed frontwards against a parked car. It is easy to see the friction mark at 43 km/h. The use of a magnifying glass can also help to find the needle slap mark and improve the photographic record when the CSI does not have close-up filters and dedicated macro lens for the camera at the accident scene (Figure 8d).
Figure 7. Image of speedometers from two different cars instruments panels: a) the same one showed in Figure 4b; b) of a Fiat/Palio Weekend, which
crashed frontwards against a concrete pole. Highlight in green, the needle slap effect.
Figure 8. Images of an instrument panel of a Pegeout/206: a) perpendicular view; b) left side view; c) right side view; d) frictions marks emphasized
by a magnifying glass. Highlight in red, we have a scratch on the polycarbonate screen and highlight in green, the needle slap effect.
a)
b)
a)
b)
C.A. Andrade et al., Rev. Bras. Crimin. 4(2), 7-18, 2015
5. DISCUSSION
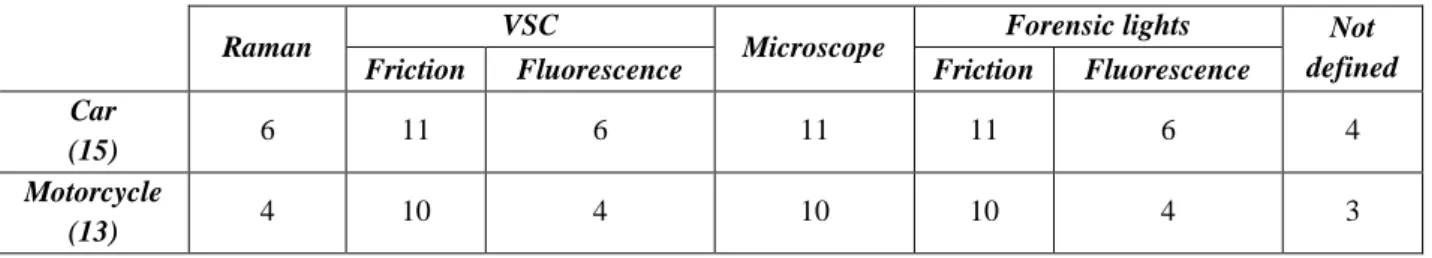
Table 1 summarizes the twenty-eight samples analyzed using the four techniques: Raman Spectroscopy, VSC, Optical Microscope and Forensic Lights kit. In general, the results show that the needle slap effect can be detected by all techniques. Besides, it is very viable their use, due to the great quantity of samples with positive
results (75% of the total). Apparently, there is no difference between cars and motorcycles speedometers to reveal the needle slap mark. However, the values obtained using needle slap effect have not been compared with other methodologies; it was only applied the knowledge disposable in the literature [22-27], except for the case study discussed in the next section.
Table 1. Summary table showing the twenty-eight samples analyzed, the techniques used and the positive results corresponding to each one.
Raman VSC Microscope Forensic lights Not
defined
Friction Fluorescence Friction Fluorescence
Car
(15) 6 11 6 11 11 6 4
Motorcycle
(13) 4 10 4 10 10 4 3
Among all the 28 speedometers analyzed, just in seven cases we did not identify the vehicle speed at impact. Four of them, they did not have any marks, probably because the driver had operated the brake system before the collision, blocking the wheels, causing the needle to move to zero value, inhibiting the occurrence of the phenomenon. The other three speedometers had many marks, disabling the accurate identification of the vehicle speed. For example, in one case, a truck has run over the motorcycle involved in the accident.
In all the others gauge plates, it was always found friction marks, using optical microscope, VSC or flashlights. Therefore, in order to determine the vehicle speed at impact, you can look for these marks at crime scene, using white light source. In ten samples, it was found material transference between the gauge plate and the needle. In these cases, it is also possible using Raman spectroscopy, VSC or forensic lights.
As can be seen in Table 1, forensic lights is as good as the laboratory techniques to identify needle slap effect.
6. CASE STUDY
With the purpose to verify the efficiency of needle slap methodology, a VW/Kombi that had collided frontally against a tree has been analyzed. This vehicle was equipped with Global Positioning System (GPS) and General Packet Radio Service (GPRS). The speedometer of the vehicle is shown in Figure 9a. Analysis using needle slap effect evidenced a speed near to 105km/h (Figure 9b). Examination of data extracted from GPRS device (Figure 9c), provided by the security company responsible for monitoring the vehicle (being the latter position compatible with the accident coordinates), has
revealed a speed of 103 km/h (Figure 9d), very close to the speed found by the needle slap effect (105 km/h).
7. CONCLUSIONS
It is desirable that the CSI responsible to reconstruct traffic accidents have at disposal a “toolbox” with many options. Thus, the CSI can decide the best technique to be employed in each case.
The needle slap effect is a very good approach to determine vehicle speed at impact, mainly in accidents:
When EDR data are not available;
When vehicles have very different weight, making it difficult to use physics laws;
When the final resting position of the vehicles are changed before the arrival of the forensic team at the crime scene;
With fixed obstacles, where damage estimation can be difficult to determine.
Despite the needle slap effect being a basic and rudimentary technique, in some cases, may be the only way to determine the vehicle speed at the time of the impact. However, no methodology can be used uncritically, even the most traditional approach. An important warning is the need to confront the evidence obtained by the needle slap method with the general framework of evidences, since the needle slap effect by itself does not guarantee it to be recent, since the needle slap mark may have been caused by a previous event.
Each traffic accident has its own characteristics and peculiarities. Therefore, it is up to the CSI, knowledgeable of the scientific methodologies of traffic crash reconstruction, to analyze the situation and decide to apply or discard the existing possibilities.
Figure 9. Confrontation between vehicle speeds determined by the needle slap effect and obtained using data from GPS-based vehicle tracking
system, in a VW/Kombi involved in a frontal collision. a) speedometer of the vehicle; b) needle slap effect highlight in red, using flashlights and
goggles; c) GPS and GPRS device found into the vehicle; d) data records provided by the security company responsible for monitoring the vehicle, with the last positions (GPS coordinates) and speeds.
In this paper, it was possible to show how to apply methodologies able to identify the needle slap effect:
Despite Raman spectroscopy prove the material transfer between the needle and the gauge plate, this technique has not been shown very useful to be used routinely, due to this transfer does not always occurs, because it depends of the energy involved in a collision and of the needle and gauge plate materials;
VSC is a useful method to identify phosphorescent materials from the needle on the gauge plate, as well as, friction marks produced by the needle on the gauge plate, due to several lights incorporated in the equipment, besides the various possible arrangements;
The most powerful method to visualize friction marks produced by the needle in the gauge plate is the Optical Microscope coupled with mobile arms, to provide oblique lighting, and digital color camera, to allow image capture;
In spite of ideal is evaluate the instrument panels in the laboratory, if the analysis is necessary at the accident scene, it has been shown to be extremely viable and plausible with specific wavelengths lights (flashlights), particular filters (goggles) and close-up filters to the camera.
The needle slap effect, as many others methodologies, has some limitations. For example, it cannot be used when occur the wheel lock or in vehicles equipped with digital speedometers. In addition, in this paper, only frontal collisions, which promotes the manifestation of the effect, were investigated.
Finally, as a suggestion, the responsible offices could formulate laws to automotive industries, in order to regulate the use only of materials that promote the exchange between the needle and the gauge plate, to highlight the needle slap effect. Furthermore, it is necessary to obligate the automotive industry to use EDR in all cars manufactured and standardize the programming language as well as the data type disposable.
As a suggestion for future work, the investigation of how the needle slap effect applies to side and rear collisions between vehicles can be done.
ACKNOWLEDGMENTS
The authors would like to thank the support from the Ilaraine Acácio Arce Criminalistics Expert Foundation (FPCIAA), Brasilia’s Association of Forensic Experts (ABPC), Brazilian Federal District Research Support Foundation (FAP/DF) and the Civil Police of the Brazilian Federal District (PCDF).
a)
b)
C.A. Andrade et al., Rev. Bras. Crimin. 4(2), 7-18, 2015
REFERENCES
[1] IPEA, Impactos sociais e econômicos dos acidentes de trânsito nas aglomerações urbanas, Instituto de Pesquisa Econômica Aplicada, Brasília, Brazil, 2003.
[2] WHO, Road Traffic injuries, Fact sheet no 358, World Health Organization, September 2012. Available at: http://www.who.int/mediacentre/factsheets/fs358/en/inde x.html (Accessed: 7th December 2012).
[3] Portal Do Trânsito Brasileiro. Trânsito Brasileiro.
Available at:
http://www.transitobr.com.br/index2.php?id_conteudo=1 18 (Accessed: 6th July 2011).
[4] C.A. Andrade, A.O. Lopes, M. K. Ribeiro, W. Fonseca. Identificação de segmentos críticos em acidentes de trânsito na Rodovia DF-002: geoprocessamento de dados do Instituto de Criminalística da Polícia Civil do Distrito Federal. Rev. Bras. Crimin. 2(1), 16-23, 2013.
[5] C.A. Andrade, B. Telles, M.S. Sercheli, N.M.
Kawano, R.M. Soares, A.N. Vicente, W.X. Camargo Filho, J.A. Gomes. Road design intrevention based on traffic accident dynamics: a forensic intelligence
approach. WIT Transactions on the Built
Environment. 146, 569-578, 2015.
[6] A.F.B. Andrade, B. Telles, M.S. Sercheli, N.M.
Kawano, R.M. Soares, C.A. Andrade, A.N. Vicente, W.X. Camargo Filho, J.A. Gomes. Analysis of car-pedestrian accidents on highways in the Brazilian Federal District. WIT Transactions on the Built Environment. 146,
579-590, 2015.
[7] L.B. Fricke. Traffic Crash Reconstruction. 2ª ed., Northwestern University – Center for Public Safety, Evanston, Illinois, 2010.
[8] O. Svenson, I. Salo. Effects of speed limit variation on judged mean speed of a trip. Accid. Anal. Prev. 42, 704-708, 2010.
[9] W. Santos, M.H. Santos. Acidente de Tráfego. In: Cabral, A.R. (ed). Local de Crime, Academia de Polícia Civil, Brasília, Brazil, 2008.
[10] K.S. Baker. Traffic Collision Investigation. Northwestern University – Center for Public Safety, Evanston, Illinois, 1990.
[11] H.Y. Lin, K.J. Lia, C.H. Changa. Vehicle speed detection from a single motion blurred image. Image Vis. Comput. 26, 1327-1337, 2008.
[12] J. Balazic, I. Prebil, N. Certanc. Computer simulation of the accident with nine victims. Forensic Sci. Int. 156, 161-165, 2006.
[13] W. Toresan Júnior. Metodologias para Cálculos de Velocidades em Acidentes de Trânsito com Motocicletas. Available at: http://www.acrigs.com.br/artigos.php (Accessed: 16th March 2010).
[14] J.J. Eubanls, P.F. Hill. Pedestrian Accident Reconstruction and Litigation. 2nd ed. Lawyers & Judges Publishing Co., Inc., USA, 1998.
[15] T.D. Lewis. Commentary: New means of traffic accident reconstruction are accelerating. Michigan Lawyers Weekly, Academic OneFile, November 26th, 2007.
[16] D. Donnelly. Black box technology in the courtroom. Trial, Auto Cases, April 2002.
[17] D. Vangi. Simplified method for evaluating energy loss in vehicle collisions. Accid. Anal. & Prev. 41, 633-641, 2009.
[18] D. Vangi. Energy loss in vehicle-to-vehicle oblique impact. Int. J. Impact Eng. 36, 512-521, 2009.
[19] R.M. Brach. Analysis of planar vehicle collisions using equations of impulse and momentum. Accid. Anal. & Prev. 15(2), 105-120, 1983.
[20] K.L. Campbell. Energy basis for collision severity. SAE Paper 740565, 1974.
[21] Latin NCAP, Segurança precária nos carros mais vendidos na América Latina. Imprensa, Notícias, Programa de Avaliação de Carros Novos na América Latina, November 2011. Available at: http://www.latinncap.com/po/noticias/84ece77d0129d2/se guranca-precaria-nos-carros-mais-vendidos-na-america-latina (Accessed: 4th January 2013).
[22] W. Toresan Júnior. Uma discussão sobre o fenômeno “Needle Slap”. Sindicato dos Peritos Oficiais da Área Criminal do Rio Grande do Sul, Brazil, January 2012. Available at: http://www.acrigs.com.br/artigos.php (Accessed: 30th October 2012).
[23] D. Tao, Z. Yin, H. Zhao, S. Liu. The experimental and case study of needle marks on the speedometer as the physical evidence for the collision speed analysis. J. Forensic Sci. 57(3), 772-777, 2012.
[24] T. Schwartz. Trace Evidence. Department of Laboratories and Research. Available at: http://www.westchestergov.com/labsresearch/forensicandt ox/forensic/trace/fortraceframeset.htm (Accessed: 30th October 2012).
[25] A.L. Pennybaker, J.W. Ross, G.L. Wilson. A Summary of Crashworthiness Information for Small Airplanes. Federal Aviation Administration, Aeronautical Center, Flight Standards Tech. Div., Oklahoma, 1973. [26] D.H. Marden. Report of the Superior Court: Civil Action – Docket no 00-34, State of Maine, Washington,
April 1st, 2002. Available at:
http://www.fosterlaw.org/PDF/Davis%20case.pdf (Accessed: 30th October 2012).
[27] NTSB, Highway Accident Report. NTSB/HAR-03/02, PB2003-916202, Notation 7561. Ford Explorer Sport Collision With Ford Windstar Minivan and Jeep Grand Cherokee on Interstate 95/495 Near Largo, Maryland, NTSB – National Transportation Safety Board, Washington DC, 2002. Available at: http://www.ntsb.gov/doclib/reports/2003/HAR0302.pdf (Accessed: 30th October 2012).
[28] INTERPOL, 15th International Forensic Science Symposium, Lyon, 2007.
[29] J.A. Gomes, M.S. Sercheli. Espectroscopia Raman: um novo método analítico para investigação forense em
cruzamento de traços. Rev. Bras. Crimin. 1(1), 22-30, 2011.
[30] Brazil, Código de Processo Penal, Artigos 170 e 181, 2009.