www.ccarevista.ufc.br ISSN 1806-6690
Diallel analysis of tropical and temperate sweet and supersweet corn
inbred lines
1Análise dialélica de linhagens tropicais e temperadas de milho doce e super-doce
Andréia Kazumi Suzukawa2, Carolina Bertuzzi Pereira2, Mayara Mariana Garcia2, Rodrigo Iván
Contreras-Soto3, Douglas Mariani Zeffa2, Marlon Mathias Dacal Coan2 and Carlos Alberto Scapim2*
ABSTRACT - The number of sweet corn cultivars adapted to the climatic conditions and with agronomic traits recommended
to the Brazilian market is still limited. Thus, the aim was to investigate the general and specific combining ability (GCA and SCA, respectively) in relation to the grain yield (GY) and total soluble solid (TSS) contents of seven lines of sweet corn (su1)
and eight lines of supersweet corn (sh2) by diallel crosses. For TSS, the inbred lines SC6 and SC7 of sweet corn, and SSC7
and SSC8 of supersweet corn showed higher GCA effect. For GY, the inbred lines SC1 and SC2 of sweet corn and SSC4 and SSC6 of supersweet corn showed higher GCA effect. For TSS in sweet corn, the hybrids ‘4 × 6’ and ‘1 × 7’ showed the superior
Ŝij estimates across all evaluated environments. For GY, the hybrid ‘5 × 7’ was the most relevant because it showed higher Ŝij
estimates in most of the evaluated environments. Additionally, the hybrids ‘1 × 4’, ‘3 × 4’, and ‘1 × 7’ showed positive Ŝij values across all environments. In supersweet corn, the hybrids ‘2 × 8’, ‘3 × 6’, and ‘5 × 6’ should be selected as the most promising for both traits (TSS and GY), because they presented positive and high Ŝijestimates across the six environments.
Key words:Zea mays L. saccharata. General and specific combining ability. Grain yield. Total soluble solids.
RESUMO - O número de cultivares de milho doce adaptada às condições climáticas e com características agronômicas
recomendadas para o mercado brasileiro ainda é restrito. Assim, objetivou-se investigar as capacidades de combinações gerais e específicas em relação ao rendimento de grãos (GY) e teor de sólidos solúveis totais (TSS) de sete linhagens de milho doce (su1) e oito linhagens de milho super-doce (sh2) pela análise de cruzamentos dialélicos. Para TSS, as linhagens SC6 e SC7
de milho doce, e SSC7 e SSC8 de milho super-doce apresentaram valores superiores para capacidade geral de combinação. Para rendimento de grãos, as linhagens SC1 e SC2 de milho doce, e SSC4 e SSC6 apresentaram valores superiores para capacidade geral de combinação. TSS em milho doce, os híbridos 4x6 e 1x7 apresentaram as estimativas Ŝijsuperiores em todos os ambientes avaliados. Para GY, o híbrido 5x7 foi o mais relevante pois apresentou amais alta estimativa Ŝijna grande maioria dos ambientes. Além disso, os híbridos 1x4, 3x4 e 1x7 destacaram-se com valores positivos em todos os ambientes. Em milho super-doce, os híbridos 2x8, 3x6 e 5x6 devem ser selecionados como os mais promissores para ambos os caracteres (TSS e GY), pois apresentaram estimativas Ŝijpositivas e altas nos seis ambientes.
Palavras-chave: Zea mays L. saccharata. Capacidades geral e específica de combinação. Rendimento de grãos. Sólidos
solúveis totais.
DOI: 10.5935/1806-6690.20180069 *Author for correspondence
Received for publication on 15/03/2017; approved 07/11/2017 1Trabalho de Pesquisa ligado ao CNPq
2Departamento de Agronomia, Universidade Estadual de Maringá/UEM, MARINGA-PR, Brasil, kazumi.s@gmail.com, carol_bertuzzi@hotmail.com, garcia.mayaram@gmail.com, douglas.mz@hotmail.com, marloncoan@gmail.com, cascapim@uem.br
INTRODUCTION
Sweet corn (Zea mays L. saccharata) is considered one of the most popular vegetables in the US and Canada (TRACY, 2001) because of its improved shelf life and taste (DODSON-SWENSON; TRACY, 2015). In Brazil, the cultivation area of sweet corn is 36,000 ha (SANTOSet al., 2014), which represents only 14.4% of the area occupied by US sweet corn (UNITED STATES DEPARTMENT OF AGRICULTURE, 2014). The destination of sweet corn, mainly used as green maize, is exclusively for human consumption, due to the fact that it has sweet taste, fine pericarp and endosperm, and delicate texture (SAet al., 2010; TEIXEIRAet al., 2001; TEIXEIRAet al., 2014; TRACY, 2001).
The sweetness of sweet corn is a recessive trait controlled by the mutant genes sugary 1 (su1), shrunken 2 (sh2), brittle 1 (bt1), sugary enhancer (se) and brittle 2 (bt2). These genes may act in a single, double or triple combination (SINGH; LANGYAN; YADAVA, 2014). All of them promote changes in carbohydrate composition in the endosperm and differ in the starch and sugar proportions in the kernel and in relation to chromosome position (TRACY, 2001). Supersweet corn is a variety of corn in which the homozygous hybrid has the shrunken-2 (sh
2) gene (TRACY, 2001; YOUSEF; JUVIK, 2002)
with about a 9 to 14% sugar content, and present about 15 to 25% of accumulated sugar in the endosperm. This higher accumulation results in a longer harvesting period, which implies a slower conversion of sugar to starch (MARSHALL; TRACY, 2003).
Sweet corn breeding programs target quality characteristics such as flavor, sweetness, creamy texture, appearance, aroma and low starch content. Specifically, high productivity stands out as the main objective of sweet corn breeding programs (LERTRAT; PULAM, 2007). In Brazil, some government and private companies are working to develop commercial cultivars adapted to tropical conditions. However, the number of cultivars recommended for the Brazilian market is still small in relation to the growing demand. Currently, 58 cultivars are registered in Brazil, although there is still the possibility for research and development of new cultivars (BRASIL, 2016). In order to be successful in breeding programs, it is essential to knowa priori the available lines of behavior, their performanceper se and their hybrid combinations. In this context, the diallel crosses system is an efficient genetic design to obtain information on the genetic control of quantitative traits (JINKS; HAYMAN, 1953). The most common methodologies of diallel analysis used are those proposed by Griffing (1956), which estimates the general and specific combining ability and provides information on the predominance of genetic action; the
method proposed by Gardner and Eberhart (1966), which evaluates the effects of varieties and varietal heterosis; and the method proposed by Hayman (1954), which provides information on the basic inheritance mechanisms, genetic values and selection limits.
Thus, the aim was to investigate the general and specific combining abilities based on diallel crosses of sweet and supersweet corn and their F1’s in different environments and evaluate the quality and yield traits.
MATERIAL AND METHODS
Six inbred lines of sweet (su1) and eight of supersweet corn (sh
2) in S6 were obtained from successive
self-crosses. The descriptions of the inbred lines are shown in Table 1.
The joint analyses of variance for each trait were performed according to the randomized complete block design with three replications. For the sweet group (su
1),
21 F1 hybrids were evaluated in five environments: E1-Maringá, E2-Iguatemi, E3-Cidade Gaúcha, E4-Sabáudia, and E5-Umuarama. The variety Doce Cristal was used as check, and for the supersweet group (sh2), 28 F1 hybrids were evaluated in six environments: E1-Maringá, E2-Iguatemi, E3-Cidade Gaúcha, E4-Sabáudia, E5-Umuarama and E6-Cascavel (Table 2). The hybrid Tropical Plus® (Syngenta) was used as check, because
it is the most planted sweet corn cultivar in the country, and is considered a standard for the crop by breeders. For sweet and supersweet corn, the hybrids were arranged in randomized complete block design with three replications and were evaluated in the 2013–2014 crop season at each of the five and six environments, respectively. The plot size consisted of double rows with 5 m long, and 0.9 m spacing between rows, totaling a useful area of 9 m2.
Fertilizer and field management practices recommended for optimum maize production were used in each environment.
In each plot, ears had the husks removed and those more than 15 cm in length, greater than 3 cm in diameter and free of pests and diseases were weighed in order to determine the marketable grain yield (GY) without the husk. Grain yield (GY) adjusted to 70% moisture was computed from grain weight in kg ha-1. Total soluble
solid (TSS, oBrix) contents were determined using a
digital refractometer (PAL -1, Atago Co., Ltd., Tokyo, Japan).
Bartlett’s test with χ2 distribution (p<0.05) was
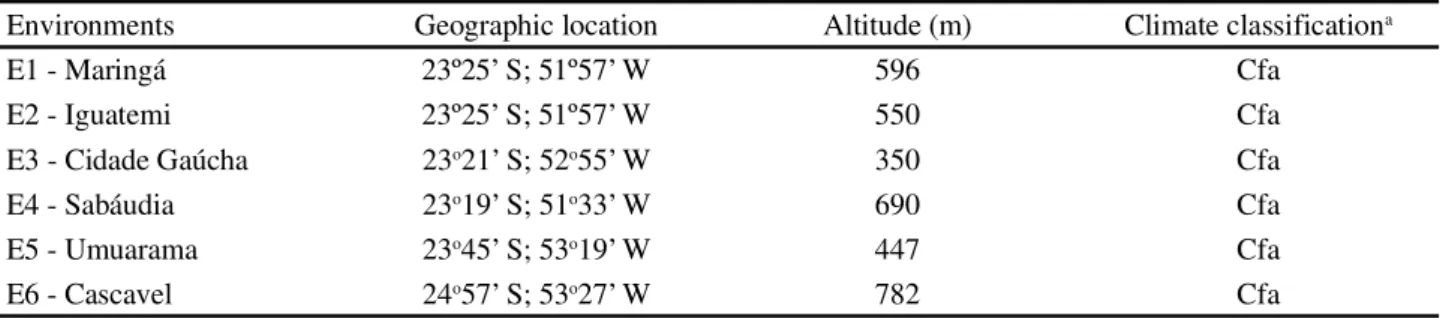
Table 2 -Geographic location, altitude and climate classification of the environments
aKöppen climate classification (MCKNIGHT; HESS, 2000)
Table 1 - Description of the seven inbred lines of sweet corn (su1) and eight inbred lines of supersweet corn (sh2) used at the diallel
crosses
The model of the joint analysis studied was as follows:
Y
ijk = µ + B(j)k + Gi + Ej + GEij + εijk (1)
where:Y
ijk is the observation of thek
th block, evaluated in
theith genotype and in thejth environment; µ is the overall
mean;B
(j)k is the effect of the blockk within environment
j; G
i is the effect of the genotype i; Ej effect of the
environment j; GE
ijis the effect of interaction between
genotypei and the environmentj; εijk is the experimental error associated to theijk observation.
The joint diallel analysis for Griffing’s method 4 (GRIFFING, 1956) is illustrated in Table 3 and represented by the following model:
Y
ijk = µ + gi + gj + eK + Sij + (eg)ik + (eg)jk + (es)ijk + Ēijk (2)
where: Y
ijk is the overall mean observed between the
hybrid combination of theith inbred line and thejthinbred
line (i ≠ j) into the kth environment; µ is the overall
mean; e is the environment effect; g
i is the general
combining ability effect associated to theithinbred line; gj is the general combining ability effect associated to the jth inbred line;S
ijis the specific combining ability
effect between the inbred lines i andj;(eg)ik e (eg)jk is the general combining ability effect of the inbred lines with environments; (es)
ijk is the specific combining
ability effect between the ith and jth inbred lines with environments, and Ēijkis the mean experimental error. The degrees of freedom of the genotype × environment interaction (G × E) were partitioned into the effects of GCA × E and SCA × E, according to Vencovsky and Barriga (1992) (Table 3).
Inbred line Origin and description
SC1 Sweet corn (su
1), Doce Cristal
SC2 Sweet corn (su
1), Doce Cubano
SC3 Sweet corn (su1), Doce Cubano
SC4 Sweet corn (su1), Doce 43 In (Viçosa)
SC5 Sweet corn (su1), Doce Cristal
SC6 Sweet corn (su1), Doce 13 In (Viçosa)
SC7 Sweet corn (su
1), Doce I (EMBRAPA)
SSC1 Supersweet corn (sh2), Inbred line extracted of Tropical Plus®
SSC2 Supersweet corn (sh
2), Inbred line extracted of Tropical Plus®
SSC3 Supersweet corn (sh2), Inbred line extracted of American commercial hybrid (Doce Garden) SSC4 Supersweet corn (sh2), Inbred line extracted of the commercial hybrid Splendor (Syngenta) SSC5 Supersweet corn (sh2), Inbred line extracted of RB6324
SSC6 Supersweet corn (sh2), Inbred line extracted of RB6324
SSC7 Supersweet corn (sh
2), Inbred line of Bônus (Syngenta)
SSC8 Supersweet corn (sh2), Inbred line extracted of Penta (common maize) with the genesh2sh2
Environments Geographic location Altitude (m) Climate classificationa
E1 - Maringá 23º25’ S; 51º57’ W 596 Cfa
E2 - Iguatemi 23º25’ S; 51º57’ W 550 Cfa
E3 - Cidade Gaúcha 23o21’ S; 52o55’ W 350 Cfa
E4 - Sabáudia 23o19’ S; 51o33’ W 690 Cfa
E5 - Umuarama 23o45’ S; 53o19’ W 447 Cfa
Phenotypic, genotypic and environmental correlation between total soluble solids and grain yield for sweet and supersweet corn was implemented into the software GENES (CRUZ, 2013).
RESULTS AND DISCUSSION
In sweet and supersweet corn, for TSS and GY, Bartlett’s test showed homogeneity of residual mean squares among the individual analyses (data not shown). Thereby, joint analysis of variance was conducted for sweet and supersweet corn across the five environments and six environments, respectively.
In sweet and supersweet corn, the average environmental coefficient of variation showed values of 8.00 and 8.10% for TSS, and 8.70 and 7.10% for GY, respectively (Table 3). These mean values were considered low when compared with Assunção et al. (2010) and Kwiatkowski, Clemente and Scapim (2011), suggesting the reliability of our results.
For GY and TSS, statistical differences (p<0.05) were observed among the sweet and supersweet inbreds and hybrids. Furthermore, for TSS and GY, significant (p<0.05) effects were observed for the G × E mean squares, except for the GY of supersweet corn (Table 3). The significant differences detected for both sweet and supersweet corn among the inbreds and hybrids for TSS and GY indicated that there was adequate genetic variability among the inbreds and hybrids to allow satisfactory progress from selection for the improvement
of traits. These results were consistent with the findings of Allamet al.(2016), Djemelet al.(2015), Ordáset al. (2010), and Revillaet al.(2010), and represent a relevant report, since there is a need for lines to be adapted to different environments to obtain superior hybrids.
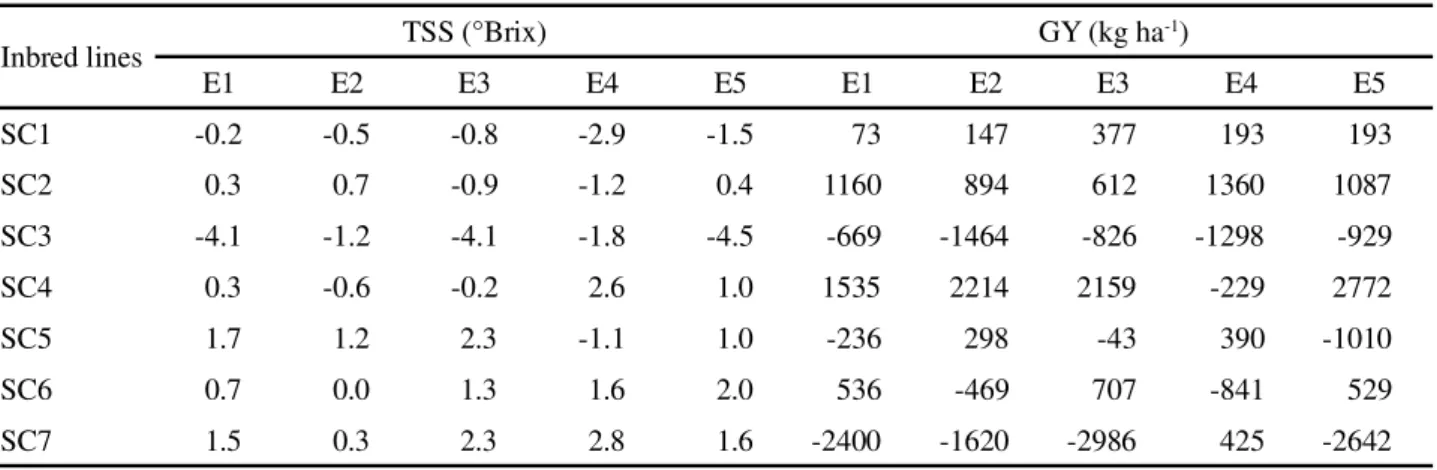
In sweet corn, both GCA and SCA effects for TSS and GY were estimated by environment because their interaction was significant (p<0.05) (Tables 4 and 5). The lines SC6 and SC7 showed the higher and more positive estimates of GCA (ĝi) across the five evaluated
environments for TSS, suggesting that both inbred lines could generate promising hybrid combinations. For GY, the lines SC1 and SC2 showed higher and more positive estimates of GCA (ĝi) across the five evaluated environments. Hence, these inbred lines could contribute positively to their crossing, suggesting that higher and positive estimates of GCA could represent favorable allele frequencies when compared to contrasting lines in the diallel result.
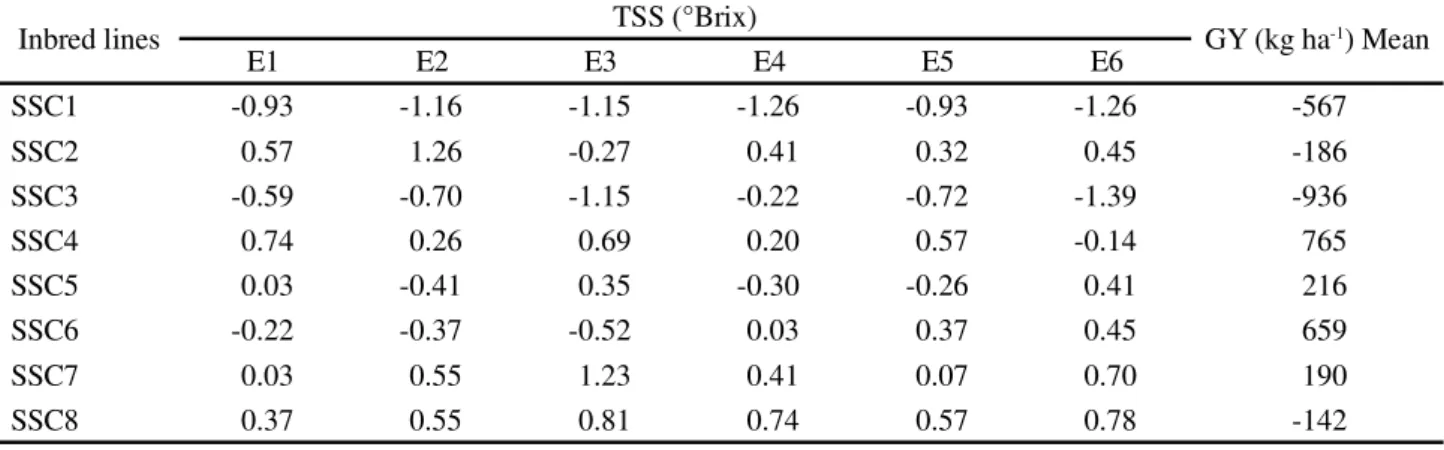
In supersweet corn, for GY, GCA and SCA effects were estimated based on environment general mean, on the other hand, for TSS, GCA and SCA effects were estimated by environment, since GCA and SCA by environments were significant (p<0.05) (Tables 6 and 7). For GY, the lines SSC4 and SSC6 showed the higher and positive estimates of GCA (ĝi) across the mean of the six evaluated environments. For TSS, the lines SSC7 and SSC8 showed the best performance at the six evaluated environments revealing positive estimates of ĝi. Consequently, these inbreds contribute with additive genetic effect and could increase the
Table 3 -Summary of analysis of variance for total soluble solids (TSS) and grain yield (GY), conducted at different environments in
2013/2014 crop season for sweet and supersweet corn
* andns = significant and non-significant at 5% probability according to F-test; DF = degrees of freedom; CV (%) = mean coefficient of environmental variation
Sources of variation DF Sweet corn Mean squares DF Supersweet corn Mean squares
TSS GY TSS GY
Genotypes (G) 20 303.5* 132,993,227.7* 27 128.2* 125,561,540.4*
GCA 6 281.6* 140,698,466.6* 7 59.3* 484,615,82.5*
SCA 14 312.9* 129,690,982.4* 20 152.3* 152,546,525.6*
Environments (E) 4 17.6* 1,399,882.7* 5 5.3* 6,558,525.5*
G x E 80 46.2* 17,107,874.6* 135 4.1* 1,647,710.8ns
GCA x E 24 29.8* 14,023,044.9* 35 3.6* 1,562,902.0ns
SCA x E 56 53.3* 18,429,944.5* 100 4.2* 1,677,393.9ns
Residual mean 300 2.2 1,731,602.2 486 2.1 1,409,854.9
Mean 18.5 16,785.99 18.1 15,160.0
Table 4 - Estimates of general combining ability for total soluble solids (TSS) and grain yield (GY) in seven inbred lines of sweet corn evaluated in five environments (E1: Maringá, E2: Iguatemi, E3: Cidade Gaúcha, E4: Sabáudia and E5: Umuarama)
Table 5 -Estimates of specific combining ability for total soluble solids (TSS) and grain yield (GY) in 21 hybrids of sweet corn
evaluated in five environments (E1: Maringá, E2: Iguatemi, E3: Cidade Gaúcha, E4: Sabáudia and E5: Umuarama)
Inbred lines TSS (°Brix) GY (kg ha
-1)
E1 E2 E3 E4 E5 E1 E2 E3 E4 E5
SC1 -0.2 -0.5 -0.8 -2.9 -1.5 73 147 377 193 193
SC2 0.3 0.7 -0.9 -1.2 0.4 1160 894 612 1360 1087
SC3 -4.1 -1.2 -4.1 -1.8 -4.5 -669 -1464 -826 -1298 -929
SC4 0.3 -0.6 -0.2 2.6 1.0 1535 2214 2159 -229 2772
SC5 1.7 1.2 2.3 -1.1 1.0 -236 298 -43 390 -1010
SC6 0.7 0.0 1.3 1.6 2.0 536 -469 707 -841 529
SC7 1.5 0.3 2.3 2.8 1.6 -2400 -1620 -2986 425 -2642
Hybrids TSS (°Brix) GY (kg ha-1)
E1 E2 E3 E4 E5 E1 E2 E3 E4 E5
1x2 0.9 -2.5 -0.3 -0.3 -2.5 -2804 -4945 -1461 -1901 -4155
1x3 -0.5 1.6 -0.6 3.5 -0.9 -746 512 -2545 -895 -1046
1x4 -1.9 -1.4 -1.7 -3.9 -1.8 1525 3722 2712 202 2462
1x5 -5.8 -5.8 -7.4 1.5 -6.6 -2039 -2655 -2461 704 -1976
1x6 1.7 3.7 0.6 -1.9 1.4 3274 97 3698 -162 4092
1x7 5.6 4.4 9.3 1.1 10.5 790 3269 57 2051 623
2x3 0.3 3.5 4.5 6.1 0.0 1823 2254 1923 -1067 2159
2x4 -0.9 -0.3 -5.2 -8.1 0.5 2724 2883 -14 2059 1507
2x5 0.4 0.8 1.7 5.6 1.5 -2725 -4076 -3329 1865 -2652
2x6 -2.5 -2.7 -1.9 0.6 -2.0 1636 5174 2181 -1145 2629
2x7 1.9 1.3 1.1 -3.8 2.6 -655 -1290 699 190 512
3x4 -1.2 -3.5 -2.2 -2.0 -0.8 1802 810 4379 698 1936
3x5 1.1 0.9 0.6 -2.8 1.9 -1510 -2157 -2626 2006 -3293
3x6 -3.1 -5.6 -4.2 2.2 -4.4 -590 -1426 -515 199 758
3x7 3.5 3.1 1.8 -7.0 4.3 -780 8 -616 -942 -515
4x5 1.9 1.6 5.0 2.0 1.4 1052 3823 3441 -2352 4442
4x6 8.0 9.8 10.5 4.3 9.7 -3969 -6539 -6481 2168 -6294
4x7 -5.9 -6.2 -6.4 7.6 -8.9 -3134 -4700 -4038 -2775 -4053
5x6 1.8 0.0 0.5 -6.8 2.9 546 2523 1097 -2379 -570
5x7 0.7 2.5 -0.3 0.5 -1.0 4676 2541 3878 156 4048
6x7 -5.8 -5.1 -5.6 1.6 -7.5 -898 171 19 1319 -615
contents of TSS. In supersweet corn, the inbred line SSC4 showed positive estimates of ĝifor TSS in five of the six evaluated environments and positive average ĝi
Table 7- Estimates of specific combining ability for total soluble solid (TSS) and grain yield (GY) in 28 hybrids of supersweet corn evaluated in six environments (E1: Maringá, E2: Iguatemi, E3: Cidade Gaúcha, E4: Sabáudia, E5: Umuarama and E6: Cascavel)
Table 6 - Estimates of general combining ability for total soluble solid (TSS) and grain yield (GY) in eight inbred lines of supersweet
corn evaluated in six environments (E1: Maringá, E2: Iguatemi, E3: Cidade Gaúcha, E4: Sabáudia, E5: Umuarama and E6: Cascavel)
Hybrids TSS (°Brix) GY (kg ha-1) Mean
E1 E2 E3 E4 E5 E6
1x2 3.70 2.48 1.94 2.60 2.52 3.02 -5
1x3 -2.88 -2.82 -1.19 -0.03 -2.19 -2.40 -808
1x4 2.79 2.23 1.98 2.80 3.52 2.60 66
1x5 0.49 -0.36 0.06 0.30 0.86 0.31 -2316
1x6 -2.76 -2.90 -2.32 -4.28 -3.52 -3.73 2934
1x7 1.99 2.94 2.94 0.60 2.52 3.02 -2706
1x8 -3.34 -1.57 -3.40 -1.99 -3.73 -2.82 2834
2x3 -1.38 -0.23 0.19 -1.45 -0.69 -0.61 -1450
2x4 1.54 1.06 2.85 1.89 1.52 2.39 2687
2x5 -4.51 -4.27 -5.82 -3.61 -4.89 -3.65 -3954
2x6 -1.26 -2.07 -0.94 0.30 -0.77 -2.19 -1904
2x7 -0.76 1.27 -0.94 -1.07 0.52 -0.19 1294
2x8 2.66 1.77 2.73 1.35 1.77 1.23 3332
3x4 -2.55 -1.48 -1.77 -2.74 -1.69 -5.27 -1113
3x5 1.16 0.94 -0.69 1.76 2.40 1.69 3421
3x6 2.91 3.39 2.44 2.93 1.52 4.14 1252
3x7 -1.09 -3.52 -1.32 -1.95 -2.94 -1.86 -1166
3x8 3.83 3.73 2.35 1.47 3.57 4.31 -135
4x5 2.58 2.73 1.48 0.35 -0.14 2.69 146
4x6 -0.67 -0.57 -1.40 -1.99 0.23 -0.11 -1389
4x7 -0.42 -0.48 0.10 2.64 -0.23 -0.61 2947
4x8 -3.26 -3.48 -3.23 -2.95 -3.23 -1.69 -3343
5x6 1.29 2.10 3.94 2.01 1.82 0.85 2982
5x7 -2.21 -1.82 -1.07 -2.61 -1.89 -2.15 417
5x8 1.20 0.69 2.10 1.80 1.86 0.27 -696
6x7 2.04 1.39 -0.44 1.55 1.48 2.06 -1334
6x8 -1.55 -1.36 -1.27 -0.53 -0.77 -1.02 -2540
7x8 0.45 0.23 0.73 0.85 0.52 -0.27 548
Inbred lines TSS (°Brix) GY (kg ha-1) Mean
E1 E2 E3 E4 E5 E6
SSC1 -0.93 -1.16 -1.15 -1.26 -0.93 -1.26 -567
SSC2 0.57 1.26 -0.27 0.41 0.32 0.45 -186
SSC3 -0.59 -0.70 -1.15 -0.22 -0.72 -1.39 -936
SSC4 0.74 0.26 0.69 0.20 0.57 -0.14 765
SSC5 0.03 -0.41 0.35 -0.30 -0.26 0.41 216
SSC6 -0.22 -0.37 -0.52 0.03 0.37 0.45 659
SSC7 0.03 0.55 1.23 0.41 0.07 0.70 190
In sweet and supersweet corn breeding programs, the identification of inbred lines with high favorable genes for GY and grain quality traits such as TSS is highly desirable. However, in the present study, no inbred lines showed this condition. Similar results were showed by Ha (1999) and Kumari, Gadag and Jha (2007) who mentioned the difficulty in finding hybrids showing high GY and TSS.
In sweet corn, as mentioned, the GCA and SCA effects were estimated by environment. Consequently, our results indicated that hybrid vigor or positive heterosis is a major factor in the superior performance of F1s in terms of TSS. This confirms similar findings in sweet corn (ASSUNÇÃO et al., 2010; KHANDURI et al., 2010; SOLOMON; MARTIN; ZEPPA, 2012). Thus, for TSS, the hybrids ‘4 × 6’ and ‘1 × 7’ showed the superior Ŝij estimates across all the evaluated environments. For GY, the hybrid ‘5 × 7’ was the most relevant because it showed the best Ŝij estimates (across environment means). Additionally, the hybrids ‘1 × 4’, ‘3 × 4’, and ‘1 × 7’ showed positive Ŝijvalues across all environments. In fact, the simultaneous selection of hybrids based on both traits indicated that the hybrid ‘1 × 7’ was the most promising.
In supersweet corn, the hybrids ‘2 × 8’, ‘3 × 6’, and ‘5 × 6’ should be selected as the most promising for both traits, because they presented positive and high Ŝij
estimates across the six environments. These hybrids have at least one of the parents with high GCA (inbred line SSC8 for TSS and SSC6 for GY).
In sweet corn, the hybrids ‘1 × 7’ and ‘4 × 6’ showed the highest percentages of TSS, surpassing the Doce Cristal check. Specifically, the hybrid ‘4 × 6’ demonstrated the best performance for TSS across all evaluated environments, with values ranging from 27 (Environment E4) to 32 °Brix (Environment E5). These TSS values were higher than those reported by Pinhoet al. (2010). For GY, the hybrids did not show a similar pattern of behavior. Consequently, none of the sweet corn hybrids could be considered as superior for TSS and GY, simultaneously. For supersweet corn, the hybrids ‘2 × 4’, ‘2 × 8’, and ‘3 × 8’ showed the best performances for TSS across all the evaluated environments, with similar or superior behavior than that of the Tropical Plus® check.
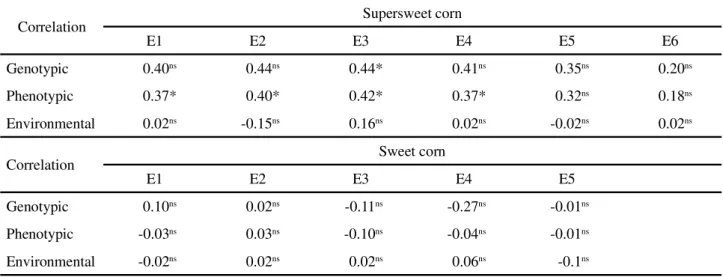
The genotypic, phenotypic and environmental correlation for TSS and GY, in both sweet and supersweet corn, was not significant in most of the evaluated environments. Only, in supersweet corn in environments E1, E2, E3 and E4, positive and significant phenotypic correlation was observed for TSS and GY (Table 8). On the other hand, in supersweet corn, non-significant genotypic and environmental correlations were observed between these traits in the same environments. There are very few studies correlating GY with TSS in sweet and supersweet corn, but our results may indicate that there is no possibility for indirect selection in sweet and supersweet corn breeding programs, because genetic gain in TSS through indirect selection of GY will not be possible.
Correlation Supersweet corn
E1 E2 E3 E4 E5 E6
Genotypic 0.40ns 0.44ns 0.44* 0.41ns 0.35ns 0.20ns
Phenotypic 0.37* 0.40* 0.42* 0.37* 0.32ns 0.18ns
Environmental 0.02ns -0.15ns 0.16ns 0.02ns -0.02ns 0.02ns
Correlation Sweet corn
E1 E2 E3 E4 E5
Genotypic 0.10ns 0.02ns -0.11ns -0.27ns -0.01ns
Phenotypic -0.03ns 0.03ns -0.10ns -0.04ns -0.01ns
Environmental -0.02ns 0.02ns 0.02ns 0.06ns -0.1ns
Table 8 -Genotypic, phenotypic and environmental correlation for total soluble solids and grain yield in sweet and supersweet
corn by environments
CONCLUSIONS
1. For TSS, the inbred lines SC6 and SC7 of sweet corn, and SSC7 and SSC8 of supersweet corn, showed superior GCA effects. For GY, the inbred lines SC1 and SC2 of sweet corn, and SSC4 and SSC6 of supersweet corn, showed higher GCA effects;
2. For TSS in sweet corn, the hybrids ‘4 × 6’ and ‘1 × 7’ showed the most favorable Ŝij estimates across all
the evaluated environments, and for GY, the hybrid ‘5 × 7’ was the most relevant because it showed the most favorable Ŝijestimates. In supersweet corn, the hybrids
‘2 × 8’, ‘3 × 6’, and ‘5 × 6’ should be selected as the most promising for both traits (TSS and GY), because they showed positive and high Ŝijestimates across the
six environments.
REFERENCES
ALLAM, M. et al. Identification of QTLs involved in cold
tolerance in sweet× field corn.Euphytica, v. 208, p. 353-365, 2016.
ASSUNÇÃO, A.et al. Heterosis performance in industrial and
yield components of sweet corn.Crop Breeding and Applied
Biotechnology, v. 10, p. 183-190, 2010.
BRASIL. Ministério da Agricultura, Pecuária e Abastecimento.
Registro Nacional de Cultivares - RNC. Secretaria de Defesa
Agropecuária. - Brasília, 2016. Disponível em: <http://extranet. agricultura.gov.br/php/snpc/cultivarweb/cultivares_registradas. php>. Acesso em: 9 maio, 2016.
CRUZ, C. D. Genes: a software package for analysis in experimental statistics and quantitative genetics. Acta
Scientiarum. Agronomy, v. 35, p. 271-276, 2013.
DJEMEL, A. et al. Genetic effects of the critical factors of sugary1 fitness.The Journal of Agricultural Science, v. 154, p. 40-57, 2015.
DODSON-SWENSON, H. G.; TRACY, W. F. Endosperm carbohydrate composition and kernel characteristics of
shrunken2-intermediate (sh2-i/sh2-i Su1/Su1) and shrunken2-intermediate–sugary1-reference (sh2-i/sh2-i su1-r/su1-r) in sweet corn.Crop Science, v. 55, p. 2647-2656, 2015.
GARDNER, C. O.; EBERHART, S. A. Analysis and interpretation of the variety cross diallel and related populations.Biometrics, v. 22, p. 439-452, 1966.
GRIFFING, B. Concept of general and specific combining ability in relation to diallel crossing systems. Australian
Journal of Biological Sciences, v. 9, p. 463-493, 1956.
HA, V. Genetic analysis of some yield components and cereals kernel quality in sweet corn.Romanian Agricultural Research,
v. 11, p. 9-20, 1999.
HAYMAN, B. I. The theory and analysis of diallel crosses.
Genetics, v. 39, p. 789-809, 1954.
JINKS, J. L.; HAYMAN, B. L. The analysis of diallel crosses.
The Maize Genetics Cooperation Newsletter, v. 27, p. 48-54,
1953.
KHANDURI, A. et al. Genetic analyses and association
studies of yield components and kernel sugar concentration in sweet corn. Indian Journal of Genetics and Plant
Breeding, v. 70, p. 257-263, 2010.
KUMARI, J.; GADAG, R. N.; JHA, G. K. Genetic analysis and correlation in sweet corn (Zea mays) for quality traits, field emergence and grain yield. Indian Journal of Agricultural
Sciences, v. 77, p. 613-615, 2007.
KWIATKOWSKI, A.; CLEMENTE, E.; SCAPIM, C. A. Agronomic traits and chemical composition of single hybrids of sweet corn. Horticultura Brasileira, v. 29, p. 531-536, 2011.
LERTRAT, K.; PULAM, T. Breeding for increased sweetness in sweet corn.International Journal of Plant Breeding, v. 1, p. 27-30, 2007.
MARSHALL, S. W.; TRACY, W. F. Sweet corn. In:
WHITE, P. J.; JOHNSON, L. A. (Ed.).Corn: chemistry and
technology. 2. ed. Saint Paul: American Association of Cereal Chemists,2003. p. 537–569.
MCKNIGHT, T. L.; HESS, D. Climate zones and types: The Köppen System. In: Physical geography: a landscape appreciation. 6. ed. Upper Saddle River, NJ: Prentice Hall, 2000. p. 200-201.
ORDÁS, B. et al. Adaptation of super-sweet maize to cold conditions: mutant x genotype interaction. The Journal of
Agricultural Science, v. 148, p. 401-405, 2010.
PINHO, L.et al. Qualidade de milho verde cultivado em sistemas
de produção orgânico e convencional. Revista Brasileira de
Milho e Sorgo, v. 7, p. 279-290, 2010.
REVILLA, P. et al. Genotypic effects on field performance
of maize plants carrying the allelesugary1.Plant Breeding,
v. 129, p. 92-95, 2010.
SA, K. J.et al. Analysis of genetic diversity and relationships
among waxy maize inbred lines in Korea using SSR markers.
Genes & Genomics, v. 32, p. 375-384, 2010.
SANTOS, P. H. A. D.et al. Agronomic performance of
super-sweet corn genotypes in the north of Rio de Janeiro. Crop
Breeding and Applied Biotechnology, v. 14, p. 8-14, 2014.
SINGH, I.; LANGYAN, S.; YADAVA, P. Sweet corn and corn-based sweeteners.Sugar Tech, v. 16, p. 144-149, 2014.
SOLOMON, K. F.; MARTIN, I.; ZEPPA, A. Genetic effects and genetic relationships amongshrunken (sh2) sweet corn lines and
F1 hybrids.Euphytica, v. 185, p. 385-394, 2012.
TEIXEIRA, F. F.et al.Avaliação da capacidade de combinação entre linhagens de milho doce. Ciência Agrotécnica, v. 25, p. 483-488, 2001.
TEIXEIRA, F. F. et al. BRS Vivi: single-cross super sweet
TRACY, W. F. Sweet corn.In: HALLAUER, A. R. (Ed.).Specialty
corns. 2. ed. Boca Raton: CRC Press, 2001. p. 155-197.
UNITED STATES DEPARTMENT OF AGRICULTURE. National Agricultural Statistics Service. Agricultural Annual
Statistics 2014: grain and feed. Disponível em: http://www.
nass.usda.gov/Publications/Ag_Statistics/2014/chapter01.pdf. Acesso em: 15 Agos. 2016.
VENCOVSKY, R.; BARRIGA, P. Genética biométrica no fitomelhoramento. Ribeirão Preto: Sociedade Brasileira de Genética, 1992, p. 486.
YOUSEF, G. G.; JUVIK, J. A. Enhancement of seedling emergence in sweet corn by marker-assisted backcrossing of beneficial QTL.Crop Science, v. 42, p. 96-104, 2002.