Identification of drought-tolerant corn
genotypes by multivariate analysis
1Ricardo Silva de Sousa2, Edson Alves Bastos3, Milton José Cardoso3, Diléia Rocha Pereira2
INTRODUCTION
Water deficit is one of the main limiting factors in agricultural systems, causing significant yield losses in corn crops. The identification of genotypes that are tolerant to limited water available in the soil may be considered one of the alternatives to increase the production in many regions of the world. Water stress affects the stability and yield performance of
ABSTRACT
RESUMO
crops and acts simultaneously in many characteristics that can lead to a low yield.
Phenotyping plays an increasingly important role in the selection of drought-resilient genotypes and is generally based on morphophysiological characteristics, including yield and its components (Tuberosa 2012). The selection must target genotypes whose yield rates are relatively high under water deficit conditions (Tardieu 2012), thus justifying
1. Manuscript received in Mar./2018 and accepted for publication in Jul./2018 (http://dx.doi.org/10.1590/1983-40632018v4852122). 2. Universidade Federal do Piauí, Teresina, PI, Brasil. E-mail/ORCID: [email protected]/0000-0002-0898-0774,
[email protected]/0000-0003-4757-6923.
3. Empresa Brasileira de Pesquisa Agropecuária (Embrapa Meio-Norte), Teresina, PI, Brasil. The identification of genotypes that are tolerant to
water deficit is crucial for the maintenance of the agricultural production. This study aimed to evaluate the genotypic variation for drought tolerance among corn genotypes by means of multivariate analysis, as well as to identify hybrids with high grain yield under conditions of water deficit and full irrigation. For this purpose, an experiment was conducted in a randomized block design, with 36 corn hybrids, being 34 experimental elite and two commercial (controls) hybrids, under water deficit and full irrigation, during the reproductive stage, with four replications. The irrigation levels, added to the rainfall, totaled 691.6 mm under full irrigation and 490.8 mm under water deficit. The evaluation encompassed the leaf area index, leaf chlorophyll content, interval between male and female flowering, number of rows per ear, number of grains per ear, ear length, 100-grain weight, ear yield, ear index, total number of grains, number of ears per m2, grain yield at 13 %
of moisture and water-use efficiency. The evaluated hybrids showed useful genetic diversity for drought tolerance. Four experimental elite hybrids (3G7395, 3G7415, 1G7034 and 3G7335) stood out under water deficit, showing a high grain yield performance, if compared to the average of the control hybrids.
KEYWORDS: Multivariate discrimination; water stress; chlorophyll; leaf area index.
Identificação de genótipos de milho para tolerância à seca por análise multivariada
Identificar genótipos tolerantes à deficiência hídrica é essencial na manutenção da produção agrícola. Objetivou-se avaliar a variação genotípica para tolerância à seca entre genótipos de milho, por meio de análise multivariada, bem como identificar híbridos com elevada produtividade de grãos em condições de déficit hídrico e irrigação plena. Utilizou-se delineamento de blocos casualizados, com 36 híbridos de milho, sendo 34 elites experimentais e dois comerciais (testemunhas), cultivados sob déficit hídrico e irrigação plena, durante a fase reprodutiva, com quatro repetições. As lâminas de irrigação, somadas à precipitação pluvial, totalizaram 691,6 mm e 490,8 mm, respectivamente sob irrigação plena e déficit hídrico. Foram avaliados o índice de área foliar, conteúdo de clorofila na folha, intervalo entre florescimento masculino e feminino, número de fileiras por espiga, número de grãos na espiga, comprimento de espiga, massa de 100 grãos, rendimento de espiga, índice de espiga, número de grãos, número de espigas por m2, produtividade de grãos
com 13 % de umidade e eficiência do uso da água. Identificou-se diversidade genética útil para tolerância à seca. Quatro híbridos elites experimentais (3G7395, 3G7415, 1G7034 e 3G7335) sobressaíram-se sob deficiência hídrica, com elevada produtividade de grãos, em relação à média dos híbridos testemunhas.
205 Identification of drought-tolerant corn genotypes by multivariate analysis
the need to determine the drought tolerance index of the evaluated genotypes. When the selection is performed under a controlled water condition and using the drought tolerance index, the germplasm can be identified based on effective yield, thus allowing the selection of high yield genotypes under water deficit and optimal water conditions (Mwadzingeni et al. 2016, Singh et al. 2016).
Several relevant characteristics may still be included in the selection of drought-tolerant genotypes, such as root depth and volume, leaf chlorophyll content, leaf water potential, leaf temperature, stay-green trait, leaf area index and plant growth analysis. These traits might be correlated with crop yield (Zheng et al. 2009, Ali et al. 2017). The interval between male and female flowering has also been suggested as a critical phenotypic characteristic of the flowering process, as it relates to the number of grains per ear and yield stability under stress (Araus et al. 2012).
However, the selection of superior genotypes is not an easy task, since the characteristics of importance, mostly of quantitative inheritance, are highly influenced by the environment and interrelated. Hence, the selection focused on one trait may cause a number of changes in others (Cruz 2006). Therefore, choosing a given characteristic over another may not be efficient for a breeding program. According to Tobar-Tosse et al. (2015), in order to obtain superior genotypes, it is necessary to evaluate a set of characteristics that combine the multiple information contained in the experimental unit.
Therefore, this study aimed to evaluate the drought-tolerant genotype variation among corn genotypes by means of multivariate analysis, as well as to identify hybrids with high grain yield performance under conditions of water deficit and full irrigation.
MATERIAL AND METHODS
The study was conducted using 36 corn hybrids, being 34 experimental elite and two commercial (control) hybrids, obtained from the Embrapa Milho e Sorgo. The elite and control hybrids were evaluated in the experimental field of the Embrapa Meio-Norte, in Teresina, Piauí state, Brazil (05º05’S, 42º48’W and 74.4 m of altitude), from September to December 2010. The regional
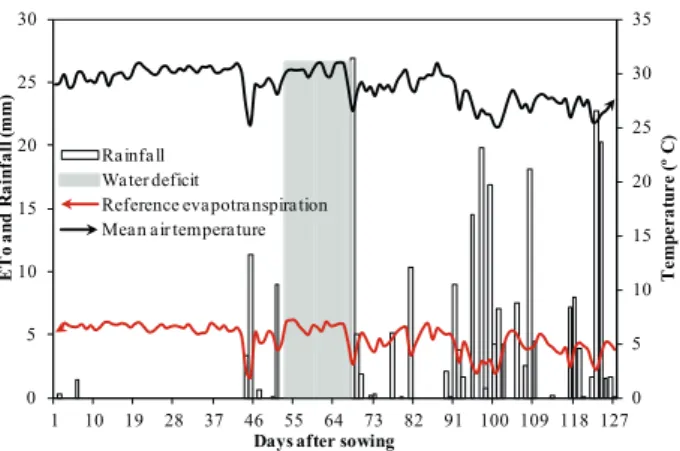
climate is tropical dry (as, according to the Köppen classification) and is characterized by two distinct seasons: a rainy summer and a dry winter, with average annual air temperature of 30 ºC and rainfall of 1,200 mm. The monthly average values for air temperature and reference evapotranspiration, during the experiment, were 29.3 ºC and 4.76 mm day-1,
respectively, and rainfall was 259.6 mm (Figure 1). The soil of the experimental area is a Dystrophic Yellow Argisol, with a sandy loam texture. The soil particle size analysis, which considered a 0.0-0.2 m depth layer, showed, on average, 764.5 g kg-1 of sand, 104.5 g kg-1 of silt
and 131 g kg-1 of clay. The field capacity value
(10 kPa) for the sampled layer was 21 %, while the permanent wilting point (1,500 kPa) was 9 % of the base volume, as determined in a Richards pressure chamber. The basal-dressing fertilization consisted of 40 kg ha-1 of N, 80 kg ha-1 of P
2O5 and 35 kg ha
-1
of K2O. The top-dressing fertilization was divided into two applications: the first upon the appearance of the sixth leaf, with 40 kg ha-1 of N and 35 kg ha-1
of K2O, and the second one upon the appearance of the eighth leaf, with 40 kg ha-1 of N.
The experimental area was irrigated with a conventional sprinkler irrigation system, at a 12 m x 12 m spacing and flow rate of 1.6 m3 h-1. The
applied irrigation levels, added to the rainfall levels, totaled 691.6 mm under full irrigation and 490.8 mm under water deficit. The irrigation management was performed based on the crop evapotranspiration (ETc), which was calculated using the crop coefficient (Kc) proposed by Andrade Júnior et al. (1998), and
Figure 1. Climatic data (rainfall, reference evapotranspiration - ETo and mean air temperature) and water deficit imposition period (stage VT to R2) throughout the phenological cycle of corn hybrids.
0 5 10 15 20 25 30 35 0 5 10 15 20 25 30
1 10 19 28 37 46 55 64 73 82 91 100 109 118 127
T e m p er a tu r e ( º C ) E T o a n d R a in fa ll ( m m )
Days after sowing
Rainfall Water deficit
by the Penman-Monteith method. Climatic data were obtained from a meteorological station of the Embrapa Meio-Norte, located approximately 1,000 m away from the experimental area.
Two experiments were carried out: one under water deficit and the other under full irrigation. The experiments used a randomized block design, with 4 replicates and 36 hybrids. The experimental plots were organized in 4-m rows, spaced 0.80 m apart, with 0.20 m between pits, totaling 144 plots, with a usable area of 3.2 m2 in each water regime (water
deficit and full irrigation). The soil water content was monitored daily using a DIVINER 2000®
capacitance probe in layers of 0.10-0.70 m depth, from 17 days after sowing (DAS) until the end of the crop cycle. In the water deficit experiment, irrigation was interrupted from the stages VT (bolting) to R2 (kernel blister), between 50 and 67 DAS, and water replenishment was performed when the soil moisture reached around 12 %, which equated to a fraction of soil water depletion of approximately 75 %, up to the field capacity.
At harvest time, the following phenotypic data were collected: ear length (cm), ear weight (g), number of rows per ear, number of grains per ear, 100-grain weight (g), number of grains per m2,
number of ears per m2, ear yield, ear index, plant
height (cm) and dry grain yield (t ha-1) adjusted to
13 % of moisture. The evaluation also considered the interval between male and female flowering, leaf area index (Petry et al. 2007), leaf chlorophyll content (Falker Automação Agrícola Ltda 2008) and water-use efficiency (Zhang et al. 2004).
A joint analysis of variance was carried out after a homogeneity test of the residual variances, and the hybrids were compared by the Scott-Knott test at a 0.05 significance level. In order to describe the magnitude of the relationships among the phenotypic characteristics, the Pearson’s correlation coefficient (r) was calculated separately under conditions of water deficit and full irrigation. A principal component analysis based on the correlation matrix of the original characteristics was conducted in order to identify the influential traits in the selection of hybrids. Biplots of the principal component analysis were plotted separately under conditions of water deficit and full irrigation to show the relationships among the hybrids in question, based on the characteristics evaluated. All analyses were
Team 2016).
In order to select hybrids of high grain yield performance under conditions of water deficit and full irrigation, the drought tolerance index (DTI) was calculated using the following equation (Fernández 1992): DTI = (YFI * YWD)/(XFI)2, where YFI is
the grain yield under full irrigation, YWD the grain
yield under water deficit and XFI the average yield
of hybrids under full irrigation.
RESULTS AND DISCUSSION
There is a clear variation of soil moisture between the two water regimes, during the imposed water deficit period (between 50 and 67 DAS) (Figure 2). Under full irrigation, the soil moisture remained between 18 % and 21 %, i.e, above the critical humidity, which is 15 % for this type of soil, and close to the field capacity (21 %). Therefore, it can be inferred that the water availability was adequate for the plants exposed to full irrigation. However, during the imposed water deficit period, the soil moisture remained below the critical humidity (15 %), evincing the water deficit to the plants. It should be noted that most of the 259.6 mm of rainfall occurred after the imposed water deficit period, thus not interfering with the drought tolerance evaluations.
Table 1 summarizes the results of the joint analysis of variance for the characteristics under study. For most of the characteristics, highly
Figure 2. Variation of soil moisture (%) at a depth of 0.40 m throughout the phenological cycle of corn hybrids submitted to water deficit (WD) and full irrigation (FI) conditions. The field capacity (FC) and permanent wilting point (PWP) are also represented.
25
35
45
55
65
75
7 9 11 13 15 17 19 21 23
D
ays
af
te
r
sow
in
g
Soil Moisture (%)
207 Identification of drought-tolerant corn genotypes by multivariate analysis
significant differences were observed among genotypes, water regimes and their interaction, except for the interval between male and female flowering, which was not significantly affected by the interaction between genotype and water regime.
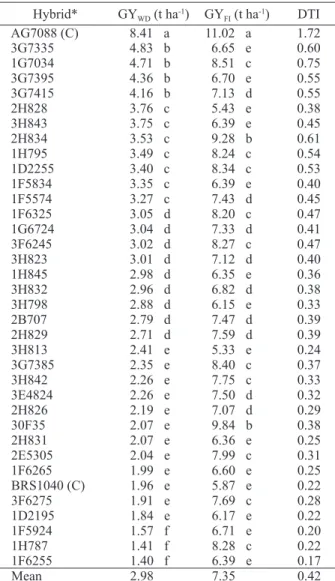
Table 2 shows the best hybrids, in terms of grain yield performance, under conditions of water deficit and full irrigation, as well as the highest value for drought tolerance index. Under water deficit, the following experimental elite hybrids stood out: 3G7395, 3G7415, 1G7034 and 3G7335, which yielded, respectively, 84.0 %, 80.15 %, 90.75 % and 93.06 %, in comparison with the average grain yield performance of commercial hybrids (control). Under full irrigation, the commercial hybrids 30F35 and 2H834 stood out, with grain yield performance above that of the average commercial hybrids. The maximum and minimum drought tolerance indices were 1.72 and 0.17, observed for the hybrids AG7088 and 1F6255, respectively. The average drought tolerance index was 0.42, being 33.33 % of the drought-tolerance hybrids above average.
The highly significant genotypic differences observed among all the studied characteristics indicate that the germplasm used in this study has a genetic diversity (Table 1). Therefore, within that group of germplasm, hybrids with high levels of drought tolerance were identified (i.e., 3G7395, 3G7415, 1G7034 and 3G7335), as indicated by the differential genotypic responses to the two water regimes.
The significant interactions observed in the present study suggest that the hybrids respond differently to the water deficit treatment. With the imposition of the water deficit, it was observed that
Table 2. Mean values of grain yield (GY) and drought tolerance index (DTI) for corn hybrids submitted to water deficit (WD) and full irrigation (FI), from stages VT to R2.
Hybrid* GYWD (t ha-1) GYFI (t ha-1) DTI
AG7088 (C) 8.41 a 11.02 a 1.72
3G7335 4.83 b 6.65 e 0.60
1G7034 4.71 b 8.51 c 0.75
3G7395 4.36 b 6.70 e 0.55
3G7415 4.16 b 7.13 d 0.55
2H828 3.76 c 5.43 e 0.38
3H843 3.75 c 6.39 e 0.45
2H834 3.53 c 9.28 b 0.61
1H795 3.49 c 8.24 c 0.54
1D2255 3.40 c 8.34 c 0.53
1F5834 3.35 c 6.39 e 0.40
1F5574 3.27 c 7.43 d 0.45
1F6325 3.05 d 8.20 c 0.47
1G6724 3.04 d 7.33 d 0.41
3F6245 3.02 d 8.27 c 0.47
3H823 3.01 d 7.12 d 0.40
1H845 2.98 d 6.35 e 0.36
3H832 2.96 d 6.82 d 0.38
3H798 2.88 d 6.15 e 0.33
2B707 2.79 d 7.47 d 0.39
2H829 2.71 d 7.59 d 0.39
3H813 2.41 e 5.33 e 0.24
3G7385 2.35 e 8.40 c 0.37
3H842 2.26 e 7.75 c 0.33
3E4824 2.26 e 7.50 d 0.32
2H826 2.19 e 7.07 d 0.29
30F35 2.07 e 9.84 b 0.38
2H831 2.07 e 6.36 e 0.25
2E5305 2.04 e 7.99 c 0.31
1F6265 1.99 e 6.60 e 0.25
BRS1040 (C) 1.96 e 5.87 e 0.22
3F6275 1.91 e 7.69 c 0.28
1D2195 1.84 e 6.17 e 0.22
1F5924 1.57 f 6.71 e 0.20
1H787 1.41 f 8.28 c 0.22
1F6255 1.40 f 6.39 e 0.17
Mean 2.98 7.35 0.42
GY: grain yield (kg ha-1); NRE: number of rows per ear; NGE: number of grains per ear; EL: ear length (cm); 100GW: 100-grain weight (g); EW: ear weight (g); EY: ear yield; EI: ear index; NGm2: number of grains per m2; NEm2: number of ears per m2; PH: plant height (cm); LAI: leaf area index; IMFF: interval between male and
female flowering; LCC: leaf chlorophyll content; WUE: water-use efficiency. * p < 0.05; ** p < 0.01; ns not significant.
Source of variation DF GY NRE NGE TraitsEL 100GW EW EY
Hybrid (H) 35 8,664,167** 0.19** 11.54** 4.70** 31.84** 2,609.35** 0.01** Environment (E) 1 1,378,624,320** 1.83** 857.83** 119.87** 226.09** 325,206.75** 0.37** H x E 35 3,747,939** 0.04** 5.28** 1.46** 15.74** 2,201.31** 0.37e-2**
Residue 210 390,509 0.02 1.99 0.62 2.62 147.66 0.99e-3
Source of variation EI NGm2 NEm2 PH LAI IMFF LCC WUE
Hybrid (H) 0.08** 141.85** 0.14** 0.10** 1.30** 0.81** 74.07** 3.29**
Environment (E) 7.07** 22,670.87** 13.86** 4.11** 99.32** 25.37** 18,508.91** 205.65**
H x E 0.04** 65.07** 0.10** 0.08** 0.68** 0.20ns 43.63* 1.40**
Residue 0.01 7.06 0.02 0.03 0.33 0.14 25.63 0.14
Table 1. Summary of the joint analysis of variance depicting the degrees of freedom (DF) and sum of squares for the phenotypic traits evaluated in 36 corn hybrids under water deficit and full irrigation.
grain yield. A smaller grain yield loss (50 %) was found by Teixeira et al. (2010), evaluating corn crop tolerance to water deficit. Such grain yield losses are due to the fact that water deficit causes the closure of the stomata to reduce transpiration, which, in turn, reduces the photosynthesis rate and, consequently, the translocation of photoassimilates to the corn ears.
A drought-tolerant genotype selection should also consider the responsiveness of the genotypes to irrigation, since there may be agricultural years with higher precipitation and, in those cases, these genotypes are expected to have a high grain yield performance in any situation. The maintenance of high grain yield in both conditions was observed the for hybrid AG7088, with average grain yield of 8.41 t ha-1 and 11.02 t ha-1, respectively under
conditions of water deficit and full irrigation. The same genotype showed a high drought tolerance index and can be selected as tolerant to water deficit (Singh et al. 2016).
Table 3 summarizes the correlation coefficients (r) and describes the degree of correlation between the measured phenotypic characteristics. Grain yield has a significant correlation with most of the characteristics present in both water regimes (water deficit and full irrigation), except for ear length, 100-grain weight, ear index, plant height, leaf area index and leaf chlorophyll content. Only the
significant and negative correlation with grain yield. Positive correlations among number of rows per ear, number of grains per ear, ear weight, ear yield, number of grains per m2, number of ears
per m2 and grain yield were expected, since they
are unstable production components. The positive correlation between water-use efficiency and grain yield indicates that the hybrids with the lowest water-use efficiency values water-used water less efficiently, resulting in lower grain yields, due to the low water availability. Higher water-use efficiency values are achieved under water deficit, when the stomata are partially closed, at which point the best relationship between CO2 uptake and H2O consumption occurs (Taiz & Zeiger 2004).
A negative correlation of grain yield with interval between male and female flowering is desirable. A reduced interval between male and female flowering indicates flowering timing, which translates into adaptation to stress and is associated with grain yield under adverse water conditions. At a high interval between male and female flowering, plants are often barren or have few grains per ear (Araus et al. 2012). A high interval between male and female flowering can be attributed to the genotype’s need to prioritize the formation of roots, or other vegetative parts of the plant, under stress conditions (Uga et al. 2013), in an attempt to increase
GY: grain yield (kg ha-1); NRE: number of rows per ear; NGE: number of grains per ear; EL: ear length (cm); 100GW: 100-grain weight (g); EW: ear weight (g); EY: ear yield; EI: ear index; NGm2: number of grains per m2; NEm2: number of ears per m2; PH: plant height (cm); LAI: leaf area index; IMFF: interval between male and
female flowering; LCC: leaf chlorophyll content; WUE: water-use efficiency. * p < 0.05; ** p < 0.01; ns not significant. Phenotypic
characteristics GY NRE NGE EL 100GW EW Full irrigation conditionEY EI NGm2 NEm2 PH LAI IMFF LCC WUE
W
ater deficit condition
GY 1 0.44** 0.45** -0.18ns -0.02ns 0.50** 0.68** 0.21ns 0.94** 0.60** 0.28ns 0.09ns -0.54** -0.23ns 0.99** NRE 0.63** 1 0.81** 0.10ns -0.33ns 0.44** 0.37* -0.24ns 0.50** -0.02ns 0.13ns -0.03ns -0.06ns -0.10ns 0.44** NGE 0.86** 0.73** 1 0.43** -0.17ns 0.46** 0.36* -0.28ns 0.47** 0.03ns 0.32ns -0.01ns -0.08ns -0.05ns 0.45** EL 0.02ns 0.05ns 0.14** 1 0.15ns -0.06ns -0.44** -0.14ns -0.24ns -0.04ns 0.03ns -0.13ns 0.24ns 0.16ns -0.18ns 100GW 0.18ns -0.01ns -0.06ns -0.17ns 1 0.16ns -0.23ns -0.24ns -0.32ns -0.11ns -0.03ns -0.10ns 0.29ns -0.06ns -0.02ns EW 0.84** 0.46** 0.81** -0.01ns 0.14ns 1 0.24ns -0.53** 0.42* -0.36* 0.13ns 0.20ns -0.11ns -0.04ns 0.50** EY 0.72** 0.25* 0.67* -0.05** 0.13ns 0.69ns 1 0.14ns 0.73** 0.40* 0.41* 0.12ns -0.57** -0.14ns 0.68** EI 0.57ns 0.41ns 0.38ns -0.06ns 0.07ns 0.24** 0.27ns 1 0.26ns 0.70** 0.00ns 0.13ns -0.23ns -0.08ns 0.21ns NGm2 0.98** 0.66** 0.90** 0.06ns -0.02ns 0.83* 0.71** 0.55ns 1 0.60** 0.24ns 0.12ns -0.64** -0.24ns 0.94** NEm2 0.67** 0.48ns 0.46ns 0.18ns 0.11ns 0.22* 0.32* 0.77** 0.65** 1 0.13ns -0.09ns -0.44** -0.21ns 0.60** PH 0.19ns 0.31ns 0.32ns 0.08ns -0.15ns 0.08ns 0.02ns 0.04ns 0.22ns 0.22ns 1 -0.01ns -0.10ns 0.00ns 0.28ns LAI 0.53ns 0.42ns 0.41ns -0.25ns 0.04ns 0.33ns 0.27ns 0.45ns 0.52ns 0.42ns 0.10ns 1 -0.12ns 0.20ns 0.09ns IMFF -0.60** -0.40ns -0.53ns -0.11ns -0.25ns -0.47ns -0.62** -0.37ns -0.55** -0.45** 0.01ns -0.41ns 1 0.07ns -0.54** LCC 0.19ns 0.23ns 0.19ns -0.06ns 0.12ns 0.18ns 0.06ns 0.09ns 0.18ns 0.00ns 0.10ns 0.63ns -0.24ns 1 -0.23ns WUE 0.99** 0.63** 0.86** 0.02ns 0.18ns 0.84** 0.72** 0.57ns 0.98** 0.67** 0.19ns 0.53ns -0.60** 0.19ns 1
209 Identification of drought-tolerant corn genotypes by multivariate analysis
or maintain photosynthesis. Results obtained by Zaidi et al. (2008) indicated that an interval between male and female flowering of less than five days can identify tolerant genotypes under stress conditions, either due to water deficit or excess. In this context, the selection would be targeted at a reduced or even negative interval between male and female flowering.
The non-significant correlations of ear length, ear index and plant height with grain yield may be explained by the fact that these characteristics do not directly influence grain yield in isolation, but only when combined with the other characteristics. Non-significant correlations of leaf area index and leaf chlorophyll content with grain yield may be related to the existence of great genetic variability in the different hybrids studied. However, significant correlations with grain yield imply a direct contribution to yield performance and should be considered as an important trait during the genotype selection (Mwadzingeni et al. 2016).
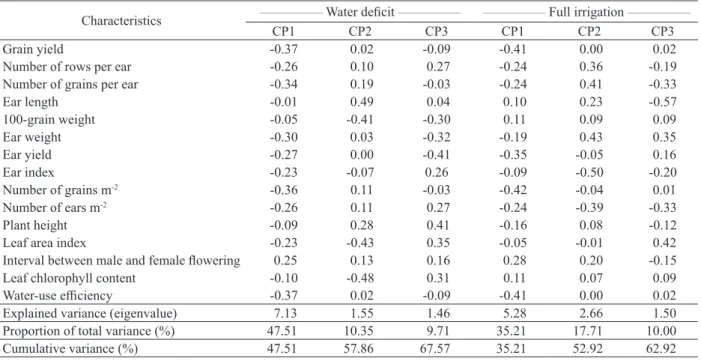
In order to investigate influential traits in the selection of hybrids, a principal component analysis was performed. The matrix of eigenvectors (Table 4) shows the proportion of the total variance explained by the different principal components and their correlations with the analyzed characteristics. Under water deficit, the first three principal components
(CP1, CP2 and CP3) explained 62.57 % of the total variation observed. However, the first two principal components were the most influential ones, with a cumulative contribution to the total variation of 57.86 %. The loadings showing an absolute value higher than 0.25 were considered relevant. Thus, the characteristics grain yield, number of rows per ear, number of grains per ear, ear weight, ear yield, number of grains per m2, number of ears per m2 and
water-use efficiency had high negative loadings in the first principal component. These were followed by 100-grain weight, leaf area index and leaf chlorophyll content, which showed high negative loadings in the second principal component. Only the interval between male and female flowering presented a positive loading in the first component, while ear length and plant height showed a positive loading in the second principal component. Likewise, the three principal components were important under full irrigation conditions, representing 62.92 % of the total variation, of which 52.92 % were accounted for by the first two components.
The characteristics grain yield, ear yield, number of grains per m2 and water-use efficiency
presented a high negative loading in the first principal component, while the ear index and number of ears per m2 showed a high negative loading in the second
principal component. Again, the interval between
Characteristics ________________ Water deficit ________________ ________________ Full irrigation ________________
CP1 CP2 CP3 CP1 CP2 CP3
Grain yield -0.37 0.02 -0.09 -0.41 0.00 0.02
Number of rows per ear -0.26 0.10 0.27 -0.24 0.36 -0.19
Number of grains per ear -0.34 0.19 -0.03 -0.24 0.41 -0.33
Ear length -0.01 0.49 0.04 0.10 0.23 -0.57
100-grain weight -0.05 -0.41 -0.30 0.11 0.09 0.09
Ear weight -0.30 0.03 -0.32 -0.19 0.43 0.35
Ear yield -0.27 0.00 -0.41 -0.35 -0.05 0.16
Ear index -0.23 -0.07 0.26 -0.09 -0.50 -0.20
Number of grains m-2 -0.36 0.11 -0.03 -0.42 -0.04 0.01
Number of ears m-2 -0.26 0.11 0.27 -0.24 -0.39 -0.33
Plant height -0.09 0.28 0.41 -0.16 0.08 -0.12
Leaf area index -0.23 -0.43 0.35 -0.05 -0.01 0.42
Interval between male and female flowering 0.25 0.13 0.16 0.28 0.20 -0.15
Leaf chlorophyll content -0.10 -0.48 0.31 0.11 0.07 0.09
Water-use efficiency -0.37 0.02 -0.09 -0.41 0.00 0.02
Explained variance (eigenvalue) 7.13 1.55 1.46 5.28 2.66 1.50
Proportion of total variance (%) 47.51 10.35 9.71 35.21 17.71 10.00
Cumulative variance (%) 47.51 57.86 67.57 35.21 52.92 62.92
loading in the first principal component, followed by the number of rows per ear, number of grains per ear and ear weight, with a positive loading in the second component.
The analysis of each principal component allowed observing that the characteristics with eigenvectors of the same sign (Table 4) act in a direct way, i.e., when the value of one increases, the value of the other also increases, and those with opposite signs are negatively correlated (Tobar-Tosse et al. 2015). Thus, the interval between male and female flowering acts directly and inversely to grain yield, in both water regimes.
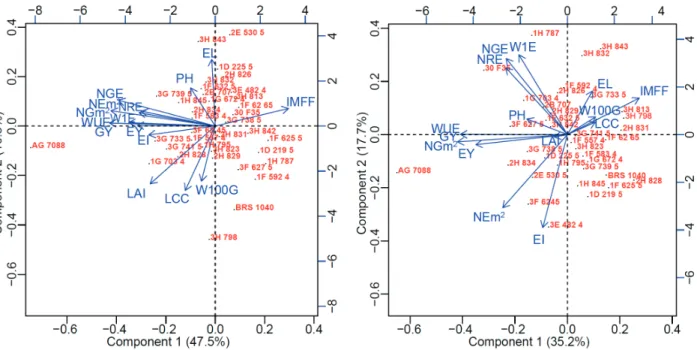
The relationships among the different characteristics and the hybrids with the first two principal components are further illustrated by the PCA biplots in Figures 3 and 4, respectively for water deficit and full irrigation. The hybrids that stood out in a specific characteristic were plotted closer to the line and to the vector direction of that given characteristic. Under water deficit, few hybrids were plotted on the left side of the first principal component. There was also a high positive correlation between grain yield, number of rows per ear, number of grains per ear, ear weight, ear yield, number of grains per m2, number
of ears per m2 and water-use efficiency, as well as a
and female flowering (Figure 3).
Similarly, under full irrigation conditions, the hybrids were also less concentrated on the left side of the first principal component. In this case, there was a positive correlation only among grain yield, ear yield, number of grains per m2 and water-use efficiency, and
a negative one with the interval between male and female flowering (Figure 4). Thus, it was observed that the hybrid AG7088 showed a high grain yield performance in both water regimes, justified by the influence of the production components and reduced interval between male and female flowering.
The principal component analysis indicated that, under water deficit, the grain yield, number of rows per ear, number of grains per ear, ear weight, ear yield, number of grains per m2, number of ears per m2,
water-use efficiency and interval between male and female flowering influence the selection of hybrids and may be jointly considered (Table 4; Figure 3). Under full irrigation conditions, the high loading of grain yield, ear yield, number of grains per m2,
water-use efficiency and interval between male and female flowering in the first principal component indicate that these characteristics have a great influence and may be considered simultaneously, in view of their influence over each other (Table 4; Figure 4).
Figure 3. PCA biplot for the water deficit condition. The first and second principal components are in the x- and y-axis, respectively.
CONCLUSIONS
1. The evaluated hybrids showed a useful genetic diversity, in terms of drought tolerance;
2. The 3G7395, 3G7415, 1G7034 and 3G7335 experimental elite hybrids stood out when submitted to water deficit, for their high grain yield performance, in relation to the average performance of the commercial hybrids (controls); 3. The AG7088 control hybrid showed a high grain yield performance under water deficit and full irrigation.
REFERENCES
ALI, F. et al. Phenotypic stability of Zea mays grain yield
and its attributing traits under drought stress. Frontiers in Plant Science, v. 8, n. 1, p. 1-11, 2017.
ANDRADE JÚNIOR, A. S. et al. Irrigação. In: CARDOSO, M. J. (Org.). A cultura do milho no Piauí. 2. ed. Teresina:
Embrapa Meio-Norte, 1998, p. 68-100.
ARAUS, J. L. et al. Phenotyping corn for adaptation to drought. Frontiers in Physiology, v. 3, n. 1, p. 1-20, 2012.
CRUZ, C. D. Genes: biometria. Viçosa: Ed. da UFV, 2006.
FALKER AUTOMAÇÃO AGRÍCOLA LTDA. Medidor
eletrônico do teor de clorofila ClorofiLOG 1030: manual de instruções. Porto Alegre: FAA, 2008.
FERNÁNDEZ, G. C. J. Effective selection criteria for assessing stress tolerance. In: INTERNATIONAL SYMPOSIUM ON ADAPTATION OF VEGETABLES AND OTHER FOOD CROPS IN TEMPERATURE AND
WATER STRESS, 6., 1992, Shanhua. Proceedings…
Shanhua: Asian Vegetable Research and Development Center, 1992. p. 257-270.
MWADZINGENI, L. et al. Screening of bread wheat genotypes for drought tolerance using phenotypic and proline analyses. Frontiers in Plant Science, v. 7, n. 1,
p. 1-12, 2016.
PETRY, M. T. et al. Disponibilidade de água do solo ao milho cultivado sob sistemas de semeadura direta e preparo convencional. Revista Brasileira de Ciência do Solo, v. 31,
n. 3, p. 53-539, 2007.
R CORE TEAM. R: a language and environment for
statistical computing. Vienna: R Foundation for Statistical Computing, 2016.
SINGH, C. et al. Response of upland cotton (G. hirsutum
L.) genotypes to drought stress using drought tolerance indices. Journal of Crop Science and Biotechnology, v. 19,
n. 1, p. 53-59, 2016.
TAIZ, L.; ZEIGER, E. Fisiologia vegetal. 3. ed. Porto
Alegre: Artmed, 2004.
TARDIEU, F. Any trait or trait-related allele can confer drought tolerance: just design the right drought scenario.
Journal of Experimental Botany, v. 63, n. 1, p. 25-31, 2012.
TEIXEIRA, F. F. et al. Evaluation of corn core collection
for drought tolerance. Crop Breeding and Applied
Biotechnology, v. 10, n. 4, p. 312-320, 2010.
TOBAR-TOSSE, D. E. et al. Caracterização de genótipos de soja-hortaliça por análise de componentes principais.
Ciência Rural, v. 45, n. 7, p. 1214-1219, 2015.
TUBEROSA, R. Phenotyping for drought tolerance of crops in the genomics era. Frontiers in Physiology, v. 3,
n. 1, p. 1-26, 2012.
UGA, Y. et al. Control of root system architecture by DEEPER ROOTING 1 increases rice yield under drought conditions. Nature Genetics, v. 45, n. 9, p. 1097-1102,
2013.
ZAIDI, P. H. et al. Relationship between drought and excess moisture tolerance in tropical corn (Zea mays L.). Australian Journal of Crop Science, v. 1, n. 3, p. 78-96,
2008.
ZHANG, Y. et al. Effect of soil water deficit on evapotranspiration, crop yield, and water use efficiency in the North China Plain. Agricultural Water Management,
v. 64, n. 2, p. 107-122, 2004.
ZHENG, H. J. et al. QTL mapping of corn (Zea mays)