ABSTRACT
RESUMO
Adubação nitrogenada para o milho em dois sistemas de rotação de culturas sob plantio direto
Com o objetivo de avaliar o parcelamento de doses de nitrogênio (N), aplicadas na semeadura e em cobertura do milho, com e sem rotação de culturas, em semeadura direta, foi realizado um experimento com seis doses de N na semeadura (0, 20, 30, 40, 50 e 60 kg ha-1), combinadas com três doses em cobertura (40, 70, 100 kg ha-1) e dois sistemas de manejo: após cinco cultivos de milho e com rotação de culturas (milho+soja+aveia+soja+milho), em delineamento de blocos casualizados, com quatro repetições. O sistema de rotação de culturas proporcionou incremento de aproxima-damente 7%, no rendimento de grãos, em relação ao da área sem rotação. O parcelamento da adubação nitrogenada, com doses acima de 39 e 54 kg ha-1, na semeadura, com 70 e 40 kg ha-1, em cobertura, respectivamente, resultou em produtividade superior à obtida com aplicação de 100 kg ha-1, em cobertura. O rendimento de grãos foi maior com o parcelamento da dose de 50 e 70 kg ha-1 de N, na semeadura e cobertura, em comparação com o obtido com o parcelamento de 20 e 100 kg ha-1, na semeadura e cobertura, respectivamente. A dose de 70 kg ha-1 de N em cobertura apresentou maior produtividade de grãos com menor custo, em comparação com os rendimentos e custos verificados em relação às doses de 40 e 100 kg ha-1.
Palavras-chave: fertilização, manejo do solo, Zea mays L., produtividade.
Received: 27/03/2013; Accepted: 28/05/2013.
1Second author’s course completion assignment for the obtaining of the title of Graduate in Agronomy Engineering at the Universidade Estadual do Oeste do Paraná - UNIOESTE. 2Agronomist Engineer, Doctor of Science. Departamento de Agrárias, Universidade Estadual do Oeste do Paraná, Rua Pernambuco, 1777, Caixa Postal 91, 85960-000, Marechal
Cândido Rondon, Paraná, Brasil. [email protected] (corresponding author).
3Agronomist Engineer, Master of Science. Departamento de Agricultura, Escola Superior de Agricultura “Luiz de Queiroz”, Universidade de São Paulo, 13418-900, Piracicaba,
São Paulo, Brasil. [email protected]
4Agronomist Engineer, Master of Science. Departamento de Agrárias, Universidade Estadual do Oeste do Paraná, Rua Pernambuco, 1777, Caixa Postal 91, 85960-000, Marechal
Cândido Rondon, Paraná, Brasil. [email protected]
5Agronomist Engineer, Doctor of Science. Departamento de Agrárias, Universidade Estadual do Oeste do Paraná, Rua Pernambuco, 1777, Caixa Postal 91, 85960-000, Marechal
Cândido Rondon, Paraná, Brasil. [email protected]
Maria do Carmo Lana2, Rodrigo Vianei Czycza3, Jean Sérgio Rosset4, Jucenei Fernando Frandoloso5
Maize nitrogen fertilization in two crop rotation systems under no-till
1The objective of this study was to evaluate split nitrogen (N) fertilization of maize applied in band at sowing and top dressing with and without crop rotation, under no-till. The experiment was conducted with six N rates at sowing (0, 20, 30, 40, 50 and 60 kg ha-1) combined with three rates in top dressing (40, 70, 100 kg ha-1) and two management systems: after five cropping sequences of maize and crop rotation (maize + soybean + oat + soybean + corn) in a randomized block design with four replications. The crop rotation system increased yield in approximately 7% in relation to the area without rotation. The split of nitrogen fertilization, in rates above 39 and 54 kg ha-1 at sowing and 70 and 40 kg ha-1 in top dressing, resulted in yield higher than that obtained with the application of 100 kg ha-1 in top dressing. Grain yield was higher with the rates 50 and 70 kg ha-1 of N compared with that obtained with 20 and 100 kg ha-1 at sowing and top dressing, respectively. The rate 70 kg ha-1 of N resulted in the highest yield at the lowest cost compared with the revenues and costs incurred with the rates 40 and 100 kg ha-1.
853
Maize nitrogen fertilization in two crop rotation systems under no-till
Rev. Ceres, Viçosa, v. 60, n.6, p. 852-862, nov/dez, 2013
INTRODUCTION
Maize (Zea mays L.) is one of the main cereal crops grown in Brazil and worldwide (CONAB, 2012). The world maize production reached 905 million tons and is destined mainly for animal feed and ethanol production. In the United States of America (US), the annual production reaches 336 million tons (USDA, 2012), while Brazil produces about 68 million tons (CONAB, 2012).
In the 2011/2012 crop year, the mean grain yield of the maize crop in Brazil was around 4400 kg ha-1 (CONAB, 2012), which is considered low when compared with the US yield of 9240 kg ha-1 (USDA, 2012). Among the factors accounting for the high yield of the maize crop in the US is the expressive use of nitrogen fertilizers. The Brazilian low yield is related to soil fertility, climatic conditions (Chioderoli et al., 2012) and insufficient nitrogen (N) fertilization (Silva et al., 2006). Therefore, the rational and balanced use of fertilizers, which represent a large part of the crop establishment costs, has been gaining an increasing importance for financial gain (Amado et al., 2002).
The split and time of nitrogen application are alternatives to increase the efficiency of fertilizers and minimize losses, allowing for synchronization between the applications and the period of high nutrient demand (Yamada et al., 2006). Other factors that influence the recommended rate and split of fertilization are the chemical attributes, such as the content of soil organic matter (SOM) and the weather, primarily the rainfall (Chioderoli et al., 2012).
High yields were recorded for rainfed maize fertilized with 50-90 kg ha-1 N and irrigated maize fertilized with 120-150 kg ha-1 (Souza et al., 2003), reaching yields above 150 kg ha-1 (Amado et al., 2002), also with good response in association with brachiaria (Costa et al., 2012).
The no-till (NT) system with crop rotation has provided maize yields higher than other cropping systems. In this system, there is an increased amount of potentially mineralizable nitrogen (PMN) in the soil, because of the residues remaining on the ground (Silva et al., 2005), especially in areas where the use of this system is already consolidated (Gomes et al., 2007). However, this will depend on the degree of SOM decomposition, the time of NT adoption (adoption phase, transition, consolidation or of maintenance) (Anghinoni, 2007) and quality of straw decomposition (Cabezas et al., 2005).
The contribution of cover crops to N supply and the crop rotation of maize plus soybean are important practices that contribute to the increase of N content in the soil (Jantalia et al., 2006). Cover crops can meet the demands for N of maize by using rotation with legume crops. However, when using species with high C/N ratio, such as grasses, cereal yield can be reduced if there is insufficient N complementation, via fertilization (Lara-Cabezas et al., 2004).
For these reasons, in order to evaluate nitrogen management, this study evaluated the split N fertilization and the influence of the crop rotation system on agronomic characteristics, grain yield and N, P and K contents in the leaf tissue of maize.
MATERIAL AND METHODS
The field experiment was conducted in no-till system, in place for six years (transition phase), in the municipality of Marechal Cândido Rondon, western Paraná, with geographic coordinates 24º 42' S and 54º 14', approximately 220 m altitude, average annual rainfall of 1642 mm, average temperature of 21.3 ºC and average relative humidity of 76.1% (IAPAR, 2011). The soil of the experimental area is classified as typical Eutroferric Red Latosol (LVef) (Embrapa, 2006b).
Before the implementation of the experiment, soil samples at 0-0.2 m were collected for determination of chemical and particle size analyses, at the sites 1 and 2 respectively. The results of the soil analyses were: pH CaCl2 = 5.5 and 5.2, MO = 29.4 and 29.4 g dm-3; P = 7.6 and 5.12 mg dm-3; H + Al: 34 and 50 mmolc dm-3; Al3+: 0 and 0.1 mmol
c dm-3; K+ = 6.0 and 3.3 mmolc dm-3; Ca2+ = 42.2 and 41.8 mmol
c dm-3; Mg2+ = 15.5 and 13.8 mmolc dm-3; SB = 64 and 59 mmol
c dm-3; CTC = 98 and 108 mmolc dm-3; V = 64.8 and 54.3%; and sand, silt and clay 110 , 120 and 770 g dm-3, respectively.
The experiment consisted of 36 treatments arranged in a 6 x 3 x 2 factorial randomized block design, with four replications. We evaluated the combination of six N rates (0, 20, 30, 40, 50 and 60 ha-1) at sowing, three N rates (40, 70 and 100 kg ha-1) in topdressing and two rotation systems in no-till. The rotation system at Site 1 consisted of five cropping sequences of maize and, at Site 2, of crop rotation (corn + soybean + oats + soybean + corn), totaling 144 experimental units. Before the establishment of the experiment, soil acidity was corrected by lime (TNP – total neutralizing power – 85%) distribution on the surface of the two sites, without incorporation, to increase the saturation to 70%.
The experiment was conducted in the crop year 2006/ 2007 using maize seeds of the single early hybrid Dow AgroSciences 2B710. Furrows were opened for N fertilizer placement at sowing. Phosphorus (P) and potassium (K) fertilization rates were 75 and 50 kg ha-1 of P2O5 and K2O, respectively, in both sites using triple superphosphate (44% P2O5) and potassium chloride (60% K2O).
The following variables were evaluated: grain yield, 1000-grain mass, N content in the grain, N, P and K in leaf tissue, plant height, height of ear insertion, stem diameter, row number per ear, grain number per row, grain number per ear, ear length and relative price between product (grain) and fertilizer. To obtain this ratio, we used the maize closing price on the Chicago Board of Trade (CBOT) of March 2013 for the region, which was R$ 24.50 per 60-kg bag (CBOT, 2013), and R$ 1.18 per kg of N for urea. The ratio was calculated using the following equation: RPR = [(PT x R$ kg) / (kg N x R$ kg urea-N)], where: RPR = relative price in Real; PT = treatment production (kg); R$kg = Real kg-1 maize; kg urea-N = N amount used (kg); R$ kg N-urea = Real kg-1 N-urea. The increase in production of each treatment was calculated considering the production obtained with the lowest N rate, as follows: {[production per treatment / production obtained with the lowest N rate] x 100}.
Analysis of variance and regression analysis were performed using the software SAEG 8.0 (SAEG, 1999). Treatments with the same N rate were compared by contrasts using the Bonferroni test, at 1 and 5% significance.
RESULTS AND DISCUSSION
Maize yield was significantly different between the sites with a positive interaction between N band fertilization at sowing and topdressing (Table 1). The area with crop rotation (Site 2) had higher mean yield, greater ear length and higher 1000-grain mass than the area with successive maize (Site 1). There was significant effect of N fertilization at sowing for almost all variables, except for height of ear insertion and row number per ear.
The interaction between N rate at sowing and N rate in topdressing (with 40 and 70 kg ha-1 N) showed an increase in yield of 24.82 and 26.76 kg ha-1 grain, respectively, for each kg of N applied at planting (Figure 1a). The rates 40 and 70 kg ha-1 in topdressing with N at sowing above 54 and 39 kg ha-1, respectively, resulted in production larger than the mean production obtained with 100 kg ha-1 in topdressing, which was 8864 kg ha-1 (Figure 1a).
The increase in production with the use of higher N rates at sowing, in comparison with those commonly used (20 to 30 kg N ha-1), indicate less need for N in topdressing, allowing high yields (Embrapa , 2006a). However, care must be taken with N rates above 60 kg ha-1 at sowing, which may favor salinity and/or alkalinization of the rhizosphere, damaging the plant root system and reducing the rate of nutrient absorption (Fancelli & Dourado Neto, 2004).
There were differences between N rates at sowing for plant height, but not for height of ear insertion, for any of the rates evaluated at sowing and topdressing (Table 1). Lana et al. (2009) observed increased plant height and
height of ear insertion, 2.1cm and 1.8 cm, respectively, per 30 kg of N added.
Figure 1b shows the mean yield of the two sites, with total rates of N, independent of the application form. It was possible to fit a quadratic equation with the maximum point of 132.4 kg N ha-1 and grain yield of 9038 kg ha-1, which was also reported by Gomes et al. (2007), with a maximum point of 151 kg ha-1 N.
This total N rate is lower than that recommended by Embrapa (2006a), which for an expected yield above 8000 kg ha-1, recommends 20 to 30 kg ha-1 at sowing and 140 kg ha-1 in topdressing. This may be explained by the significant amount of crop residues in both areas, which may be releasing N through SOM mineralization, especially in the system of rotation with soybean. Araújo et al. (2004) have also reported linear responses of increased yield as a function of maize nitrogen fertilization in an Oxisol and Costa et al. (2012) in an intercropping with brachiaria.
For most N rates evaluated, with exception of the treatments 40 kg ha-1 N at sowing and 100 kg ha-1 N in topdressing, the site with crop rotation had higher yields than the site with successive maize crops. The differences between the systems ranged from 38 kg ha-1 to 1468 kg ha-1 of grain produced in the treatments with 50 kg ha-1 N at sowing and 70 kg ha-1 N in topdressing and 60 kg ha-1 N at sowing and 70 kg ha-1 N in topdressing, respectively (Table 2).
The importance of the N fertilization at sowing for corn yield is confirmed when comparing the results of the application of 30 kg N ha-1 at sowing plus 40 kg ha-1 N in topdressing with the application of 70 kg N ha-1 only in topdressing (Table 2). In this case, there is an increase in yield of 590 and 428 kg ha-1 for the sites 1 and 2, respectively. The same happens with the rates 50-70 kg ha-1 compared with 20-100 kg N ha-1, and 50-40 kg ha-1 compared with 20-70 kg ha-1 N at sowing and in topdressing, respectively. These results may be due to the greater efficiency of N utilization, with small losses by volatilization compared to losses with surface applications at higher rates (Yamada et al., 2006).
855
Maize nitrogen fertilization in two crop rotation systems under no-till
Rev
. Ceres,
V
içosa, v
. 60, n.6, p. 852-862, nov/dez, 2013
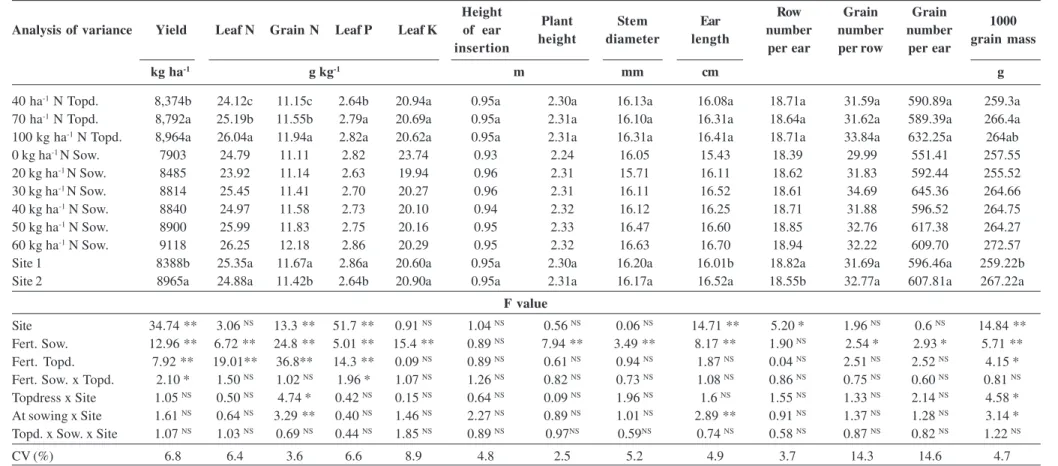
Table 1. Summary of analysis of variance and mean comparisons for yield, N content in leaf and grain, leaf P, leaf K, height of ear insertion, plant height, stem diameter, ear length, row number per ear, grain number per row, grain number per ear and 1000 grain mass in response to nitrogen fertilization at sowing and topdressing in two sites
Analysis of variance Yield Leaf N Grain N Leaf P Leaf K 1000
grain mass Height
of ear insertion
Plant height
Stem diameter
Ear length
Row number per ear
Grain number per row
Grain number
per ear
g
kg ha-1 g kg-1 m mm cm
40 ha-1 N Topd. 8,374b 24.12c 11.15c 2.64b 20.94a 0.95a 2.30a 16.13a 16.08a 18.71a 31.59a 590.89a 259.3a
70 ha-1 N Topd. 8,792a 25.19b 11.55b 2.79a 20.69a 0.95a 2.31a 16.10a 16.31a 18.64a 31.62a 589.39a 266.4a
100 kg ha-1 N Topd. 8,964a 26.04a 11.94a 2.82a 20.62a 0.95a 2.31a 16.31a 16.41a 18.71a 33.84a 632.25a 264ab
0 kg ha-1 N Sow. 7903 24.79 11.11 2.82 23.74 0.93 2.24 16.05 15.43 18.39 29.99 551.41 257.55
20 kg ha-1 N Sow. 8485 23.92 11.14 2.63 19.94 0.96 2.31 15.71 16.11 18.62 31.83 592.44 255.52
30 kg ha-1 N Sow. 8814 25.45 11.41 2.70 20.27 0.96 2.31 16.11 16.52 18.61 34.69 645.36 264.66
40 kg ha-1 N Sow. 8840 24.97 11.58 2.73 20.10 0.94 2.32 16.12 16.25 18.71 31.88 596.52 264.75
50 kg ha-1 N Sow. 8900 25.99 11.83 2.75 20.16 0.95 2.33 16.47 16.60 18.85 32.76 617.38 264.27
60 kg ha-1 N Sow. 9118 26.25 12.18 2.86 20.29 0.95 2.32 16.63 16.70 18.94 32.22 609.70 272.57
Site 1 8388b 25.35a 11.67a 2.86a 20.60a 0.95a 2.30a 16.20a 16.01b 18.82a 31.69a 596.46a 259.22b
Site 2 8965a 24.88a 11.42b 2.64b 20.90a 0.95a 2.31a 16.17a 16.52a 18.55b 32.77a 607.81a 267.22a
F value
Site 34.74 ** 3.06 NS 13.3 ** 51.7 ** 0.91 NS 1.04 NS 0.56 NS 0.06 NS 14.71 ** 5.20 * 1.96 NS 0.6 NS 14.84 **
Fert. Sow. 12.96 ** 6.72 ** 24.8 ** 5.01 ** 15.4 ** 0.89 NS 7.94 ** 3.49 ** 8.17 ** 1.90 NS 2.54 * 2.93 * 5.71 **
Fert. Topd. 7.92 ** 19.01** 36.8** 14.3 ** 0.09 NS 0.89 NS 0.61 NS 0.94 NS 1.87 NS 0.04 NS 2.51 NS 2.52 NS 4.15 *
Fert. Sow. x Topd. 2.10 * 1.50 NS 1.02 NS 1.96 * 1.07 NS 1.26 NS 0.82 NS 0.73 NS 1.08 NS 0.86 NS 0.75 NS 0.60 NS 0.81 NS
Topdress x Site 1.05 NS 0.50 NS 4.74 * 0.42 NS 0.15 NS 0.64 NS 0.09 NS 1.96 NS 1.6 NS 1.55 NS 1.33 NS 2.14 NS 4.58 *
At sowing x Site 1.61 NS 0.64 NS 3.29 ** 0.40 NS 1.46 NS 2.27 NS 0.89 NS 1.01 NS 2.89 ** 0.91 NS 1.37 NS 1.28 NS 3.14 *
Topd. x Sow. x Site 1.07 NS 1.03 NS 0.69 NS 0.44 NS 1.85 NS 0.89 NS 0.97NS 0.59NS 0.74 NS 0.58 NS 0.87 NS 0.82 NS 1.22 NS
CV (%) 6.8 6.4 3.6 6.6 8.9 4.8 2.5 5.2 4.9 3.7 14.3 14.6 4.7
Means followed by the same letters in the columns are not significantly different by the Tukey test at 5% probability level; NS: not significant, * significant at 5%, ** significant at 1% probability level
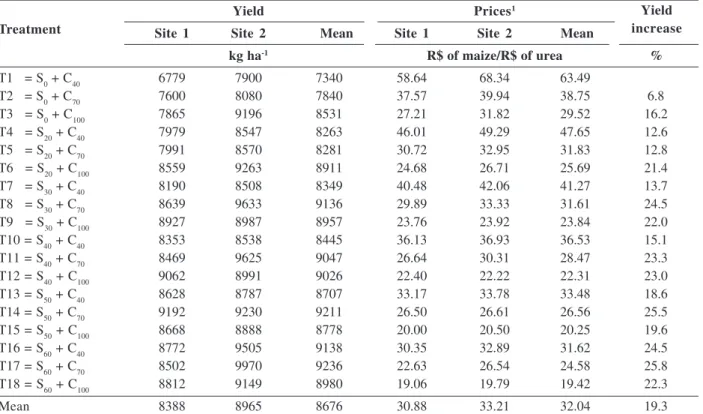
The mean yield of Site 2 was 577 kg ha-1 higher than the mean yield of Site 1, i.e., increasing from 8388 kg ha-1 to 8965 kg ha-1 grain (Table 2). There were yield increases in relation to the lowest N rate, ranging from 6.8% for the treatment 0 kg ha-1 at sowing and 70 kg ha-1 in topdressing to 25.8% for the treatment 60 kg ha-1 at sowing and 70 kg ha-1 in topdressing. Similar increases in production were also reported by Araújo et al. (2004) in monoculture systems (maize+ maize + maize and maize + soybean + maize).
The economic analysis also has shown that grain yield per kilogram of applied N was satisfactory, providing a good return on capital invested in the form of nitrogen fertilizer. Investment in nitrogen fertilizer was positive for all treatments, with average return of R$ 30.88 and R$ 33.21 for every R$ 1.00 invested in nitrogen fertilizer, for sites 1 and 2, respectively, representing an average gain of R$ 32.04 in grains per Real of N invested (Table 2). The rate 70 kg ha-1 in topdressing combined with 30 and 50 kg ha-1 at
sowing also provided larger increases in production. Farinelli & Lemos (2012) reported that the nitrogen fertilization provided significant increases in agronomic and nutritional traits of maize, with the maximum grain yield obtained with 151 kg ha-1 N.
Table 3 shows the comparisons between the rates of N in topdressing (C1, C2 and C3) and comparisons involving the split of nitrogen fertilization at the rates 70 (C4), 90 (C5), 100 (C6, C7 and C8), 120 (C9) and 130 (C10) ha-1 of total applied N. Maize yield was higher for the topdressing N rates 70 and 100 kg ha-1 N than the yield obtained with 40 kg ha-1 N. However, the yields at 70 and 100 kg ha-1 were not significantly different; therefore the best topdressing rate was 70 kg ha-1 N.
The fourth contrast shows that there were differences by splitting the rate 70 kg N ha-1, indicating that splitting the rate into 30 kg ha-1 N at sowing and 40 kg ha-1 N in topdressing, the maize yield increased in 509 kg ha-1 (Table 3). The same
B A
857
Maize nitrogen fertilization in two crop rotation systems under no-till
Rev. Ceres, Viçosa, v. 60, n.6, p. 852-862, nov/dez, 2013
trend was observed for the rate 90 kg ha-1, with significant difference for the splitting form in contrast 5, showing that the increase in the N rate at sowing to 50 kg ha-1 resulted in an increase of 426 kg ha-1 of grains compared with that obtained by the addition of 20 kg ha-1 of N at sowing .
The contrasts 6, 7 and 8 provided comparisons between the splitting forms of the rate 100 kg ha-1 N. Estimates of the contrasts 6 and 7 emphasize again the importance of N fertilization at sowing, because when the fertilizer was applied in topdressing only, there was a
Table 3. Contrast estimates and significance tests for maize yield as a function of nitrogen fertilization at sowing (S) and topdressing (C)
Contrast Treatments Estimates
Comparison between N rates in topdress kg ha-1
C1: C40 vs C70 (T1+T4+T7+T10+T13+T16) - (T2+T5+T8+T11+T14+T17) - 418** C2: C40 vs C100 (T1+T4+T7+T10+T13+T16) - (T3+T6+T9+T12+T15+T18) - 479** C3: C70 vs C100 (T2+T5+T8+T11+T14+T17) - (T3+T6+T9+T12+T15+T18) - 61ns
Comparison between 70 N
C4: (S0 + C70) vs (S30 + C40) T2 – T7 -509**
Comparison between 90 N
C5: (S20 + C70) vs (S50 + C40) T5 – T13 -426**
Comparison between 100 N
C6: (S0 + C100) vs (S30 + C70) T3 – T8 -605**
C7: (S0 + C100) vs (S60 + C40) T3 – T16 -607**
C8: (S30 + C70) vs (S60 + C40) T8 – T16 -2ns
Comparison between 120 N
C9: (S20 + C100) vs (S50 + C70) T6 – T14 -300*
Comparison between 130 N
C10: (S30 + C100) vs (S60 + C70) T9 – T17 -279 ns
**, * Significant at 1 and 5% by the Bonferroni test; ns = non-significant at 5% probability test by the Bonferroni test.
Table 2. N rates at sowing (S) and topdressing (C) and respective maize yields, relative price between maize production and nitrogen fertilizer and the average increase in yield in relation to the lowest fertilizer rate
Yield Prices1
Site 1 Site 2 Mean Site 1 Site 2 Mean
kg ha-1 R$ of maize/R$ of urea %
T1 = S0 + C40 6779 7900 7340 58.64 68.34 63.49
T2 = S0 + C70 7600 8080 7840 37.57 39.94 38.75 6.8
T3 = S0 + C100 7865 9196 8531 27.21 31.82 29.52 16.2
T4 = S20 + C40 7979 8547 8263 46.01 49.29 47.65 12.6
T5 = S20 + C70 7991 8570 8281 30.72 32.95 31.83 12.8
T6 = S20 + C100 8559 9263 8911 24.68 26.71 25.69 21.4
T7 = S30 + C40 8190 8508 8349 40.48 42.06 41.27 13.7
T8 = S30 + C70 8639 9633 9136 29.89 33.33 31.61 24.5
T9 = S30 + C100 8927 8987 8957 23.76 23.92 23.84 22.0
T10 = S40 + C40 8353 8538 8445 36.13 36.93 36.53 15.1
T11 = S40 + C70 8469 9625 9047 26.64 30.31 28.47 23.3
T12 = S40 + C100 9062 8991 9026 22.40 22.22 22.31 23.0
T13 = S50 + C40 8628 8787 8707 33.17 33.78 33.48 18.6
T14 = S50 + C70 9192 9230 9211 26.50 26.61 26.56 25.5
T15 = S50 + C100 8668 8888 8778 20.00 20.50 20.25 19.6
T16 = S60 + C40 8772 9505 9138 30.35 32.89 31.62 24.5
T17 = S60 + C70 8502 9970 9236 22.63 26.54 24.58 25.8
T18 = S60 + C100 8812 9149 8980 19.06 19.79 19.42 22.3
Mean 8388 8965 8676 30.88 33.21 32.04 19.3
Site 1: area with five cropping sequences of maize; Site 2: area with crop rotation (maize+soybean+oat+soybean+maize). 1Maize price,
quotation from January 2013 = R$ 24.50 bag; Urea price (kg ha-1) = R$ 1.18 kg.
Treatment
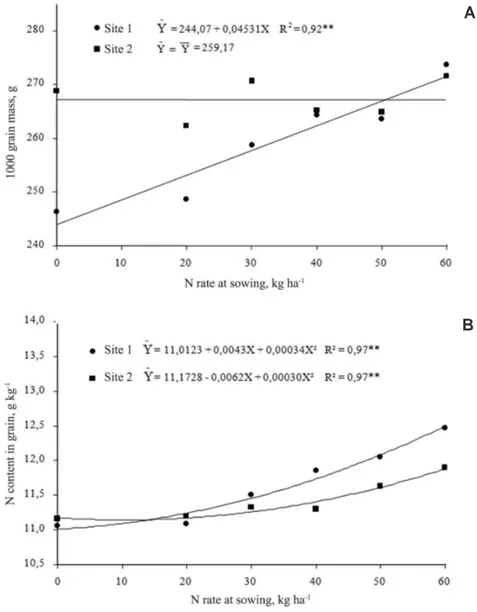
A
B
Figure 2. Thousand grain mass (A) and N content in maize grain (B) in response to nitrogen fertilization at sowing for areas without (Site 1) and with crop rotation (Site 2).
reduction of 605 and 607 kg ha-1 in the maize production, respectively, i.e., a significant reduction in yield.
The contrast established for maize production with the rate 120 kg N ha-1 (C9), indicated that the best splitting form was the application of 50 kg ha-1 of N at sowing and 70 kg ha-1 N in topdressing. There was an increase of 300 kg ha-1 in grain production compared with that obtained from the management commonly used in various maize production regions, which is 20 kg ha-1 N at sowing and 100 kg ha-1 N in topdressing. No yield differences were found for the split of the rate 130 kg N ha-1 (C10). Fancelli & Dourado Neto (2002) stated that a high input of N at sowing provides larger number of grains per ear and allow greater flexibility in the period of topdress application of nitrogen, which can be extended to the stages V7 and V8. Site 1 had, on average, larger 1000-grain mass than Site 2, which reflected in the yield (Figure 2a). There was an increase of 0.045 g per kg ha-1 of N applied at sowing
(linear increase) in the Site 1, but no differences were found for the rates of N applied at sowing in Site 2. This trend of grain mass increase was also reported by Lana et al. (2009), but different from that reported by Gomes et al. (2007).
The conflicting results in the literature show that the grain mass is a trait not only influenced by nutrient availability, but is also influenced by genotype and climatic conditions of the region. This behavior is probably a result of soil management, which in case of Site 2, there may be a better balance between mineralization and immobilization of N. Thus, over the years, when the no-till system is consolidated, it will be possible to reduce fertilizer rates (Anghinoni, 2007), as the effect of increased biomass production and, consequently, the increase of carbon stocks and N in the soil.
859
Maize nitrogen fertilization in two crop rotation systems under no-till
Rev. Ceres, Viçosa, v. 60, n.6, p. 852-862, nov/dez, 2013
Figure 3. Plant height (A), grain number per row (B), grain number per ear (C) and ear length for areas without (Site 1) and with crop rotation (Site 2) (d) in response to nitrogen fertilization at sowing.
A
B
C
(Figure 2b), a trend also observed by Fornasieri Filho (2007). This increase may be related to the higher content of P in the soil of this site and the nutritional balance of the plants, which emphasizes the importance of good management of soil fertility for maize cultivation. The presence of adequate levels of P stimulates N uptake, in the same way that N has a positive effect on the absorption of P by stimulating root growth at the site where N is in the highest concentration (Novais et al., 2007).
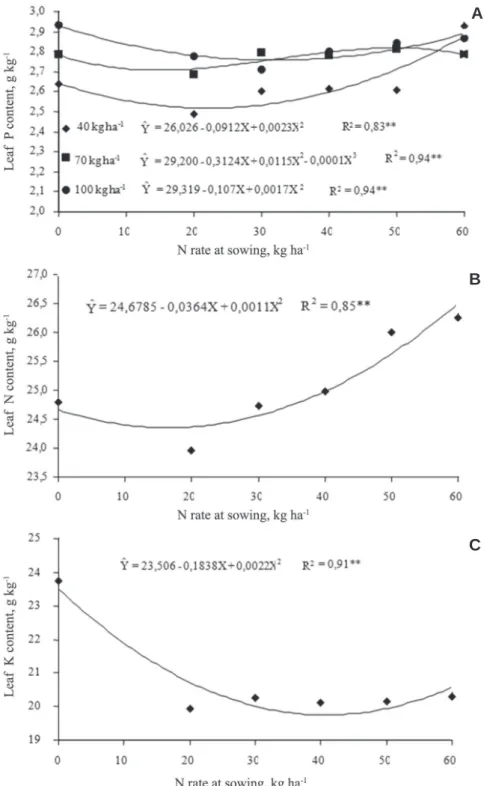
A
B
C
Figure 4. Leaf phosphorus content as a function of N applications at sowing and topdressing (A), leaf nitrogen content (B) and leaf potassium content (C) in response to nitrogen at sowing.
861
Maize nitrogen fertilization in two crop rotation systems under no-till
Rev. Ceres, Viçosa, v. 60, n.6, p. 852-862, nov/dez, 2013
per row as a function of N rates at sowing was obtained with the rate 38 kg ha-1 N.
There was difference for the row number per ear between the sites, with Site 1 having a higher mean (Table 1). This fact can be explained by the higher contents of P and K in the soil of Site 1. There was no effect of N at sowing for this variable. However, even with the Site 1 having larger row number per ear, there was no difference in the grain number per ear between the sites (Figure 3c) and this is probably due to the smaller ear length of Site 1 (Figure 3d).
Costa et al. (2012) found that in the intercropping (maize + brachiaria), the row number, grain number per row and grain number per ear were directly associated and had linear increase with topdress N rates, showing the key role of this nutrient for the maize grain formation. The same fact was reported by Lana et al. (2009), emphasizing the important role of N for the agronomic performance of crops and production components.
There was a significant interaction between N rates at sowing and sites for ear length (Table 2). At Site 1, a linear increase of 0.027 cm was recorded for each kg ha-1 of N applied at sowing (Figure 3d). However, no difference was found for Site 2 as a function of N rates at sowing, with a mean of 16.53 cm for ear length.
The leaf N content increased from the N rate 16.5 kg ha-1 at sowing (Figure 4b). However, even with the highest rate of N at sowing (60 kg ha-1 N) the leaf N content was below the adequate levels recommended by Oliveira (2004). This low leaf N may be due to the dilution effect in the plant, since there was increase in plant height with rates up to 45.2 kg ha -1 N at sowing (Figure 3a). This result differs from that obtained by Costa et al. (2012), who found that the leaf N content increased linearly with increasing levels of N.
The leaf K+ content decreased with N rates at sowing up to 41.8 kg ha-1 N, but increased from that rate (Figure 4c), i.e., without N fertilization at sowing, K+ concentration was higher than that found with increasing N rates at sowing, probably because of the lower plant growth, which resulted in higher K+ concentrations.
For leaf P content, there was difference between the sites and significant interaction between N rates at sowing and topdressing (Table 1). Site 1 had mean P content greater than Site 2, possibly due to the higher initial concentration of P in the soil. However, the contents were within the range considered adequate for the crop (Oliveira 2004).
In the interaction of leaf P content with the N rates, at sowing and in topdressing, there was a tendency to equate the P contents at the highest N rate at sowing (60 kg ha-1). These results show a positive interaction between N and P, that is, increased N at sowing resulted in increased P absorption, especially at the rate 40 kg ha-1 N in topdressing, even for soils with high P available, in which there is usually little response to fertilization (Figure 4a).
CONCLUSIONS
Split nitrogen applications, with the highest rate applied at sowing, for the same final amount of fertilizer, resulted in higher grain yield.
The rate 70 kg ha-1 nitrogen in topdressing provided the highest yield the lowest cost, compared with the yield obtained with the rates 40 and 100 kg ha-1.
The crop rotation (maize + soybean + oat + soybean + maize) provided significant increase (7%) in maize yield compared with the sequential maize cultivation.
Increased nitrogen at sowing increased the 1000 grain mass, plant height, ear length, grain number per row and grain number per ear.
REFERENCES
Amado TJC, Mielniczuk J & Aita C (2002) Recomendação de adubação nitrogenada para o milho no RS e SC adaptada ao uso de culturas de cobertura do solo, sob sistema de plantio direto. Revista Brasileira de Ciência do Solo, 26:241-248.
Anghinoni I (2007) Fertilidade do solo e seu manejo em sistema plantio direto. In: Novais RF, Alvarez V VH, Barros NF, Fontes RLF, Cantarutti RB & Neves JCL (Eds.) Fertilidade do solo. Viçosa, SBCS. p.873-928.
Araújo LAN, Ferreira ME & Cruz MCP (2004) Adubação nitrogenada na cultura do milho. Pesquisa Agropecuária Brasi-leira, 39:771-777.
Cabezas WARL, Arruda MR, Cantarella H, Pauletti V, Trivelin PCO & Bendassolli JA (2005) Imobilização de nitrogênio da uréia e do sulfato de amônio aplicado em pré-semeadura ou cobertura na cultura de milho, no sistema plantio direto. Revis-ta Brasileira de Ciência do Solo, 29:215-226.
CBOT - Chicago Board of Trade (2013) Cotações - Milho. Dispo-nível em: <http://www.scotconsultoria.com.br/cotacoes/milho/ ?ref=smnb>. Acessado em: 18 de janeiro de 2013.
Chioderoli CA, Mello LMM, Grigolli PJ, Furlani CEA, Silva JOR & Cesarin AL (2012) Atributos físicos do solo e produtividade de soja em sistema de consórcio milho e brachiaria. Revista Brasileira de Engenharia Agrícola e Ambiental, 16:37-43.
CONAB – Companhia Nacional de Abastecimento (2012) Acompanhamento da safra Brasileira: grãos. Oitavo levantamento -junho de 2012. Brasília, Companhia Nacional de Abastecimen-to. 34p.
Costa NR, Andreotti M, Gameiro RA, Pariz CM, Buzetti S & Lopes KSM (2012) Adubação nitrogenada no consórcio de mi-lho com duas espécies de brachiaria em sistema plantio direto.
Pesquisa Agropecuária Brasileira, 47:1038-1047.
Embrapa – Empresa Brasileira de Pesquisa Agropecuária (2006a) Sistema de produção: nutrição e adubação do milho. Disponível em: <http://www.cnpms.embrapa.br/publicacoes/milho_7_ed /feraduba.htm>. Acessado em: 08 de janeiro de 2006. Embrapa – Empresa Brasileira de Pesquisa Agropecuária (2006b)
Sistema Brasileiro de Classificação de Solos. 2ª ed. Rio de Janei-ro, Embrapa Solos. 306p.
Fancelli AL & Dourado Neto D (2004) Produção de milho. 2ª ed. Piracicaba, Guaíba. 360p.
Farinelli R & Lemos LB (2012) Nitrogênio em cobertura na cul-tura do milho em preparo convencional e plantio direto conso-lidados. Pesquisa Agropecuária Tropical,42:63-70.
Fornasieri Filho D (2007) Manual da cultura do milho. Jaboticabal, Funep. 576p.
Gomes RF, Silva AG, Assis RL & Pires FR (2007) Efeito de doses e época de aplicação de nitrogênio nos caracteres agronômicos da cultura do milho sob plantio direto. Revista Brasileira de Ciência do Solo,31:931-938.
IAPAR - Instituto Agronômico do Paraná (2011) Médias históri-cas em estações do IAPAR. Disponível em: <http://www.iapar.br/ a r q u i v o s / I m a g e / m o n i t o r a m e n t o / M e d i a s _ H i s t o r i c a s / Palotina.htm>. Acessado em: 16 de maio de 2013.
Jantalia CP, Petrere C, Aita C, Giacomini S, Urquiaga S, Alves BJR & Boddey RM (2006) Estoques de carbono e nitrogênio do solo após 17 anos sob preparo convencional e plantio direto em dois sistemas de rotação de culturas em Cruz Altas, RS. Seropédica, Embrapa Agrobiologia. 42p. (Boletim de Pesquisa e Desenvol-vimento, 13).
Lana MC, Woytichoski Júnior PP, Braccini AL, Scapim CA, Ávila MR & Albrecht LP (2009) Arranjo espacial e adubação nitrogenada em cobertura na cultura do milho. Acta Scientiarum Agronomy, 31:433-438.
Lara-Cabezas WAR, Alves BJR, Caballero SSU & Santana DG (2004) Influência da cultura antecessora e da adubação nitrogenada na produtividade de milho em sistema plantio dire-to e solo preparado. Ciência Rural, 34:1005-1013.
Novais RF, Smyth TJ & Nunes FN (2007) Fósforo. In: Novais RF, Alvarez V VH, Barros NF, Fontes RLF, Cantarutti RB & Neves JCL (Eds.) Fertilidade do solo. Viçosa, SBCS. p.471-550. Oliveira SA (2004) Análise foliar. In: Sousa DMG & Lobato E
(Eds.) Cerrado: correção do solo e adubação. 2ª ed. Planaltina, Embrapa Cerrados. p.245-256.
Silva EC, Ferreira SM, Silva GP, Assis RL & Guimarães GL (2005) Épocas e formas de aplicação de nitrogênio no milho sob plan-tio direto em solo de cerrado. Revista Brasileira de Ciência do Solo, 29:725-733.
Silva EC, Muraoka T, Buzetti S, Veloso MEC & Trivelin PCO (2006) Aproveitamento do nitrogênio (15N) da crotalária e do
milheto pelo milho sob plantio direto em Latossolo Vermelho de Cerrado. Ciência Rural, 36:739-746.
Universidade Federal de Viçosa (1999) SAEG: Sistema para Análi-ses Estatísticas e Genéticas. Versão 8.0. Viçosa, Fundação Arthur Bernardes. CD-ROM.
Souza LCF, Gonçalves MC, Sobrinho TA, Fedatto E, Zanon GD & Hasegawa EKB (2003) Culturas antecessoras e adubação nitrogenada na produtividade de milho em plantio direto irriga-do. Revista Brasileira de Milho e Sorgo, 2:55-62.
USDA – United States Department of Agriculture (2012) Crop production. Disponível em:<http://usda01.library.cornell.edu/ usda/current/CropProd/CropProd-05-10-012.pdf>. Acessado em: 05 de junho de 2012.