Research
B
razilian agribusiness represents around 40% of the national GDP, (Prates, 2014), however, the challenge of this business model is to ensure long-term survival, considering great seasonality of price and production of agricultural products. This sector in the national economy is highly influenced by climate, input prices, phytosanitaryconditions, public policy, among others, which increase investment risks. Agricultural activity itself is already a risky investment, mainly those activities considered niche market, such as organic production, which presents production difficulties, mainly the certificated, since the certifiers prevent any other management technique except the ones
listed in their standards for production and marketing. These difficulties can be even more complex for some crops, such as tomato, due to the high susceptibility to pests and diseases (Maciel & Silva, 2014). In addition, production seasonality affects indifferently any form of crop production, even under protected environment (Hernández et ARAÚJO, HF; LEAL, PAM; BETIN, PS; NUNES, EF. 2018. Economic profitability indicators of minitomatoes organic production in greenhouses. Horticultura
Brasileira 36: 246-252. DOI: http://dx.doi.org/10.1590/S0102-053620180217
Economic profitability indicators of minitomatoes organic production in
greenhouses
Haroldo F Araújo1; Paulo AM Leal2; Pâmela S Betin2; Eduardo F Nunes3
1
Instituto Federal do Pará (IFPA), Breves-PA, Brazil; haroldo.araujo@ifpa.edu.br; 2Universidade Estadual de Campinas (FEAGRI/UNICAMP),
Campinas-SP, Brazil; pamleal@feagri.unicamp.br; pamela_betin@hotmail.com; 3Faculdade Metropolitana de Campinas (Metrocamp),
Campinas-SP, Brazil; nunes.r4f@gmail.com
ABSTRACT
Financial profitability is a factor as important as quantifying production using new technologies. This study was installed to evaluate short and long term financial viability of organic production of cherry tomatoes. Plants were grown in a greenhouse under diverse technological degrees for partial control of micrometeorological elements. The experiment was carried out at the experimental field FEAGRI/UNICAMP in three greenhouses with automated mechanical ventilation systems, evaporative cooling and thermo reflective screen. We cultivated Carolina cultivar in a spacing of 0.5x0.9 m, each plant conducted with two stems, under organic production and fertilization management. The average of production data of treatments [three greenhouses (A= climate-controlled, B= mobile screen and C= fixed screen), two cultivation systems (pots and soil beds) and five biofertilizer doses (0, 50, 100, 150, and 200%)] were evaluated using joint analysis. Thus, the economic indicators [cost benefit ratio (B/C), net present value (NPV), internal rate of return (IRR) and Payback (PV)] were evaluated through revenues and production costs. The best alternative to net monthly cycle profitability (500 m2) was approximately 1 and 1.5 minimum wage
with and without particular labor, respectively, associated with the greenhouse of medium technological level, using soil bed cultivation system. The economic viability of the project in long-term interest rates above 3% (a.a) was consistent, but the payback period even with a rate of 1% a.a was high (6.54 years) in financing conditions.
Keywords: Solanum lycopersicum, financial profitability, economic
analysis, ambience.
RESUMO
Indicadores econômicos da produção orgânica de minitomate em casas de vegetação
A rentabilidade financeira é um fator tão importante quanto quan -tificar a produção utilizando novas tecnologias. Assim, objetivou-se analisar em curto e longo prazo a rentabilidade financeira da produção orgânica de minitomates em casas de vegetação com diferentes graus tecnológicos de controle parcial dos elementos micrometeorológi-cos. O experimento foi desenvolvido no campo experimental da FEAGRI/UNICAMP (SP) em três casas de vegetação com sistemas automatizados de ventilação mecânica, resfriamento evaporativo e tela termorrefletora, sendo estas cultivadas com a cultivar Carolina em espaçamento 0,5x0,9 m em duas hastes, e manejo da produção e adubação orgânica. As médias dos dados de produção dos trata -mentos [três casas de vegetação (A= climatizada, B= tela móvel e C= tela fixa), duas formas de cultivo (vasos e canteiros) e cinco doses de biofertilizante (0, 50, 100, 150, e 200%)] foram avaliadas em análise conjunta. Assim, avaliou-se através das receitas e custos de produção os indicadores econômicos {relação benefício custo (B/C), valor presente líquido (VPL), Taxa interna de retorno (TIR) e Payback (PV)}. De acordo com os resultados, a melhor alternativa
de rentabilidade líquida mensal ciclo (500 m2) foi de
aproximada-mente 1 e 1,5 salários mínimo para a condição com e sem mão de obra particular, respectivamente, associado à casa de vegetação de médio grau tecnológico, utilizando a forma de cultivo em canteiros. A viabilidade econômica do projeto em longo prazo a taxas de ju -ros acima de 3% (a.a) mostrou-se consistente, porém o período de
payback mesmo à taxa de juros 1% a.a foi elevada (6,54 anos) em condições de financiamento.
Palavras-chave: Solanum lycopersicum, rentabilidade financeira, análise econômica, ambiência.
al., 2008; Schallenberger et al., 2008). The protected environment, with some degree of control, concerning micrometeorological conditions of the production environment, allows annual productive regularity, higher productivity and better product quality (Reis et al., 2013). These improvements are observed for tomato production in protected environment; however, even with some control in production environments, the productivity under organic cultivation is still lower in comparison to conventional system (Seufert et al., 2012). Nevertheless, protected environment is an interesting production structure, to be used for organic vegetable agriculture, since it can offer lower nutrient intake (inputs) and energy to plants (Zandonadi et al., 2014), given the greater energy efficiency of the inputs (organic matter decomposition) due to better control of mass and energy balance.
T h e a g r i c u l t u r a l m a r k e t f o r protective structures is growing and varied, presenting from simple structures (protection) to structures of high technological degree to modify indoor micrometeorological conditions, which allow higher control of factors such as water, nutrients, light, temperature, relative humidity and CO2 concentration (Blisca Junior, 2011). Despite the increasing demand, the costs to acquire these structures are still high. Thus, an economic evaluation of the productive activity will aid the strategic decision-making process for investments. In this evaluation, analyzing long-term project profitability is extremely important, since returns from this investment will be over several years (Costa et al., 2010).
Evaluations on costs and financial returns allow the producer to compare total production cost, as well as financial return variations according to the vegetable producer, production time, geographic location, size of the enterprise and cost of the structures (Engindeniz & Gül, 2009). Nevertheless, few studies had been carried out about alternatives for a productivity increase which discuss the economy of this activity (Potter et al., 2000; Araújo et al., 2013). Thus, important information on
real investment offsets is not generated, information on what increase or do not increase the productivity, in a way to the point of being financially attractive comparing with other less expensive activities on the market (fixed income investments).
Thus, profitability and project risk analysis represent tools which allow helping the decision-make strategy with a relatively reliable safety margin, providing elements to measure the degree of confidence in the expected rate of return (Ponciano et al., 2004).
Given the above, the aim of this study was to analyze in short and long terms financial profitability of organic production of minitomatoes i n g r e e n h o u s e s w i t h d i f f e r e n t technological degrees of partial control of micrometeorological elements.
MATERIAL AND METHODS
The experiment was performed from February to November 2013, in three greenhouses installed at the experimental field at Agricultural Engineering (FEAGRI) of the State University of Campinas (UNICAMP). The greenhouses were in parallel position among each other, same shape and volume, with total area of 70.40 m2
(6.4x11 m) and 3.0 m ceiling height. The coverage of two waters in all environments was made of 150 μm thick antivirus diffuser plastic.
The greenhouses were classified as: a) high degree of technology (CVA); b) medium degree of technology (CVB) and c) low degree of technology (CVC).
The CVA was climate-controlled, being completely closed with 150 μm thick antivirus diffuser plastic, equipped with mechanical ventilation systems, evaporative cooling (RE) and thermal reflector screen (Araújo et al., 2016), automatically triggered according to temperature and relative humidity, as the following settings: mechanical ventilation; I) triggered according to temperature sensor (SHT-75, precision ±0.3°C) installed in the geometric center, when the temperature reached 26±2°C, turning off at 24±2°C. RE; II) air temperature >28°C and/or relative
humidity <65% the extractor fan and the centrifugal pump were activated, following the order: extractor fan, 1 minute after the pump. When the relative humidity reached 75%, the pump was turned off and 5 minutes after if the temperature were not >28°C, the extractor (EM30), hysteresis (±2°C and ±10%).
CVB and CVC were environments with closed sides using antiinsect screen (Baby Citrus), 50 mesh, also equipped with thermal reflector screen in a mobile system in B and fixed in C, being theses screens an aluminized type, 50% shading. In CVA, the screen was also installed in a mobile system, triggered by a global radiation sensor installed near the plant canopy (2 m) and in B triggered at predetermined times throughout the day. Thus, in CVA from 6 p.m. to 5:59 a.m., the screen was opened (extended), remaining opened during the whole night period; (daytime) from 6 a.m. to 5:59 p.m., the trigger was according to the global radiation (RG); RG≥300 W m-2 the screen was opened,
remaining opened for 10 min in the position performed to return the sensor to read; RG<300 W m-2 the screen was
closed. Whereas in CVB, at 6 a.m., the screen was closed and at 10 a.m., the screen was opened; at 4 p.m. the screen was closed and at 6 p.m. the screen was opened remaining opened up to 6 a.m. On cloudy days, the screen was closed manually, in order to allow incidence of solar radiation. Whereas in CVB, at 6 a.m., the screen was closed and at 10 a.m., the screen was opened; at 4 p.m., the screen was closed and at 6 p.m., the screen was opened remaining opened up to 6 a.m. On cloudy days the authors would close the screen manually, in order to allow incidence of solar radiation.
In all greenhouses, tomatoes belonging to minitomato group were cultivated, cultivar Carolina (Feltrin), indeterminate growth with seedlings produced in loco, in a greenhouse, sown in trays with 0.050 L cell-1.
and soil bed (0.4x0.2x5.5 m) filled with selected soil from crop-free area (soil for construction). Liming was performed according to soil analysis and then foundation fertilization was applied in soil beds and pots in the same proportion, following recommendation for staked tomato crop (Raij et al., 1997) and soil analysis, using bovine manure, commercial organic compound bio-bokashi, thermophosphate, potassium sulphate and micronutrients. Fertilizer incorporation was performed forty days before seedling transplant.
Topdressing fertilization was adapted according to organic fertilization management carried out by Libânio (2010) and soil analysis, being distributed in time according to the phenological phases of the crop up to approximate totalization of 250 kg N ha-1 and 450 kg K
2O ha
-1 in the form
of branned bio-bokashi and potassium sulphate, inputs allowed for use on organic production certified by IBD.
Plants, in both production systems (pots and soil beds), were grown with two stems, tutored on a wire with the aid of a ribbon stuck, which were installed on planting lines supported by bamboo stakes. Apical pruning was performed at 184 days after transplant (DAT), approximately 6-meter length each stem, being the last racemes harvested up to 31 days after.
The authors used line-source sprinkler irrigation system, sprinkler line (2 L h-1), spaced every 0.50 m
along the pots and 0.25 m the beds, trigged automatically by a controller (Galcon 8059S), according to the water demand in each greenhouse. Irrigation management for each greenhouse was defined based on the water percolation in the pots (6 pots), using to define the time of the irrigation pulses according to water storage capacity of soil and crop phase at 7 a.m, 11 a.m., 1:30 p.m. and 4 p.m. (Araújo, 2015).
Besides the production environments and cultivation, the crop was submitted t o d i ff e r e n t b i o f e r t i l i z e r d o s e s (0.50, 100, 150 and 200%), using a commercial biofertilizer, Microgeo, being prepared and applied according to the manufacturer specifications, both in soil beds and in pots.
F o r s t a t i s t i c a l e v a l u a t i o n o f production data, the authors considered two useful plants per replicate, considering the overall averages obtained using the joint analysis [three greenhouses x 2 cultivations, beds and pots x 5 doses of biofertilizer 90.50, 100, 150 and 200%)].
To analyze the profitability of the investments applied in each greenhouse, the authors considered minimum production area, 500 m2, with 1000
plants, according to the spacing mentioned. For these analyses, the authors followed the methodology of Hoffman et al. (1992), with evaluation of gross and net revenue, besides the economic indicators for investment analysis {cost/benefit ratio, net present value (NPV), internal rate of return (IRR) and payback period (PV)}.
For investment, the authors used as a credit base, investments for family agriculture, with loans from Pronaf Agroecologia, which interest rate is 1% per annum, with 10 years for discharge and up to 3 years grace period (MDA, 2014). In this study, the authors considered only the data for the first year (year 0).
For the analyses, the authors considered unit price per pack of 0.45 kg sold at an average price of R$ 3.50, with collection of the production in loco. Each evaluated treatment was characterized as a production unit, quantifying their fixed and variable costs at real market values for implantation and production of the crop in the region.
The following equations were used to calculate the analyzed variables:
Gross Revenue (GB): Production (Prod), multiplied by the unit price of the product (Pu), obtained by equation 1:
GB = Prod x Pu (1)
Net revenue (NR): Difference between GB and expenses (D) or expenses spent during the production process, as follows equation 2:
RL = GB – D (2)
Benefit Cost Ratio (B/C): Ratio between the present value of the revenues to be obtained and the present value of costs (including investments), calculated according to equation 3:
(3)
In which Ri: Revenue obtained in a year, r: Annual real interest rate (decimal); i: Number of years to pay off the investment or equipment life; Ci: Costs in a year.
Net present value (NPV): consists of transferring to the current instant all the variations of expected cash, discounting them at a given interest rate and add them algebraically, being represented by the present value of the Net Benefits (Benefits/Costs), calculated according to equation 4:
(4)
In which: Ri: Revenue obtained in a year; r: Annual real interest rate (decimal); i: Number of years to pay off the investment or equipment life; Ci: Costs in a year.
Internal Rate of Return (IRR): Rate which makes the NPVL of the investment cash flow null, characterizing, thus, the rate of return on invested capital, calculated according to equation 5.
( 5 )
In which Ri: Revenue obtained in a year; r: Annual real interest rate (decimal); i: Number of years to pay off the investment or equipment life; Ci: Costs in a year.
The payback period represents the number of periods required for the flow of benefits to exceed the invested capital, and it can be calculated according to equation 6.
In which: PV: payback period; Fc: Cash flow; n: Year of analysis; i: Minimum rate of attractiveness or interest.
(6)
To update production costs and revenues in relation to the investment period, we used a discount factor (FD), expressed by the equation 7.
(7)
In which: r: Annual real interest rate (decimal); i: Number of years to pay off the investment or equipment life.
Production costs were estimated for each production unit (greenhouse) measuring 500 m2 of area and production
The cost of water (R$ 4.80 m-3) was
analyzed only for eventual payment, being stipulated based on the values of treated water tariffs in the standard residential category, contained in the resolution of Agência Reguladora dos Serviços de Saneamento of the Piracicaba, Capivari and Jundiaí Rivers (RES-PCJ), Nº 37, December, 2013.
The value of the electrical energy tariff was obtained by the sum of the cost of effective energy and electrical equipment demand. Residential tariff was R$ 0.317/kWh, according to Companhia Paulista de Força e Luz (CPFL) and Agência Nacional de Energia Elétrica ANEEL (2014).
The cost of electricity consumption was estimated based on equation 8, according to Monteiro et al. (2007).
(8)
In which: CE = cost of electricity (R$ 0.7457) during crop cycle; Conversion factor from cv to kW; Pot = Engine power in cv; Tf = Equipment operating time; Pkwh = Price per kWh, in R$.
The authors considered land lease as zero (own land), annual real interest rate 1% per year (a.a), according to Pronaf financing rules, 10-year service life equipment, and residual value as null, as well as a one-cycle year, and productive value of this constant for succeeding ten years.
The operating costs (fixed and variable) considered were for the implementation of a production area of 500 m2 with different applied
technologies in the greenhouses A, B and C evaluated in production organic
system. The replacement of the culture was also considered every 250 days, from the second year considering only costs depending on the treatments used. Thus, the authors performed only one production year, experimentally (25/02 to 01/11, 2013), considering fixed costs and variables for implantation of the crop as an investment, and as actual costs only interest on debt service, since this is the project’s grace period (year 0).In the second year (prospecting for investment analysis) the variable costs for the implantation of a new crop were evaluated, disregarding some activities carried out only in the first year, though, such as installation of mattress, building of soil beds and the filling of these soil beds and pots. This year, the authors started to consider the costs to begin amortization and debt servicing. From the third year of production on, the authors considered the variable costs for implanting a new crop and maintenance of production infrastructure, as well as amortization and debt servicing. Thus, the cost values (variables) for the other years of production (3 to 10 years) were alternated, in values, in relation to the mentioned activities for the second and third production years.
Using the production revenues, operating costs and debt service, the authors accounted the cash flow for each greenhouse and cultivation system, quantifying the respective revenues and costs at nominal and updated values accounting the variables of profitability analysis.
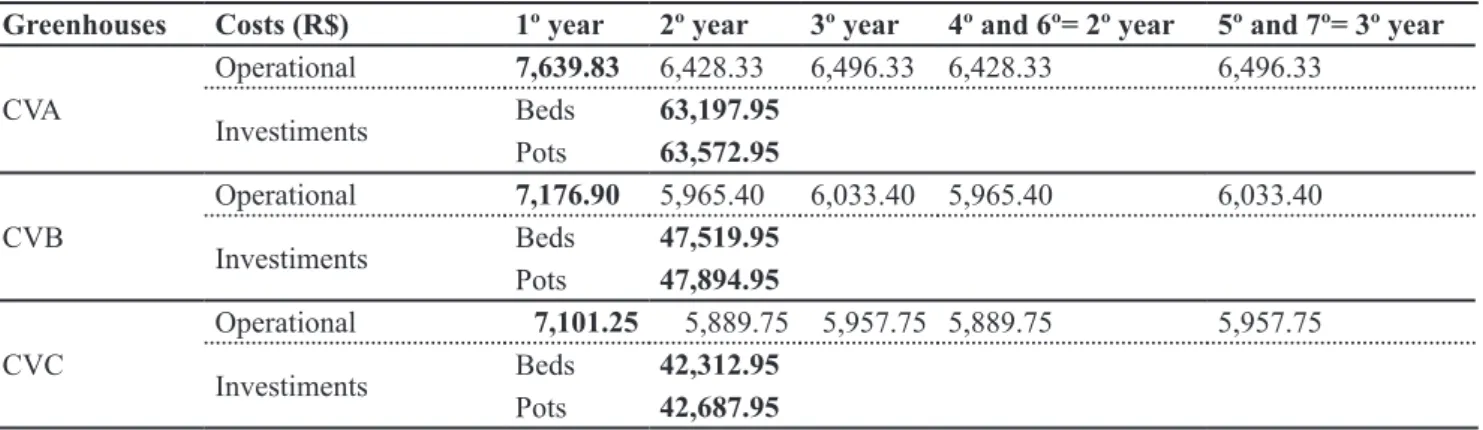
In Table 1, the authors show the summary of the actual costs incurred
during the production under organic system, based on these costs to calculate profitability indicators evaluated in this study. These costs are a sum of all the costs incurred during the study.
RESULTS AND DISCUSSION
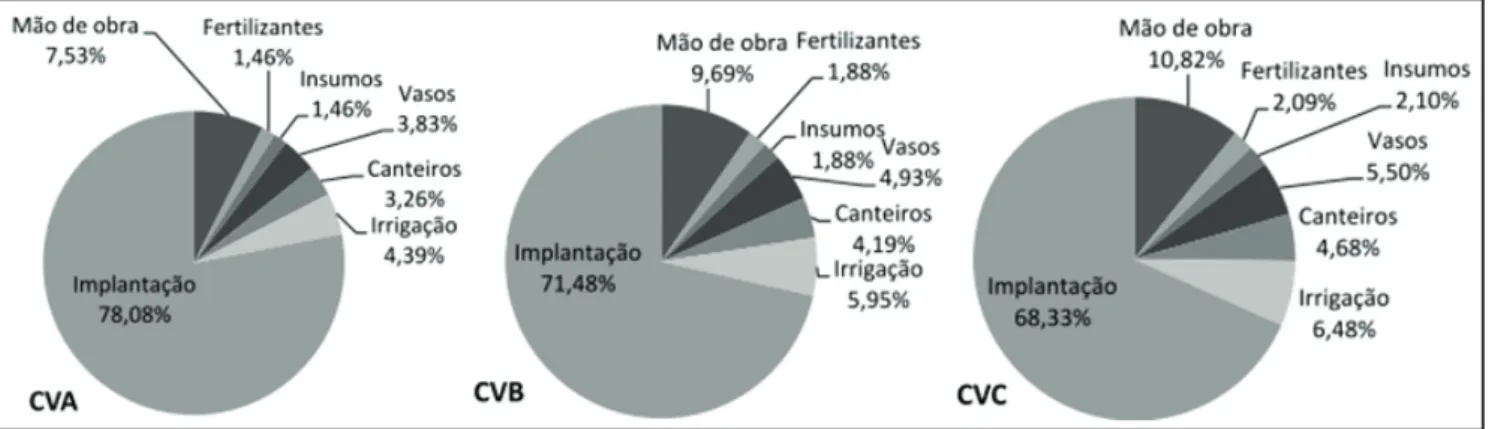
Detailing the costs of the year of greatest investment (year 0), the authors observed the largest cost share corresponded to the purchase of greenhouses, followed by the costs for labor (Figure 1). However, despite of the high cost of purchasing the greenhouses, this cost could be diluted over the life of the structure, which can reach 50 years, being necessary to replace only plastic and some other shorter-service-life equipment. This would increase the profitability of the producer, since this would reduce share price of debt service.
Since no significant difference was found in relation to the use of biofertilizer (Table 2), the analyses of cash flow and profitability indicators were performed only for averages between greenhouses and cultivation systems.
E v a l u a t i n g p r o d u c t i o n d a t a statistically, the authors observed a difference in CVB in relation to the other greenhouses and cultivation system in soil beds in relation to pots, both for total and commercial productivity. On the other hand, interactions did not show any significant difference. Despite the significant statistical increase in production showed in CVB, economically speaking, the other
Table 1. Actual costs for the acquisition and production of minitomatoes in a 500 m2 greenhouse. Campinas, Unicamp, 2013.
Greenhouses Costs (R$) 1º year 2º year 3º year 4º and 6º= 2º year 5º and 7º= 3º year
CVA
Operational 7,639.83 6,428.33 6,496.33 6,428.33 6,496.33
Investiments Beds 63,197.95
Pots 63,572.95
CVB
Operational 7,176.90 5,965.40 6,033.40 5,965.40 6,033.40
Investiments Beds 47,519.95
Pots 47,894.95
CVC
Operational 7,101.25 5,889.75 5,957.75 5,889.75 5,957.75
Investiments Beds 42,312.95
Pots 42,687.95
productive alternatives (CVC) can present interesting economic indicators too, related to production costs.
The economic indicators (B/C, NPV and IRR) of the investment analysis for the project financing rate (1% per year) (Table 3), show this is a viable investment for all the greenhouses and cultivation systems, considering B/C ratio was always superior to one unit and IRR above 24%. Among these treatments, CVB for cultivation in soil beds, showed the best results concerning profitability, followed by CVC for the same cultivation system, presenting profitability in NPV 12.50% lower. This difference shows CVB even showing a productive increase statistically, different from CVC, are economically equated, certainly due to production costs.
Evaluating the best treatments for implantation of the project, B/C shows 1.69, which would generate net benefit of R$ 0.69 for each R $1.00 applied. Rate of attractiveness of the project of approximately 70%, resulting in net income of R$ 6,8909.93 for each 250-day cycle (1 cycle/year, with a potential of 1.46 cycle/year, though), with prospect of payment, of this project, in approximately 6.54 years. Thus, monthly net profitability of the producer ranged from R$ 830.00 and 1,330.00 accounting for particular and familiar labor, respectively.
According to Negrisoli et al. (2015) the investment should be accepted, since the cost of the capital (1% per year) was considered in the analysis and IRR considerably exceeded the minimum
attractiveness rate in the present project. Despite the economic viability observed for all the production environments and cultivation systems for investment, the interest rate of 1% per year, the payback period in some analyses, exceeded the investment analysis period. Thus, benefit flow did not exceed the invested capital. The authors, then, concluded this would be a high-risky investment project.
Profitability analysis is highly influenced by productivity, production costs, loan interest rate and sale price. Certainly the first two factors explain the low financial returns obtained, mainly in CVA under the two cultivation systems.
The results obtained in this study are close to the average values observed by Araújo et al. (2013), 1.71 (B/C), 40,869.95 (NPV) and 71.75% (IRR), evaluating technical and economic indicators for yellow passion fruit plants under conventional system of 1 ha. However, when compared with the indicators of this study, the
advantages related to organic systems and mainly area/production ratio to obtain practically the same profitability have to be considered.
Miguel et al. (2008), evaluating the profitability of lettuce and carrot crops grown under organic system in field conditions in the state of São Paulo, obtained return rate of 77.3% for lettuce and 33.7% for carrot in a cultivation area of 10,000 m2, close
to averages found in this study for lettuce. Production area ratio, which was 500 m2 in this study, should be
considered, though. Rezende et al. (2009), analyzing the profitability of the crops of lettuce, radish, roquette and cabbage in monocrop and intercropping with sweet pepper, obtained return rate lower than 14%.
Negrisoli et al. (2015) evaluating economic viability of minitomato production in a protected environment, obtained values of NPV of R$ 294,308.96 and IRR of 58.97% in an area of 1500 m2 and interest rate of 6% per year.
Figure 1. Total Cost Division (Investments and Operational – year 0) in each production environment. CVA – Greenhouse A; CVB –
Greenhouse B; CVC – Greenhouse C. Campinas, Unicamp, 2013.
Table 2. Average values of total and commercial productivity obtained under the different
treatments. Campinas, Unicamp, 2013.
Treatments Total productivity
(kg m-2)
Commercial productivity (kg m-2)
Greenhouse A 3.865 b 3.681 b
Greenhouse B 4.467 a 4.254 a
Greenhouse C 3.858 b 3.674 b
Soil beds 4.214 a 4.014 a
Pots 3.912 b 3.726 b
CV (%) 17.861 17.547
Although the value of IRR is close to the value obtained in this study, the interest rate of 5% per year, the production area is 3 times bigger.
The economic potential of these production units under organic system can be increased, since the use of tomato cultivars improved genetically expresses 3x production potential when compared with the ones obtained in this study (non-hybrid cultivar) and the increase in cultivated area does not represent a proportional increase in investment costs. Nevertheless, since this is a differentiated product in the market, selling price of the product must be estimated taking into account this factor, as according to Carvalho et al. (2014) price paid is what presents the greater sensitivity of the profitability of
tomato crop.
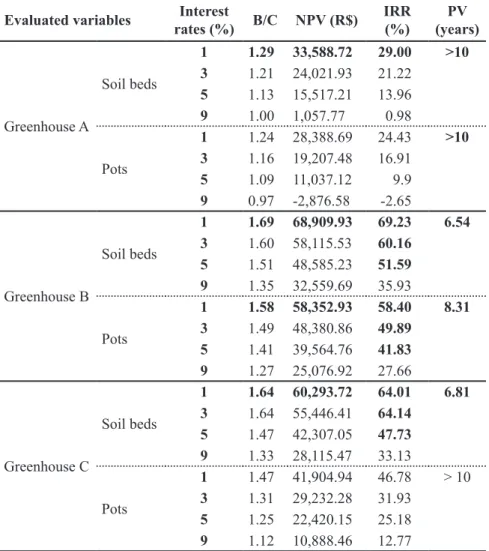
In Table 3, the authors present a sensitivity analysis of profitability indicators for other discount rates or interest in the market. The results allow observing that CVA under the two cultivation systems and other greenhouses for cultivation in pots showed low economic viability for financing conditions at interest rates above 3% (per year), which in a long term may reach 9% per year, historically. With the exception of the cultivation in pots verified in CVB, which showed good economic results at the majority of market interest rates, more financially attractive alternatives such as those observed for the cultivation in soil beds (higher economic indicators) make the project more consistent for financing.
The authors also observed that in CVC, a certain equality in the financial returns obtained between the interest rates of 1 and 3% for B/C ratio indicators and IRR was noticed. This is due to, when calculating these indicators in the long term, only amounts of costs and revenues updated over the project investment period were considered, thus the actual differences will be reported only in NPV which was about 8.74% lower than 1% rate.
In short, organic production system in a greenhouse with thermal reflector screen (CVA and B), showed to be attractive for financing, mainly with resources from Pronaf, since it is a project with good monthly net financial profitability, associated with low production area requirements. The project’s long-term economic viability at interest rates above 3% (per year) was consistent; however, the payback period even at 1% per year rate was considered high (6.54 years) under financing conditions.
REFERENCES
ANEEL - AGÊNCIA NACIONAL DE ENERGIA ELÉTRICA. 2014. Accessed on June 5, 2014. Available at <http://www2.aneel.gov.br/ aplicacoes>.
ARAUJO, HF. 2015. Produção de minitomate em sistema orgânico em ambiente protegido. Campinas. Feagri/Unicamp. 197p. (PhD thesis)
ARAUJO, HF; LEAL, PAM; ZORZTO, TQ; NUNES, EF; BETIN, PS. 2016. Mini tomato production in organic system under greenhouse with partial control of meteorological elements. Revista Brasileira de Engenharia Agrícola e Ambiental 20: 800-805.
ARAUJO, HF; COSTA, RNT; CRISÓSTOMO, JR; SAUNDERS, LCU; MOREIRA, OC. 2013. Technical and economic indicators of the yellow passion fruit tree irrigated with underground water supply. Revista Brasileira de Engenharia Agrícola 34: 940-951. BLISKA JÚNIOR, A. 2011. Manejo de ambientes
protegidos: Estufas e casas de vegetação.
Revista Casa da Agricultura 14: 06-42.
CARVALHO, CRF; PONCIANO, NJ; SOUZA,
PM; SOUZA, CLM; SOUSA, EF. 2014.
Viabilidade econômica e de risco da produção de tomate no município de Cambuci-RJ,
Brasil. Ciência Rural 44: 2293-2299.
COSTA, RNT; LACERDA, CF; SILVA,
LAC; ARAÚJO, APB. 2010. Indicadores
de rentabilidade da recuperação de solos
sódicos. In: _____. Manejo da salinidade na agricultura: Estudos básicos e aplicados. 1.ed.
Table 3. Values of profitability indicators related to different interest rates for investment in
minitomate production. Campinas, Unicamp, 2013.
Evaluated variables Interest
rates (%) B/C NPV (R$)
IRR (%)
PV (years)
Greenhouse A
Soil beds
1 1.29 33,588.72 29.00 >10
3 1.21 24,021.93 21.22
5 1.13 15,517.21 13.96
9 1.00 1,057.77 0.98
Pots
1 1.24 28,388.69 24.43 >10
3 1.16 19,207.48 16.91
5 1.09 11,037.12 9.9
9 0.97 -2,876.58 -2.65
Greenhouse B
Soil beds
1 1.69 68,909.93 69.23 6.54
3 1.60 58,115.53 60.16
5 1.51 48,585.23 51.59
9 1.35 32,559.69 35.93
Pots
1 1.58 58,352.93 58.40 8.31
3 1.49 48,380.86 49.89
5 1.41 39,564.76 41.83
9 1.27 25,076.92 27.66
Greenhouse C
Soil beds
1 1.64 60,293.72 64.01 6.81
3 1.64 55,446.41 64.14
5 1.47 42,307.05 47.73
9 1.33 28,115.47 33.13
Pots
1 1.47 41,904.94 46.78 > 10
3 1.31 29,232.28 31.93
5 1.25 22,420.15 25.18
9 1.12 10,888.46 12.77
Fortaleza-CE: INCTSal, Cap. 24: 449-457. ENGINDENIZ, S; GÜL, A. 2009. Economic
analysis of soilless and soil-based greenhouse cucumber production in Turkey. Scientia Agrícola 66: 606-614.
HERNÁNDEZ, CM; RÍOS, PR; DIMAS, NR. 2008. Uso de sustratos orgánicos para la producción de tomate en invernadero. Agricultura Técnica en México 34: 69-74. HOFFMANN, R; ENGLER, JJC; SERRANO,
O; THAME, ACM; NEVES, EM. 1992.
Administração da Empresa Agrícola. São
Paulo: 7. ed. São Paulo: Pioneira, 325p.
LIBÂNIO, RA. 2010. Cultivares e densidade de plantio em cultivo orgânico de tomate. Minas Gerais. UFLA. 65p. (PhD thesis).
MACIEL, GM; SILVA, EC. 2014. Proposta metodológica para quantificação de acilaçúcares em folíolos de tomateiro.
Horticultura Brasileira 32: 174-177. M I G U E L , F B ; E S P E R A N C I N I , M S T;
OLIVEIRA, OJIMA, ALR; BÁRBARO, IM;
TICELLI, M. 2008. Análise de rentabilidade das culturas de alface e cenoura em sistema
orgânico de produção no município de bebedouro, estado de São Paulo, 2006.
Informações Econômicas 38: 52-58. MONTEIRO, ROC; COSTA, RNT; LEÃO, MCS;
AGUIAR, JV. 2007. Aspectos econômicos da
produção de melão submetidos a diferentes lâminas de irrigação e doses de nitrogênio.
Irriga 12: 364-376.
MDA - MINISTÉRIO DO DESENVOLVIMENTO
AGRÁRIO. 2014. Pronaf. Available at http:// www.mda.gov.br/sitemda/pronaf. Accessed October 13, 2014.
NEGRISOLI, RM; CECHINATTO, FH; BISSOLI, MJ; ROSESTOLATO, LLR; SABBAG, OJ.
2015. Viabilidade econômica no cultivo de minitomate sweet grape no município de
Casa Branca-SP. Enciclopédia Biosfera 11: 1932-1942.
PONCIANO, NJ; SOUZA, PM; MATA, HTC;
VIEIRA, JR; MORGADO, IF. 2004. Análise de viabilidade econômica e de risco da fruticultura na região norte fluminense. Revista de Economia e Sociologia Rural 42: 615-635. POTTER, L; LOBATO, JFP; MIELITZ NETO,
CG. 2000. Análises econômicas de sistemas de produção de novilhas de corte primíparas
aos dois, três e quatro anos de idade. Revista Brasileira de Zootecnia 29: 861-870. PRATES, M. 2014. Os números que mostram
o poder do agronegócio brasileiro. Revista Exame. Available at: http://exame.abril. com.br/economia/noticias/os-numeros-que-mostram-o-poder-do-agronegocio-brasileiro. Accessed January 26, 2016.
RAIJ, BV; CANTARELLA, H; QUAGGIO, JA; FURLANI, AMC. 1997. Recomendação de adubação e calagem para o Estado de São Paulo do Instituto Agronômico de Campinas, Campinas: Instituto Agronômico, 2º edição, 285p. (IAC. Boletim Técnico, 100). REIS, LS; AZEVEDO, CAV; ALBUQUERQUE,
AW; SILVA JÚNIOR, JF. 2013. Índice de área
foliar e produtividade do tomate sob condições
de ambiente protegido. Revista Brasileira de Engenharia Agrícola e Ambiental 17: 386-391. REZENDE, BLA; JÚNIOR, APB; CECÍLIO
FILHO, AB; PÔRTO, DRQ; MARTINS,
MIEG. 2009. Custo de produção e rentabilidade
das culturas de alface, rabanete, rúcula e repolho em cultivo solteiro e consorciado com
pimentão. Ciência Agrotecnica 33: 305-312.
SEUFERT, V; RAMANKUTTY, N; FOLEY, JA.
2012. Comparing the yields of organic and conventional agriculture. Nature 485: 229-232. SCHALLENBERGER, E; REBELO, JA;
MAUCH, CR; TERNES, M; PEGORARO, RA. 2008. Comportamento de plantas de
tomateiros no sistema orgânico de produção
em abrigos de cultivo com telas antiinsetos. Revista de Ciências Agroveterinárias 7: 23-29. ZANDONADI, DB; SANTOS, MP; MEDICI,
LO; SILVA, J. 2014. Ação da matéria orgânica e suas frações sobre a fisiologia de hortaliças.