____________________________________
1 Dr. Recursos Hídricos, Prof. do Departamento de Engenharia, Universidade Federal de Lavras, [email protected]. 2 Professor Pesquisador, Bolsista do Departamento de Engenharia, UFLA, [email protected].
3 Professor Pesquisador, Bolsista do Departamento de Ciências Florestais, UFLA, [email protected]. 4 Professor Pesquisador, Bolsista do Departamento de Engenharia, UFLA, [email protected]. 5 Dr. em Recursos Hídricos, Fundação Roge, [email protected].
Recebido pelo Conselho Editorial em: 18-5-2009
RIO GRANDE REGION, STATE OF MINAS GERAIS, BRAZIL
GILBERTO COELHO1, CARLOS R. DE MELLO2, JOSÉ L. P. DE REZENDE3,
ANTÔNIO M. DA SILVA4, ROBERTO DE MATTOS5
ABSTRACT: The Brazilian Law stipulates that water is a limited natural resource doted of economic value, thus it is necessary to develop mechanisms for its adequate management. Actions that encourage the farmers to apply soil conservation practices with the purpose of increase water yield from springs and to promote improvement of its quality, reducing production of sediment transportation, is being encouraged by governments, even with financial compensation for owners. From these assertions, this study aims to quantify the benefits of the conservation actions of the management units and to characterize a Water Yield Indicator (WYI) to support sustainable actions in the watershed of Alto Rio Grande region, in the state of Minas Gerais (MG). To assess the impact of actions it were identified four scenarios of land use and occupation of the watershed from Marcela stream which is located in Alto Rio Grande Region. After analyzing the results, it can be stated that the scenarios simulation has demonstrated important changes in water yield and that the definition of the Water Yield Index from the junction of the erosion potential with the water storage potential, has proved effective, as it integrate quantity and quality of water.
KEYWORDS: land use and occupation, water resources management, water producer program.
AVALIAÇÃO DE UM INDICADOR DE PRODUÇÃO DE ÁGUA EM UMA BACIA HIDROGRÁFICA NO ALTO RIO GRANDE - MG
RESUMO: A legislação brasileira estabelece que a água é um recurso natural limitado e dotado de valor econômico; logo, há necessidade de se criar mecanismos para sua adequada gestão. Medidas que estimulam os produtores rurais a adotarem práticas conservacionistas, visando a maior produção de água, melhoria de sua qualidade e redução da produção de sedimentos, vêm sendo estimuladas pelos governos, utilizando para isso até mesmo uma compensação financeira. A partir destas asserções, objetivou-se quantificar os benefícios das ações de conservação nas unidades de gestão e definir um Indicador de Produção de Água (IPA) para a tomada de decisão em uma bacia hidrográfica da região Alto Rio Grande-MG. Para avaliar o impacto das ações, foram definidos 4 cenários de uso e ocupação do solo da bacia hidrográfica do Ribeirão Marcela, localizada na UPGRH-GD1 (Alto Rio Grande). Após a análise dos resultados obtidos, chegou-se à conclusão de que as simulações de diversos cenários demonstraram alterações na produção de água e que a definição do Indicador de Produção de Água, a partir da junção do potencial de erosão com o potencial de armazenamento, demonstrou ser eficaz, pois integrou quantidade e qualidade de água.
INTRODUCTION
Water is a renewable natural resource of mineral origin, not only essential for the maintenance of life itself, but also for all activities performed by humans (LEAL, 1998).
Global demand for water grows steadily, but global supplies are limited and their availability becomes an issue of concern for an increasing number of countries (ALENCAR et al., 2006). There is also the fact that the quality of surface water is easily changed by the addition of effluent, such as high pollution load to the drainage system. The use of natural resources by humans in urban areas, in industry, agriculture, coupled with natural processes such as variation in precipitation, rock weathering and erosion change the quality of water, making them unsuitable for human consumption, recreation, industry and agriculture (ANDRADE et al., 2007).
Law 9.433 of January 8, 1997, which established the National Policy of Water Resources and created the National Water Resource Management, in its Art 1, paragraph II provides that - "Water is a limited natural resource endowed economic value”. This statement demonstrates the importance of establishing mechanisms that allow the preservation of this resource. It is not enough to establish rules to use it rationally, but to create instruments that encourage the most of its stay in the region where it is collected. The physical environment of choice for implementing this policy management is the watershed area, because it has a surface bounded by watersheds and integrated social and biogeophysical characteristics.
As SETTI et al. (2002), the best way to have access to water resources is through proper management and adequate political process. Therefore, management of water resources requires integrated planning procedures and administration. The importance of having a good Water Resources Management is that different types of demands are attended, a large amount of resources are available and large areas are covered. With the consequent increase in the number of projects and regions covered in them, the planning will anticipate future needs early enough so that they can be addressed when they occur (LANNA, 1999).
In this sense, SANTOS (2000) emphasizes the importance of Government's initiative to organize the management of water resources with the creation of the Water Resources Secretariat (SRH) under the Ministry of Environment, meaning the milestone to reverse this process. Constantly problems will worsen, which require special attention to achieve the economic and social development in a sustainable manner that provides the management of water resources, noting: (I) conservation, (II) preservation, (III) efficient use, (IV) social economic equity in the allocation of water resources among users, (V) improving the operation of surface water reservoirs, and (VI) improving monitoring and survey the quantity and quality of water.
Given the above, it is necessary to create tools that allow quantifying the benefits of the actions of farmers contributing to the temporal regulation of the water supply and consequent increase in water availability in the context of a watershed. Thus, it becomes important to develop models that demonstrate the potential contribution of the producers of water in a watershed, through the evaluation of a balance sheet, associating costs and benefits of productive activities that involve water as an input, this way facilitating that the conservation practices are encouraged through financial resources.
Therefore, the objectives of this research were to quantify the benefits of the actions in management units and set a Water Yield Indicator (WYI) for decision making in a watershed of the Alto Rio Grande, MG.
MATERIAL AND METHODS Characterization of the study area
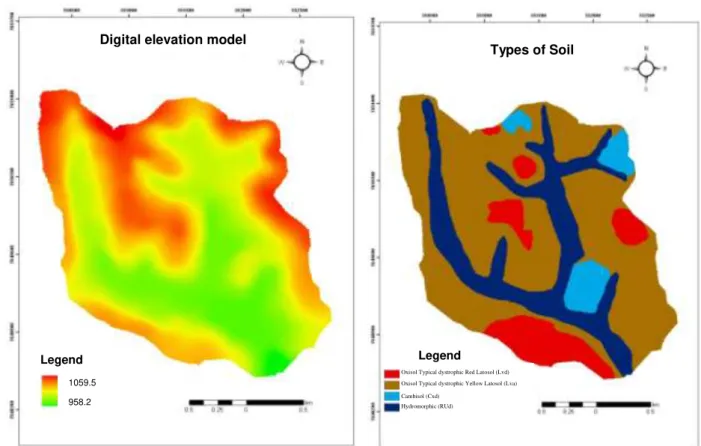
Minas Gerais. This creek drains an area of approximately 470 ha, right bank of the stream Jaguara, which empties directly into the reservoir of the Hydroelectric Plant Camargos/CEMIG. It lies between the geographical coordinates 21º14'24 "and 21º15'54" South latitude and 44º29'24" and 44º30'54" West longitude, being inserted in the fields of Campos das Vertentes Plateau Geomorphological Unit. These subwatersheds are located in the Alto Rio Grande, MG and belong to the Unit of Planning and Water Resource Management (UPGRH) of Alto Rio Grande (GD1).
The soils of the subwatershed of the Marcela stream (Figure 1b) are formed by 59.70% of typical dystrophic Red Yellow Latosol (LAd), occurring mainly in areas of steep slope, tops of the hills and foothills. The typical Oxisol (LVd) occupies about 11.62% of the watershed, occurring mixed with LAd. The Cambisols (CXD) occupy 5.87% of the area, being present in steeper places, as the lowlands (Rud) include wetlands, reflecting 22.82% of the area.
FIGURE 1. Digital elevation model and hydrography of Marcela b) Pedology of the subwatershed of Marcela strean.
The main economic activity of this subwatershed is dairy farming. It has throughout its length a total of seven farms, where 17 people live. They created 142 dairy cattle. The uptake of water supply is made near springs of the tributaries of the main creek. In Table 1 you can see the main use/land cover of the subwatershed soil of the Marcela stream.
TABLE 1. Uses and occupation of soil in the subwatershed of Marcela stream.
Current Use of Soil Area (ha) Percentage (%)
Pasture 354.78 75.49
Corn 79.73 16.96
Forest 19.83 4.22
Eucalyptus 9.13 1.94
Roads 3.27 0.70
Coffee 1.73 0.37
Sugarcane 1.53 0.33
Total 470.00 100.00
Source: GOMES (2008).
Digital elevation model
Types of Soil
Legend
1059.5
958.2
Legend
Oxisol Typical dystrophic Red Latosol (Lvd) Oxisol Typical dystrophic Yellow Latosol (Lva) Cambisol (Cxd)
Criteria for construction of the Water Yield indicator
The proposed criteria include aspects related to the quality and quantity of water. The aspect called water quality was obtained through a technique called Weighted Analytic Hierarchy Process (AHP) applied to the declivity maps, soil type and land use after their submission to Fuzzy Inference. To use the AHP technique is necessary to define weights for each integration variable. These weights should be defined according to the experience of experts, thus resulting in a potential indicator called erosion. The feature amount of water used data of total precipitation for rainfall-runoff event monitored in the studied watershed during the hydrological year 2006-2007, in other words, were selected rainfall events that caused runoff directly extracted as TUCCI (2005) and subtracted from the total evaporation of the same period. All maps have been submitted to Fuzzy Inference and followed the same sequence of the appearance quality, resulting in an indicator called Storage Potential. After defining the two indicators Potential Erosion and Potential Storage, defined the Water Yield Indicator (WYI), through integration of the AHP technique.
For the preparation of all maps on the characterization of planning unit it was used a geographic information system - GIS, more specifically the software SPRING 4.3.3, developed by the Brazilian National Institute for Space Research (INPE). The integration of the variables was made by Weighted Analytic Hierarchy Process, which is a decision support tool, available in the software SPRING 4.3.3, enabling the attainment of the WYI. The AHP technique is based on Weighted Fuzzy Inference (IFP); therefore, it became necessary to apply the Fuzzy Inference on all input variables. The general arrangement of the methodology is shown in Figure 2.
In the development of methods have been adopted the following assumptions:
- The watershed can be considered a single management unit, may also be subdivided into several management units, such as a subwatershed, the surroundings of a reservoir, a sub-region with similar characteristics, in accordance with MATTOS (2003);
- The management unit consists of a set of farms;
- The set of properties that is responsible for the production level in the water management unit.
Data survey of the management unit
The data needed to characterize the management unit, characteristics such as economic, environmental, physical, existence of conservation practices, changes in land use and forest remnants, were collected in field work and office. However, much of the information was obtained by analysis of previous studies by the research team of the Research Group of Water and Soil Engineering, Federal University of Lavras.
The characterization of the management unit is of fundamental importance because it is a tool that subsidizes the development of any analysis, because it accentuates potentialities and restrictions of the study areas.
In the following, it is presented the categories of classes used for each input variable of the quality and quantity aspects. The arrangement of declivity is defined in Table 2.
TABLE 2. Importance of classes of declivity on erosion processes.
Class Declivity
Low Up to 8%
Medium From 8 to 20%
High > 20%
Source: Adapted from ROSS (1994) apud RUHOFF (2004)
Table 3 shows the classes of soil erodibility, given the diffuse and concentrated runoff.
TABLE 3. Erodibility soil classes.
Class Soil
Low Red latosol, yellow latosol of clay texture, Yellow latosol, and Red-yellow latosol of medium clay texture
Medium Red-yellow latosol, Red nitosol, Chernosol, Red-yellow argisoil of medium clay texture
High Red-yellow argisoil of medium sandy texture, Udorthent, Cambisoil and Quartz Sands
Source: Adapted from ROSS (1994) apud RUHOFF (2004)
In Table 4 it is presented occurrences of erosion from the classes of use and land cover.
TABLE 4. Relationship between vegetation cover and erosion processes.
Class Soil Use
Low Forests and natural Woods with biodiversity, secondary woods, natural shrubs, savanna and shrublands
Medium Long-cycle crops, pastures with low cattle trampling, silviculture
High Low-density long-cycle crops, short-cycle crops, deforested areas, exposed soil, non-conservational agriculture
Source: Adapted from ROSS (1994) apud RUHOFF (2004)
To define rainfall, it was used data obtained from a meteorological station installed in the subwatershed of Marcela stream.
To define the runoff, it was used the empirical model developed by the United States Soil Conservation Service - SCS. The model takes into account the hydrological group and land cover type, hydrologic condition and antecedent moisture.
The reference evapotranspiration was calculated using the Penman method parameterized by FAO (ALLEN et al., 1998) (eq.(1)), as well as being the most used, takes into account the vegetation, in other words, is amended by use and soil management conducted in the basin. The Penman equation is shown below:
(1)
In which,
ETo - reference evapotranspiration, mm d–1; Rn - lawn total liquid radiation, MJ m-2 d-1; G - soil heat flow density, MJ m-2 d-1;
Tmed - air daily average temperature, 2 m high (°C); u2 - wind daily average speed, 2 m high, m s-1; es - daily average steam saturation pressure, kPa; ea - daily average steam current pressure, kPa;
s - declivity of the curve of steam pressure at Tmed, kPa °C-1, and
- psychrometric coefficient, kPa °C-1.
The values of wind speed, relative humidity and temperature were obtained from the meteorological station of the Marcela watershed that is managed by UFLA’s water and soil Group. The Rt and p values are tabulated and were extracted from (TUCCI, 1993).
Weighted Fuzzy Inference
It was carried out the process of applying the Fuzzy Logic on all maps for further integration of these using the AHP. The application of the Fuzzy inference on the input variables was performed in software SPRING 4.3.3 by means of programming routines performed in the tool LEGAL.
After applying the technique of Fuzzy inference on the input variables, it is possible to integrate them by using the decision support tool AHP. In this procedure, the different factors are analyzed and compared using a criterion of relative importance. For that, each parameter to be evaluated receives a value indicating the relative importance of the degree of importance for the water yield in the watershed. For integration of the variables it was used the decision support tool AHP, provided in the software SPRING 4.3.3.
Water yield indicator
Maps of the aspects Quality (Erosion Potential) and Quantity (Storage Potential) were integrated by AHP, resulting in the Water Yield Indicator of each rain event chosen. Table 5 presents the classes and the respective values of the indicator Water Yield.
TABLE 5. Water Yield Indicator (WYI).
Hierarchical Categories WYI
Very Weak 0 - 20%
Weak 20 - 40%
Medium 40 - 60%
Strong 60 - 80%
The division of hierarchical categories was defined by the author, since there is no criteria to establish a division. Therefore, there were five categories ranging from very weak to very strong, and the rate of water yield was divided into five equal intervals. However, it should be noted that this division can be changed according to each region studied, strategy managers to restrict or make more flexible applications.
Scenarios
In order to simulate the hydrological impacts resulting from changes in land use were used scenarios of use and occupation of land that represent trends in the region, especially the replacement of grassland by planting eucalyptus. Thus, we used three scenarios: 1-100% replacement of pasture by eucalyptus; 2- 25% as permanent preservation areas (forest) and 75% eucalyptus. 3- 25% as permanent preservation areas (forest) and 75% pasture.
The choice of Scenario 2 and 3 was based on compliance with Article 16, paragraph 6; subsection II of the Brazilian Forest Code of 1965, which concerns the area of permanent preservation and legal reserve. Adding the legal reserve to the permanent preservation of the subwatershed Marcela is that the area to be preserved corresponds to approximately 50% of the total area. Currently the subwatershed Marcela has approximately 4% Forest.
RESULTS AND DISCUSSION Erosion potential
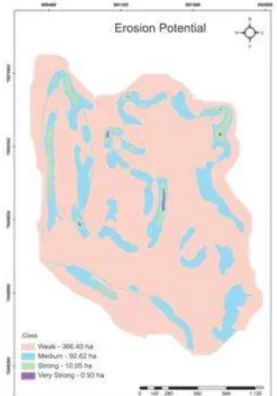
The Fuzzy Inference applied to all input variables relating to quality was obtained by integrating the data with the aid of the decision-making tool AHP, generating the map of potential erosion with a consistency ratio of 0.046 (Figure 3). The reason of consistency is provided by the system and, accordingly AHP specialists, it is desirable that this ratio is less than 0.1. It should be noted that the Erosion Potential Map submitted is the same for the four rain events selected of the subwatershed of Marcela stream. It is noted that the results obtained by subwatershed of the Marcela stream has most of its area in Class Weak regarding to erosion potential (78%). According to the Minas Gerais Ecological Economic Zone (EEZ), the potential for erosion in the southern region of Minas Gerais is mostly high and very high erosion potential, but the scale used for the preparation of (EEZ) is not is compatible with the scale used for this study, not enough to make comparisons.
As defined in the methodology, for defining the precipitation it was used four rain events, which data were obtained from the meteorological station installed in the subwatershed studied. Rainfall selected is shown in Table 6. In the selection of events, it was considered the rainiest day of January, March, May and July.
TABLE 61. Selected events for the subwatershed of Marcela stream.
Event Date Time (h) Duration (s)
Total Precipitated
(mm) 1 01/15/2007 7 p.m. - 9 p.m. 7200 36 2 03/17/2007 10 p.m. - 11 p.m. 3600 19 3 05/23/2007 5 p.m. - 10.45 p.m. 20700 23 4 07/23/2007 11 p.m. - 12 a.m. 3600 17
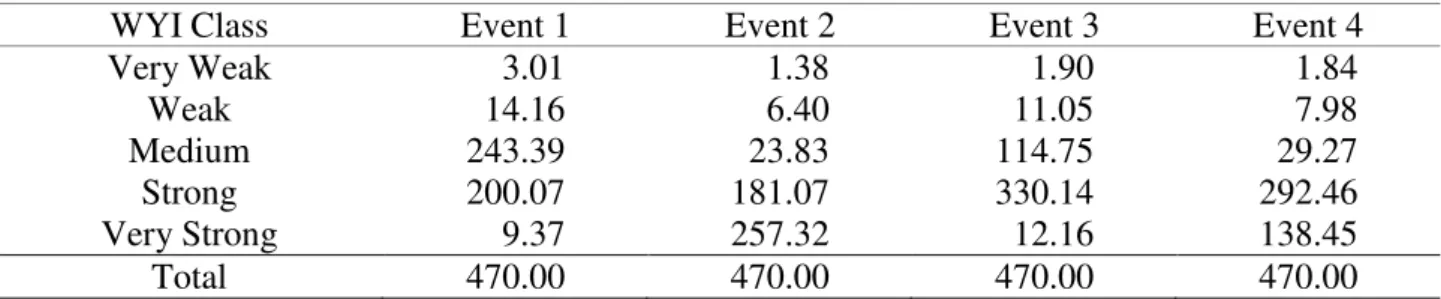
The results of the Water Yield Indicator for the subwatershed of Marcela stream considering each event of precipitation chosen are presented in Tables 7-10. For a better understanding of the Water Yield Indicator (WYI), the values were grouped into five classes of water, resulting in the areas shown in the tables above. This division allows planning and evaluating the implementation of actions to gradually.
TABLE 7. Division of areas by class of the WYI - current use (ha) of subwatershed of Marcela stream
WYI Class Event 1 Event 2 Event 3 Event 4 Very Weak 3.42 3.00 0.87 17.45
Weak 17.40 17.37 11.25 17.45 Medium 300.06 244.03 120.37 286.10 Strong 149.12 200.85 337.51 149.00
Very Strong - 4.75 - -
Total 470.00 470.00 470.00 470.00
TABLE 8. Division of areas by class of WYI - scenario 1 (ha) of subwatershed of Marcela stream. WYI Class Event 1 Event 2 Event 3 Event 4 Very Weak 2.96 3.04 0.88 3.23
Weak 13.35 14.74 8.97 14.29 Medium 242.05 260.35 86.65 243.30 Strong 191.01 187.24 363.77 189.05 Very Strong 20.63 4.63 9.73 20.13 Total 470.00 470.00 470.00 470.00
TABLE 9. Division of areas by class of WYI - scenario 2 (ha) of subwatershed of Marcela stream. WYI Class Event 1 Event 2 Event 3 Event 4 Very Weak 3.01 1.38 1.90 1.84
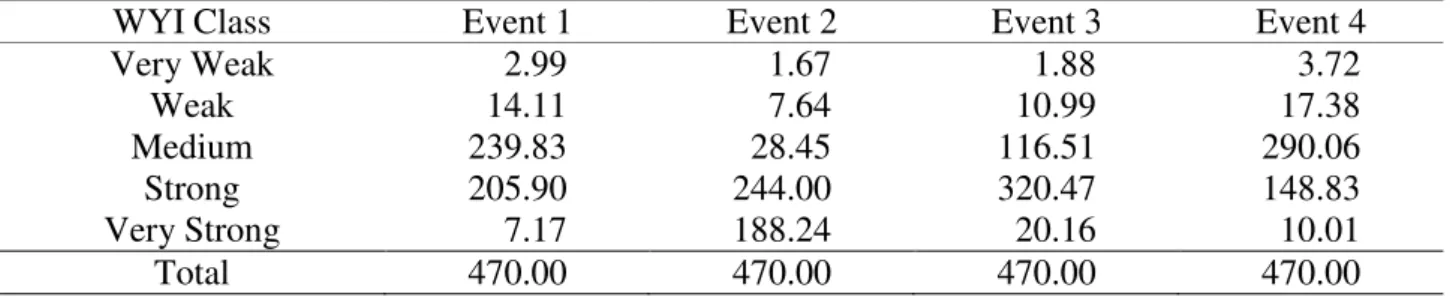
TABLE 10. Division of areas by class of WYI - scenario 3 (ha) of subwatershed of Marcela stream. WYI Class Event 1 Event 2 Event 3 Event 4 Very Weak 2.99 1.67 1.88 3.72
Weak 14.11 7.64 10.99 17.38 Medium 239.83 28.45 116.51 290.06 Strong 205.90 244.00 320.47 148.83 Very Strong 7.17 188.24 20.16 10.01 Total 470.00 470.00 470.00 470.00
Analyzing the results of the Water Yield Indicator (WYI) simulations for Current Use of subwatershed of the Marcela stream, it is noted a high water yield represented in all rain events studied. In Event 3, the Strong water yield class showed the largest area (337.51 ha), or 71% of the subwatershed of Marcela stream has strong potential for water yield, considering the current use. This situation is justified due to the low erosion potential, compared to the average storage potential. For the scenarios, the following is highlighted:
In the case of Scenario 1 (100% substitution of Pasture by Eucalyptus), it is verified that the third Event presented a higher area (363.77 h) in Strong water yield class in the yield of strong water, in other words, 77% of the subwatershed of the Marcela stream has strong potential for water yield. Making a comparison with the Current Use, there is an increase in Very Strong class in Scenario 1, showing that the change of 100% of pasture to eucalyptus contributed to the increase of water yield in the subwatershed of the Marcela stream. Other events continued standing out in the medium water yield class, in other words, none of the events showed a reduction of water yield after modification of the vegetation.
For Scenario 2 (considering 25% as a permanent preservation area, Forest, and 75% eucalyptus), it is verified again that the third event showed greater area (330.14 ha) in the Strong water yield class, in other words, 70% of the subwatershed of the Marcela stream has strong potential for water yield. Compared to the Current Use there is an increase in Very Strong class for Event 2 and changes in Event 4, from average yield in current use for strong yield in Scenario 2, showing that coverage with 75% eucalyptus and 25% forest contributed to the increase of water yield in the subwatershed of the Marcela stream.
In Scenario 3 (considering 25% as a permanent preservation area, forest, and 75% pasture), there is again a predominance of Event 3 showing the largest area (320.47 ha) in the Strong water yield class, in other words, 68% of the subwatershed of the Marcela stream has strong potential for water yield. Compared to the Current Use, there is an increase in Very Strong class in Scenario 3 and the second event a change from average yield in current use for strong yield in Scenario 3, showing that 75% coverage of pasture and 25% forest also contributed to the increase of water yield in the subwatershed of Marcela stream.
Generally, it appears that the largest difference was in Scenario 2 (75% Eucalyptus and 25% Forests); in which events 2 and 4 had a greater change in their water yield, in other words, an increased yield. Event 3, in all the simulations, remained without major changes, always highlighted as strong water yield. The relationship between quantity and quality showed that the soil cover combined with good management of that contribute to guarantee the availability of water in watersheds.
CONCLUSIONS
Water Yield Indicator obtained from the junction of the potential for erosion with the potential storage has proven effective for presenting results consistent with the reality of the watershed.
The production capacity of the water subwatershed of the Marcela stream is closely related to precipitation intensity, given that the third event of precipitation (less precipitation intensity) showed the largest classes of strong and very strong WYI, independent of the scenario.
The simulations of various scenarios showed changes in water yield, confirming that the form of management and soil conservation are fundamental to increase water yield in the watershed.
REFERENCES
ALENCAR, D.B.S. de; CÍCERO, L.; SILVA, C.L. da; OLIVEIRA, C.A. da S. Influência da precipitação no escoamento superficial em uma microbacia hidrográfica do Distrito Federal.
Engenharia Agrícola, Jaboticabal, v.26, n.1, p.103-112, 2006.
ALLEN, R.G.; PEREIRA, L.S.; PAES, D.; SMITH, M. Crop evapotranspiration: guidelines for
computing crop water requirements.Roma: FAO, 1998. 328 p. (Irrigation and Drainage Paper, 56). ANDRADE, E.M. de; ARAÚJO, L. de F.P.; ROSA, M.F.; DISNEY, W.; ALVES, A.B. Seleção dos indicadores da qualidade das águas superficiais pelo emprego da análise multivariada.Engenharia Agrícola, Jaboticabal, v.27, n.3, p.683-690, 2007.
BRASIL. Lei n. 4.771, de 15 de julho de 1965. Institui o novo Código florestal. Disponível em:
<http://www.planalto.gov.br/ccivil_03/Leis/L4771.htm>. Acesso em: 10 jun. 2007.
BRASIL. Lei n. 9.433, de 8 de Janeiro de 1997. Institui a Política Nacional de Recursos Hídricos,
cria o Sistema Nacional de Gerenciamento de Recursos Hídricos, regulamenta o inciso XIX do art. 21 da Constituição Federal, e altera o art. 1º da Lei n. 8.001, de 13 de março de 1990, que
modificou a Lei n. 7.990, de 8 de dezembro de 1989. Disponível em:
<http://www.planalto.gov.br/ccivil_03 /LEIS/L9433.htm>. Acesso em: 12 jun. 2007.
GOMES, N.M. Aplicação do LISEN (Limburg Soil Erosion Model) para simulação hidrológica em bacia hidrográfica Tropical. 2008. 191 f. Tese (Doutorado em Recursos Hídricos) - Universidade
Federal de Lavras, Lavras, 2008.
LANNA, A.E. Gestão das águas: reflexões a respeito de sua aplicação no Brasil. Porto Alegre:
UFGRS/Instituto de Pesquisas Hidráulicas, 1999. 235 p.
LEAL, M.S. Gestão ambiental de recursos hídricos: princípios e aplicações. Rio de Janeiro:
CPRM, 1998. 176 p.
MATTOS, R. Aplicação da contabilidade na gestão dos recursos hídricos. 2003. 250 f. Dissertação
(Mestrado em Engenharia da Energia) - Universidade Federal de Itajubá, Itajubá, 2003. RUHOFF, A.L. Gerenciamento de recursos hídricos em bacias hidrográficas: modelagem
ambiental com a simulação de cenários preservacionistas. 2004. 93 f. Dissertação (Mestrado em Geomática) - Universidade Federal de Santa Maria, Santa Maria, 2004.
SANTOS, D.G.A. Cobrança pelo uso da água. 2000.106 f. Dissertação (Mestrado em Gestão
Econômica do Meio Ambiente) - Universidade de Brasília, Brasília, 2000.
SETTI, A.A.; LIMA, J.E.F.W.; CHAVES, A.G.M.; PEREIRA, I.C. Introdução ao gerenciamento de recursos hídricos. 3.ed. Brasília: ANEEL/ANA, 2002. 327 p.
TUCCI, C.E.M. Hidrologia: ciência e aplicação. 4.ed. Porto Alegre: Universidade Federal do Rio
Grande do Sul - RS, 1993. 943 p.
TUCCI, C.E.M. Modelos hidrológicos. 2.ed. Porto Alegre: Universidade Federal do Rio Grande do