http://dx.doi.org/10.1590/1413-70542016404014216
Long-term phosphate fertilization, mycorrhizal inoculation and
historical land use influence on soybean growth and P uptake
Adubação fosfatada, inoculação micorrízica e histórico de uso do solo no crescimento da soja e absorção de P
Paulo Emílio Ferreira da Motta1, José Oswaldo Siqueira2, Bruno Teixeira Ribeiro3*, Lloyd Darrell Norton4, Sérgio Henrique Godinho Silva5, Nilton Curi3
1Empresa Brasileira de Pesquisa Agropecuária/Embrapa Solos, Rio de Janeiro, RJ, Brasil 2Instituto Tecnológico Vale, Belém, PA, Brasil
3Universidade Federal de Lavras/UFLA, Departamento de Ciência do Solo/DCS, Lavras, MG, Brasil 4USDA-ARS National Soil Erosion Research Laboratory, West Lafayette, IN, USA
5Universidade Federal de Lavras/UFLA, Lavras, MG, Brasil *Corresponding author: [email protected]
Received in April 15, 2016 and approved in June 16, 2016
ABSTRACT
Phosphorus is a key-nutrient in the fertility management of highly weathered tropical soils. So, this work was carried out with the objective
of evaluating the influence of the interaction between P doses, mycorrhizal inoculation and historical land use on soybean growth and P uptake in five Latosols (Oxisols) with contrasting chemical, physical and mineralogical properties under a continuous long-term phosphate fertilization (more than 15 years). The plants were cultivated in 4.5L-plastic pots containing 4 kg of soil in a completely randomized design, four replications and 2x2x2 factorial scheme with two P doses; and with or without mycorrhizal inoculation; and soils cultivated for long periods and non-cultivated (under native vegetation). There were two cultivations of ten weeks each. Shoot dry mass, P content and accumulation in
the shoot dry mass were evaluated after each cultivation period. The cultivation history reduced the response to P application and inoculation. The soybean response to inoculation was greater in cultivated soils and when the lower P dose was applied. The soybean response magnitude
to these variables was different among the studied Latosols. The mineralogical and chemical attributes of the Latosols were determinants. Index terms: Mycorrhiza; Latosols (Oxisols); available P; long-term cultivation.
RESUMO
O P é um nutriente chave no manejo da fertilidade de solos tropicais altamente intemperizados. Este trabalho foi conduzido com o objetivo de avaliar a influência da interação entre doses de P, inoculação micorrízica e histórico de uso do solo no crescimento da soja e absorção de P em cinco Latossolos com atributos físicos, químicos e mineralógicos contrastantes recebendo adubação fosfatada por longo período (> 15 anos). As plantas foram cultivadas em potes plásticos (4,5 L) contendo 4 kg de solo em um delineamento inteiramente casualizado, quatro repetições e esquema fatorial 2x2x2 correspondente a: duas doses de P; com e sem inoculação micorrízica; solos previamente cultivados e não cultivados (sob vegetação nativa). Foram realizados dois cultivos de dez semanas cada. Após cada um dos cultivos, avaliaram-se a massa seca da parte aérea, concentração e acúmulo de P na parte aérea. O cultivo do solo reduziu a resposta à aplicação de P e inoculação. A resposta da soja à inoculação foi maior nos solos cultivados e quando a menor dose de P foi aplicada. A magnitude dessas respostas foi diferente entre os Latossolos estudados, sendo os atributos mineralógicos e químicos dos Latossolos determinantes. Termos para indexação: Micorrizas; Latossolos; P disponível; cultivo do solo.
INTRODUCTION
In highly weathered tropical soils, such as Latosols (Oxisols), the nutrient phosphorus (P), beyond its natural deficiency in most cases (Lopes; Guilherme, 2016), have high adsorption by iron and aluminum oxides (Camargo et al., 2015; Rodrigues et al., 2016), making it less available to plants. The phosphate fertilization in the Brazilian Cerrado soils was one of the practices responsible for boosting agriculture in this biome (Lopes; Guilherme,
by the best management practices in soil fertility (Lopes; Guilherme, 2016).
In soil fertility management, several practices have been proposed and adopted for increasing the availability of phosphorus in the soil. This increase has direct agronomic, environmental and economic implications. The symbiotic association between mycorrhizal fungi and plant roots increases the root surface area and the soil volume explored and consequently the nutrient uptake, especially P (Bressan et al., 2001; Rooney et al., 2011; Sharif and Claassen, 2011; Smith et al., 2011; Zhao et al., 2015). In addition to increasing P uptake, the symbiosis between roots and mycorrhizal fungi can make plants more resistant to water stress (Zarik et al., 2016), stimulate biological nitrogen fixation (Whabi et al., 2016), increase tolerance to heavy metals (Hritozkova et al., 2016), promote soil aggregation (Leifheit; Verbruggen; Rillig, 2015) and even mitigate adverse effects of soil pH (Moreira; Siqueira, 2006). Therefore, the mycorrhizal fungi play an important role in the integrated management of soil fertility (Cozzolino; Meo; Piccolo, 2013).
The physiological and biochemical mechanisms of mycorrizal infections are not fully understood (Ramos et al., 2011) and, consequently, various plant responses may occur (Hart; Forsythe, 2012), especially if one considers the diversity of chemical, physical, biological and mineralogical soil properties. In addition, the fertilizer application and soil land use affect the mycorrizal inoculation (Qin et al., 2015). The effects of P source on mycorrizal inoculation were found by Covacevich, Marino and Echeverría (2006). Also, the soil P content affects the colonization and sporulation (Bressan et al., 2001; Covacevich; Echeverría; Aguirrezabal, 2007; Xie et al., 2014). The increased availability of soil P may lower mycorrhizal colonization (Covacevich; Echeverría; Aguirrezabal, 2007; Xu et al., 2014). Physiological and biochemical processes which self-regulate symbiosis seem to occur in plants well-nourished in P (Moreira; Siqueira, 2006).
Thus, the objective of this work was to evaluate soybean growth and P uptake influenced by phosphorus fertilization, with and without mycorrhizal inoculation in five Latosols (Oxisols) with contrasting chemical, physical and mineralogical properties cultivated for long periods (more than 15 years) and non-cultivated (under native vegetation).
MATERIAL AND METHODS
Five Latosols (Oxisols), cultivated for long periods and non-cultivated with contrasting chemical, physical and mineralogical properties were used for this study, being them dystrocohesive Yellow Latosol (LAx) developed
from sediments of Barreiras Formation (Aracruz, Espírito Santo State), dystrophic Yellow Latosol (LAd) developed from alteration of gneiss (Lavras, Minas Gerais State), acric Red Latosol (LVw) developed from sediments of Tertiary (Uberlândia, Minas Gerais State), dystroferric Red Latosol (LVdfg) developed from gabbro (Lavras, Minas Gerais State), and dystroferric Red Latosol (LVdft) developed from tuffite (Patos de Minas, Minas Gerais State). LAx and LAd presented sand clay and clay loam texture, respectively; LVdft presented clayey texture, whereas LVw and LVdfg, very clayey texture. LAd and LVw have been cultivated with annual crops for more than 15 years and the native vegetation comprises semicaducifolious tropical forest. LAx has been cultivated with annual crops (beans and corn) for more than 15 years and soil was covered with Panicum maximum during the three years prior to the soil sampling. LVdfg has been cultivated with annual crops for over 15 years and in the five years prior to soil sampling, soil was covered with Brachiaria decumbens. On these two soils, native vegetation consists of semiperinnial tropical forest. LVdft, in turn, has been cultivated with annual crops for over 15 years and, in the five years prior to soil sampling, soil was covered with Brachiaria decumbens, while the native vegetation was semicaducifolious tropical forest. All the soils were under the same management practices, which were annual phosphate fertilization and liming occasionally. In each soil, composite samples were collected at a depth of 0-20 cm under both native vegetation (non-cultivated - NC) and agricultural use (cultivated - C) for physical, chemical and mineralogical characterization (Empresa Brasileira de Pesquisa Agropecuária - Embrapa, 2011).
The physical characterization involved the
determination of clay, silt and sand content by the pipette method. The routine chemical characterization involved the determination of the following properties: pH in water (soil:water 1:2.5), P-Mehlich 1 and 3, P extracted by anion-exchange resin (P resine), Al3+, Ca2+, Mg2+, K+, H+Al, soil
organic carbon (SOC) and micronutrients (B, Cu, Fe, Mn e Zn). The chemical and mineralogical composition of the clay fraction was evaluated regarding the following methods: dithionite iron (Fed) (Embrapa, 2011); oxalate iron (Feo) (Schwertmann, 1964); SiO2, Al2O3, Fe2O3, TiO2 and P2O5 content after sulfuric acid digestion (Embrapa, 2011);
hematite and goethite by X-ray diffraction after iron oxide concentration (Kämpf; Schwertmann, 1982); kaolinite and gibbsite by differential thermal analysis in iron-free samples (Embrapa, 2011). The maximum P adsorption capacity of each soil (MPAC) was also determined according to Olsen and
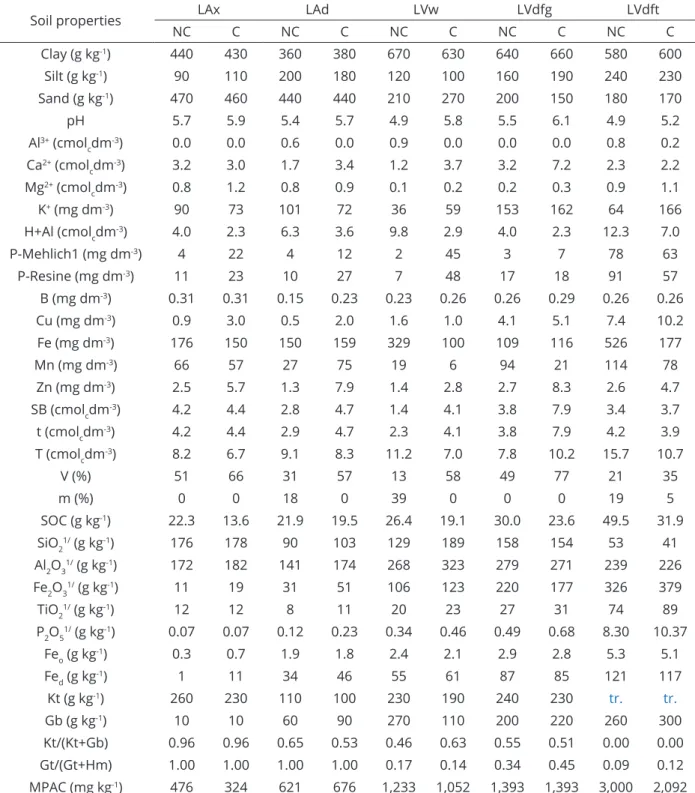
Table 1: Physical, chemical and mineralogical properties of Latosols used in the study before treatment application.
Soil properties LAx LAd LVw LVdfg LVdft
NC C NC C NC C NC C NC C
Clay (g kg-1) 440 430 360 380 670 630 640 660 580 600
Silt (g kg-1) 90 110 200 180 120 100 160 190 240 230
Sand (g kg-1) 470 460 440 440 210 270 200 150 180 170
pH 5.7 5.9 5.4 5.7 4.9 5.8 5.5 6.1 4.9 5.2 Al3+ (cmol
cdm
-3) 0.0 0.0 0.6 0.0 0.9 0.0 0.0 0.0 0.8 0.2
Ca2+ (cmol cdm
-3) 3.2 3.0 1.7 3.4 1.2 3.7 3.2 7.2 2.3 2.2
Mg2+ (cmol cdm
-3) 0.8 1.2 0.8 0.9 0.1 0.2 0.2 0.3 0.9 1.1
K+ (mg dm-3) 90 73 101 72 36 59 153 162 64 166
H+Al (cmolcdm-3) 4.0 2.3 6.3 3.6 9.8 2.9 4.0 2.3 12.3 7.0
P-Mehlich1 (mg dm-3) 4 22 4 12 2 45 3 7 78 63
P-Resine (mg dm-3) 11 23 10 27 7 48 17 18 91 57
B (mg dm-3) 0.31 0.31 0.15 0.23 0.23 0.26 0.26 0.29 0.26 0.26
Cu (mg dm-3) 0.9 3.0 0.5 2.0 1.6 1.0 4.1 5.1 7.4 10.2
Fe (mg dm-3) 176 150 150 159 329 100 109 116 526 177
Mn (mg dm-3) 66 57 27 75 19 6 94 21 114 78
Zn (mg dm-3) 2.5 5.7 1.3 7.9 1.4 2.8 2.7 8.3 2.6 4.7
SB (cmolcdm-3) 4.2 4.4 2.8 4.7 1.4 4.1 3.8 7.9 3.4 3.7
t (cmolcdm
-3) 4.2 4.4 2.9 4.7 2.3 4.1 3.8 7.9 4.2 3.9
T (cmolcdm
-3) 8.2 6.7 9.1 8.3 11.2 7.0 7.8 10.2 15.7 10.7
V (%) 51 66 31 57 13 58 49 77 21 35
m (%) 0 0 18 0 39 0 0 0 19 5
SOC (g kg-1) 22.3 13.6 21.9 19.5 26.4 19.1 30.0 23.6 49.5 31.9
SiO2
1/ (g kg-1) 176 178 90 103 129 189 158 154 53 41
Al2O31/ (g kg-1) 172 182 141 174 268 323 279 271 239 226
Fe2O31/ (g kg-1) 11 19 31 51 106 123 220 177 326 379
TiO21/ (g kg-1) 12 12 8 11 20 23 27 31 74 89
P2O51/ (g kg-1) 0.07 0.07 0.12 0.23 0.34 0.46 0.49 0.68 8.30 10.37
Feo (g kg
-1) 0.3 0.7 1.9 1.8 2.4 2.1 2.9 2.8 5.3 5.1
Fed (g kg-1) 1 11 34 46 55 61 87 85 121 117
Kt (g kg-1) 260 230 110 100 230 190 240 230 tr. tr.
Gb (g kg-1) 10 10 60 90 270 110 200 220 260 300
Kt/(Kt+Gb) 0.96 0.96 0.65 0.53 0.46 0.63 0.55 0.51 0.00 0.00
Gt/(Gt+Hm) 1.00 1.00 1.00 1.00 0.17 0.14 0.34 0.45 0.09 0.12
MPAC (mg kg-1) 476 324 621 676 1,233 1,052 1,393 1,393 3,000 2,092
pH: in water (soil/water ratio 1:2.5); SB: sum of bases; t: effective cation exchange capacity; T: potential cation exchange capacity at pH 7.0; V: bases saturation; m: aluminum saturation; SOC: organic carbon;1/: Oxides from sulfuric digestion; Fe
For the cultivation of soybean (Glycine max (L.) Merrill), variety CAC-1, an experiment was conducted using 4.5L-plastic pots (containing 4 kg of soil passed through 5mm sieve) in a greenhouse, adopting a completely randomized design with four replications in a 2x2x2 factorial scheme, as follows: i) factor H (use history): non-cultivated (native vegetation) (NC) and under cultivation for long periods (C); ii) factor P (P doses): P1 (lower dose) and P2 (higher dose); iii) factor I (mycorrhizal inoculation): no inoculation (NI) and inoculation (I).
For pot preparation, soil samples were liming aimed at raising base saturation to 60%, using dolomitic limestone with a Ca:Mg ratio of 4:1 and effective neutralizing value of 100%. The soil remained incubated for 45 days while maintaining a moisture content equivalent to 60% of the total pore volume. Basic fertilization was carried out in order to reach the following soil nutrient contents (mg kg-1): K (80); S (35); B (0.8); Fe (3.0); Cu (1.5); Mn (3.6); Zn (5.0); and Mo (0.15). These levels were reached through adding nutrient solutions, one for the macronutrients and another for micronutrients. The following sources, p.a., were used: NH4H2PO4, NH4NO3, K2SO4, H3BO3,
FeSO4.7H2O, CuSO4.5H2O, MnSO4.H2O, ZnSO4.7H2O and (NH4)6Mo7O24.4H2O. By varying the composition of the nutrient solutions, the above soil contents were obtained. Sufficiency of Ca and Mg were supplied via liming.
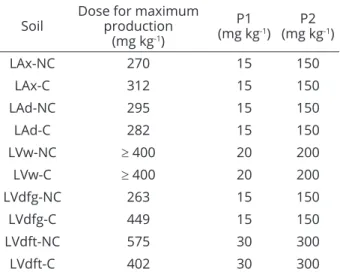
The P doses applied in each soil were based on the maximum phosphorus dose required for maximum corn dry mass production, obtained in a preliminary assay under greenhouse conditions. Table 2 shows the P doses used for each situation. The higher dose (P2) corresponds to 50% of the dose required for maximum output, and the lower dose (P1) corresponds to 5%. These doses were established in order to not inhibit mycorrhizae development (Paula; Siqueira, 1987), in the case of the highest dose, and a minimum quantity to not limit plant growth in the lowest dose.
After application of P doses and incubation, fumigation of the soil material was done with methyl bromide. After a ventilation period, mycorrhizal inoculation was performed in half of the soil pots, by the application of a 1 mL suspension containing spores of the mycorrhizal fungus Glomus etunicatum, prepared by the method of Gerdermann and Nicolson (1963). Approximately 300 spores were applied per pot in holes in the soil, which were also used for placement of the seeds. Four seeds were used and later reduced to two plants per pot by thinning. The soybean seeds were previously inoculated with Bradyrhizobium japonicum. After planting, the partial
recovery of the microbiota in all pots was conducted via inoculation with filtered extract prepared from the soil itself under conditions prior to fumigation.
Table 2: P doses used in the study (P1 and P2) as a function of the maximum dose for corn dry mass
production - preliminary test.
Soil Dose for maximum production
(mg kg-1)
P1
(mg kg-1)
P2
(mg kg-1)
LAx-NC 270 15 150
LAx-C 312 15 150
LAd-NC 295 15 150
LAd-C 282 15 150
LVw-NC ≥ 400 20 200
LVw-C ≥ 400 20 200
LVdfg-NC 263 15 150
LVdfg-C 449 15 150
LVdft-NC 575 30 300
LVdft-C 402 30 300
NC: non-cultivated; C: cultivated.
The experiment comprised two cultivations, maintaining the soil moisture at 60% of the total pore volume. After the first cultivation of 10 weeks duration (development stage R1/R2 - flowering), the plants were cut close to the ground, washed and dried in an forced air circulation oven for 72 hours at 60 °C. The roots also were removed to evaluate mycorrhizal colonization (Giovannetti; Mosse, 1980). Soil sampling for chemical characterization (as previously described) was also carried out.
Potassium and sulfur were replaced in the soil material remaining from the first cultivation, by applying 80 mg kg-1 of K
2SO4, then again planting and growing the second cultivation, which was also terminated at 10 weeks. As in the first cultivation, the shoot was sampled to obtain the dry mass and P content, roots to evaluate mycorrhizal colonization and soil for chemical characterization. The P content in shoot dry mass was determined by colorimetric molybdenum blue method (Embrapa, 2009). Accumulated P was calculated by: P content (mg kg-1) x shoot dry mass (kg).
inoculation and non-inoculation, and historical land use (cultivated or non-cultivated soils) on soybean shoot dry mass, P concentration in shoot dry mass and total accumulated P (1st + 2nd cultivation).
RESULTS AND DISCUSSION
Shoot dry mass (SDM)
For the first cultivation, in all soils, greater SDM was found with the highest P dose (P2) in non-cultivated soils (NC). In the absence of inoculation, the response was greater in LAx and LVdft, as can been seen for LAx, where was an increase in SDM from 10.71 to 32.07 g
(+200%) in the absence of inoculation, and from 20.05 to 30.68 g (+53%) in its presence (Table 3). For the second cultivation, the highest SDM was obtained with the P2 dose in the NC LAx and LVdft, the P2 dose in the LVw and P2 dose in inoculated LAd and LVdfg. The response to increasing P content in the soil varied considerably among soils, reflecting the difference in their chemical, physical and mineralogical properties (Motta et al. 2002). The greater response in the NC is due to lesser available soil P content (Table 4), which limited plant development. In the presence of inoculation, the responses were low and there were no differences in relation to the land use history in LAx. The LVdft soil showed a lower response to P, being lower in the non-cultivated soil.
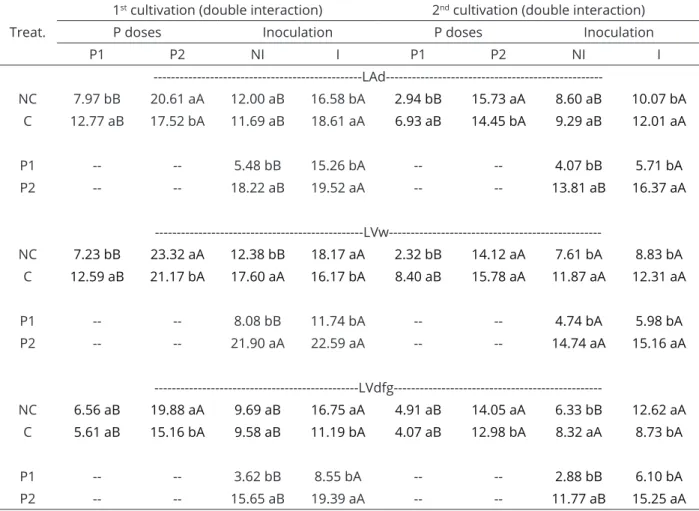
Table 3: Soybean shoot dry mass influenced by the interaction between historical land use (NC: non-cultivated;
C: cultivated for long periods), P doses (P1 and P2) and mychorrizal inoculation (NI: non-inoculated; I: inoculated) in five Latosols (Oxisols).
Treat.
1st cultivation (double interaction) 2nd cultivation (double interaction)
P doses Inoculation P doses Inoculation
P1 P2 NI I P1 P2 NI I
---LAd---NC 7.97 bB 20.61 aA 12.00 aB 16.58 bA 2.94 bB 15.73 aA 8.60 aB 10.07 bA
C 12.77 aB 17.52 bA 11.69 aB 18.61 aA 6.93 aB 14.45 bA 9.29 aB 12.01 aA
P1 -- -- 5.48 bB 15.26 bA -- -- 4.07 bB 5.71 bA
P2 -- -- 18.22 aB 19.52 aA -- -- 13.81 aB 16.37 aA
---LVw---NC 7.23 bB 23.32 aA 12.38 bB 18.17 aA 2.32 bB 14.12 aA 7.61 bA 8.83 bA
C 12.59 aB 21.17 bA 17.60 aA 16.17 bA 8.40 aB 15.78 aA 11.87 aA 12.31 aA
P1 -- -- 8.08 bB 11.74 bA -- -- 4.74 bA 5.98 bA
P2 -- -- 21.90 aA 22.59 aA -- -- 14.74 aA 15.16 aA
---LVdfg---NC 6.56 aB 19.88 aA 9.69 aB 16.75 aA 4.91 aB 14.05 aA 6.33 bB 12.62 aA
C 5.61 aB 15.16 bA 9.58 aB 11.19 bA 4.07 aB 12.98 bA 8.32 aA 8.73 bA
P1 -- -- 3.62 bB 8.55 bA -- -- 2.88 bB 6.10 bA
Treat.
1st cultivation (double interaction) 2nd cultivation (double interaction)
P doses Inoculation P doses Inoculation
P1 P2 NI I P1 P2 NI I
Triple interaction
P1 P2
NI I NI I
---LVdft---NC 15.70 bBx 25.86 aBx 28.87 aAx 31.41aAx 16.16 aB 21.12 aA 16.61 aB 20.67 aA
C 10.76 aBx 19.09 aBy 25.30 aAx 28.70aAx 12.20 bB 18.58 bA 14.34 aA 16.44 bA
P1 -- -- -- -- -- -- 11.47 bB 16.90 bA
P2 -- -- -- -- -- -- 19.49 aA 20.21 aA
---LAx---NC 10.71 bBy 20.05 aBx 32.07 aAx 30.68aAx 8.49 bB 20.28 aA 13.34 aB 15.43 aA
C 18.26 aBx 14.81 bBy 23.50 aAy 22.02aAy 11.67 aB 17.59 bA 14.34 aA 14.92 aA
P1 -- -- -- -- -- -- 9.07 bB 11.08 bA
P2 -- -- -- -- -- -- 18.60 aB 19.26 aA
Double interaction, A and B compare the mean values horizontally, and a and b, compare them vertically. In triple interaction, A and B compare the effect of P dose (horizontally, within the same historical land use and inoculation procedure), a and b compare the inoculation effect (horizontally, within the same P dose and historical land use, and x and y compare the historical land use effect (vertically, within the same P dose and inoculation procedure). Means followed by the same letters do not differ statistically by Tukey test at 5% probability.
Table 3: Continuation.
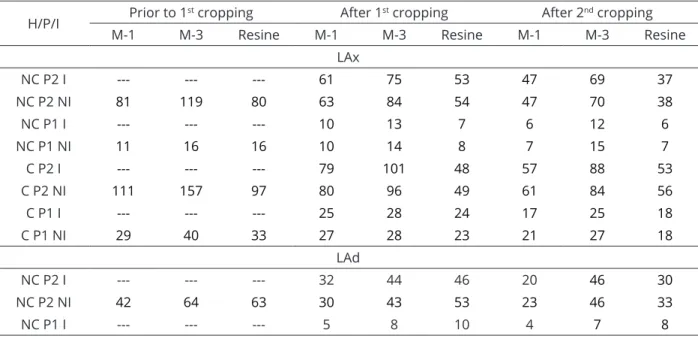
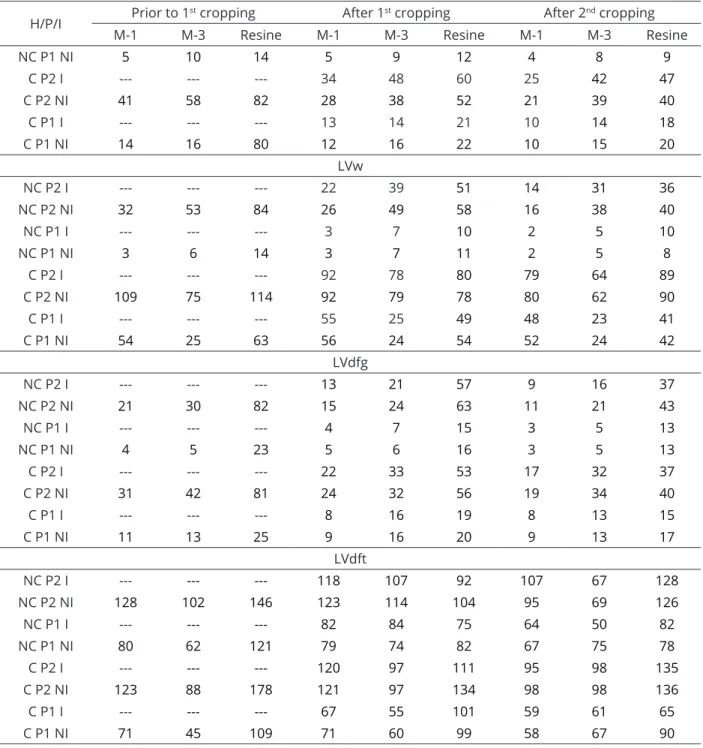
Table 4: P content in soils prior to the first soybean cultivation and after 1st and 2nd soybean cultivations.
H/P/I Prior to 1
st cropping After 1st cropping After 2nd cropping
M-1 M-3 Resine M-1 M-3 Resine M-1 M-3 Resine
LAx
NC P2 I --- --- --- 61 75 53 47 69 37
NC P2 NI 81 119 80 63 84 54 47 70 38
NC P1 I --- --- --- 10 13 7 6 12 6
NC P1 NI 11 16 16 10 14 8 7 15 7
C P2 I --- --- --- 79 101 48 57 88 53
C P2 NI 111 157 97 80 96 49 61 84 56
C P1 I --- --- --- 25 28 24 17 25 18
C P1 NI 29 40 33 27 28 23 21 27 18
LAd
NC P2 I --- --- --- 32 44 46 20 46 30
NC P2 NI 42 64 63 30 43 53 23 46 33
NC P1 I --- --- --- 5 8 10 4 7 8
H/P/I Prior to 1
st cropping After 1st cropping After 2nd cropping
M-1 M-3 Resine M-1 M-3 Resine M-1 M-3 Resine
NC P1 NI 5 10 14 5 9 12 4 8 9
C P2 I --- --- --- 34 48 60 25 42 47
C P2 NI 41 58 82 28 38 52 21 39 40
C P1 I --- --- --- 13 14 21 10 14 18
C P1 NI 14 16 80 12 16 22 10 15 20
LVw
NC P2 I --- --- --- 22 39 51 14 31 36
NC P2 NI 32 53 84 26 49 58 16 38 40
NC P1 I --- --- --- 3 7 10 2 5 10
NC P1 NI 3 6 14 3 7 11 2 5 8
C P2 I --- --- --- 92 78 80 79 64 89
C P2 NI 109 75 114 92 79 78 80 62 90
C P1 I --- --- --- 55 25 49 48 23 41
C P1 NI 54 25 63 56 24 54 52 24 42
LVdfg
NC P2 I --- --- --- 13 21 57 9 16 37
NC P2 NI 21 30 82 15 24 63 11 21 43
NC P1 I --- --- --- 4 7 15 3 5 13
NC P1 NI 4 5 23 5 6 16 3 5 13
C P2 I --- --- --- 22 33 53 17 32 37
C P2 NI 31 42 81 24 32 56 19 34 40
C P1 I --- --- --- 8 16 19 8 13 15
C P1 NI 11 13 25 9 16 20 9 13 17
LVdft
NC P2 I --- --- --- 118 107 92 107 67 128
NC P2 NI 128 102 146 123 114 104 95 69 126
NC P1 I --- --- --- 82 84 75 64 50 82
NC P1 NI 80 62 121 79 74 82 67 75 78
C P2 I --- --- --- 120 97 111 95 98 135
C P2 NI 123 88 178 121 97 134 98 98 136
C P1 I --- --- --- 67 55 101 59 61 65
C P1 NI 71 45 109 71 60 99 58 67 90
H: Historical land use (NC – non-cultivated, C – cultivated); P: doses of P (P2 - higher dose, P1 – lower dose); I: mychorrizal inoculation (I – inoculated, NI – non-inoculated); M-1 e M-3: P extracted by Mehlich-1 e Mehlich-3, respectively; Resine: P extracted by anionic exchange resin method.
Table 4: Continuation.
Due to increased P uptake capacity by the soybean roots associated with mycorrhizae and, therefore, the greater use of this P (Paula; Siqueira,
g in the absence of inoculation, whereas in its presence, SDM increased from 15.26 g to 19.52 g (Table 3). The smaller increase in the presence of inoculation occurred because SDM reached 15.26 g, even with the lowest P dose (P1) due to the effect of the mycorrhizal fungi on P uptake. In LAd, LVw and LVdfg, the response to P dose increased but was similar, being greater in NC than in cultivated soil (C) and in non-inoculated (NI) than in the inoculated (I), as can be seen for plants grown in LAd, in which this factor increased the SDM from 7.97 to 20.61 g (+158%) in the NC and from 12.77 to 17.52 g (38%) in the C. The greater response in the NC was due to the low P content (5 mg dm-3) (Table 4). In the LVdfg, the differences between NC and C were very small compared to the other soils.
In the second cultivation (Table 3), the response in LAx and LAd was greater in the non-cultivated soil than in the cultivated soil, and for LVdfg and LVdft, higher in the cultivated than in the NC. In all soils, the responses were greater in the absence of inoculation than in its presence, which indicates the effect of mycorrhizae in reducing the need for applied P. Mycorrhizal inoculation with
Asparagus officinallis L. decreased the P content in the soil necessary for the maximum shoot dry mass production (Xu et al., 2014). Thus, as in the first cultivation, the lesser responses to the elevated P doses also occurred for the LVdft. The response to increased P dose was more pronounced in the second cultivation due to the low SDM production in soils that received the lower P dose (P1), which was observed for LAd, LVw and LVdfg. In the LAd, the increase in P level increased the SDM from 7.97 g to 20.61 g in the NC and from 12.77 g to 17.52 g in the C, in the first cultivation (Table 3), corresponding to a 158% and 37% increase, whereas, in the second cultivation, the SDM went from 2.94 g to 15.73 g (+435%) in the NC and from 6.83 g to 14.45 g (+112%) at the C.
The response to P in the second cultivation was greater in I soils in relation to the NI (Table 3), but the difference between cultivation (1st or 2nd) was reduced
from the most kaolinitic to the most oxidic soils. The soils kaolinitic in character (Ct/Ct+Gb) decreases in the order: LAx>LAd>LVw = LVdfg>LVdft (Table 1). In the first cultivation, the response increased by over 500% in relation to the second cultivation, while in the second, it increased only 18%, which means that the LVdft, because of its higher total P content, and due to the more oxidic mineralogy, kept the SDM production more constant between the two cultivations.
In the first cultivation, the inoculation increased SDM in all soils, cultivation conditions, and P doses,
except in cultivated LVw and the LVw that received the highest P dose (P2) (Table 3). The magnitude of its effects varied among the soils. In LAd inoculation increased the SDM from 12.00 to 16.58 g (38%) in the NC and from 11.69 to 18.61 g (+59%) in C, while in the LVw these increases were 47% in the NC and there was no effect in the C. The effect of inoculation was greater with P1, as is the case for plants grown in LAd, the first cultivation, where the SDM increased from 5.48 to 15.26 g (+178%) at P1, whereas, with P2 it went from 18.22 to 19.52 g (7%). The interaction between the P content in soil and mycorrhization is also evident here. With the application of the lowest P dose (P1), the levels of this nutrient in the soil reached lower values (Table 4), 5 and 14 mg dm-3 in the NC and C, respectively, favoring a colonization of 56 to 49% (Table 5) and increased plant development. With increasing P content in soil there was lesser colonization, 35 and 24% in NC and C, and less effect on the SDM. In a study with wheat, it was found that the increase in P content in soil by 1 mg kg-1 decreased mycorrhizal colonization by 2.6% (Covacevich; Echeverría; Aguirrezabal, 2007). In soybean cultivation, the maximum mycorrhizal colonization occurred when applying doses between 15 and 30 mg kg-1 of P
2O5 (Paula; Siqueira, 1987).
As a function of the phosphate fertilization during the previous long-term growing period, there was a greater P availability in the cultivated soil and the response to the current application was lesser, resulting in increases of 49% and 29% in the presence and absence of inoculation, respectively. In P1, inoculation increased SDM from 10.71 to 20.05 g (+88%) in NC LAx and caused a 20% reduction in the C (Table 3). When P2 was applied, there was no response to inoculation.
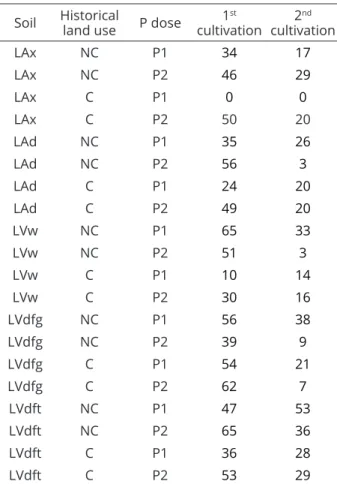
Table 5: Mychorrizal colonization in soybean (%) in the
studied soils as a function of historical land use and P doses in the two cultivations.
Soil Historical land use P dose cultivation1st cultivation2nd
LAx NC P1 34 17
LAx NC P2 46 29
LAx C P1 0 0
LAx C P2 50 20
LAd NC P1 35 26
LAd NC P2 56 3
LAd C P1 24 20
LAd C P2 49 20
LVw NC P1 65 33
LVw NC P2 51 3
LVw C P1 10 14
LVw C P2 30 16
LVdfg NC P1 56 38
LVdfg NC P2 39 9
LVdfg C P1 54 21
LVdfg C P2 62 7
LVdft NC P1 47 53
LVdft NC P2 65 36
LVdft C P1 36 28
LVdft C P2 53 29
NC: non-cultivated; C: cultivated; P: doses of P (P2 - higher dose, P1 – lower dose).
With the increased P dose, in the LAx the content of this nutrient reached 81 and 111 mg dm-3 (Table 4) in the NC and C, respectively. For the C, there was no colonization and for the NC, while 34% colonization was detected (Table 5), response to inoculation was not significant (Table 3). Under high soil P content and well-nourished plant conditions, a symbiosis self-regulation mechanism occurs (Moreira; Siqueira, 2006). In the LVdft-NC (Table 3) there was no response to inoculation in P2 due to the high P content in the soil (128 mg dm-3) (Table 3), which, however, did not prevent a 47% colonization (Table 4). At the lower P dose (P1), there was 65% colonization and SDM increased from 15.70 g to 25.86 g (65%), despite the high soil P content (82 mg dm-3). In the cultivated LVdft, the soil P content, with P1 and P2, were 71 and 120 mg dm-3, and even with 53 and 36% colonization, there was no response to inoculation (Table 3).
In the second cultivation (Table 3), inoculation increased soybean SDM in NC LAx, LVdfg and LVdft. In LVw, there was no response to inoculation regardless of land use history. Although there was colonization in the non-cultivated soils as well as in the non-cultivated, except for the cultivated LAx (Table 4), where there was no colonization due to higher P levels (Table 3), and there was no increase in SDM due to mycorrhizal colonization. In LVw and LVdft, there was no response to inoculation, whereas in LVdfg there was a similar response as in the first cultivation, i.e. there was an SDM increase at both P doses, this increase being greater, however, with the lower P dose. In LAd, in the first cultivation, there was also no response at the greater P dose, while in the second cultivation there was a 19% increase (Table 3). In the LVw, although there was response at the lower P dose in the first cultivation, this did not occur in the second. In the other soils, the response to inoculation in the absence of P was lesser in the second cultivation. The lowest response at the lower P dose (Table 3) is due to the reduction of the content of the nutrient in the soil by the first cultivation, which also reduced the effect of the mycorrhizal fungi. When comparing the SDM production in non-cultivated LAd and LVdf with the lowest P (7.97 and 6.56 g in the first cultivation and 2.94 and 4.91 g in the second), it was observed that although there was little difference between them in the first cultivation, the SDM reduction in the second cultivation (63 and 25%) was lesser in the LVdfg. Since the values of available P (Mehlich-1) of these soils were equal, around 5 mg dm-3, it is concluded that the LVdfg has a greater ability to maintain production due to its greater total P content. This is possibly because of its more oxidic make up. The same was observed when comparing the production of SDM in response to the lower P dose and to inoculation, the reduction in the second cultivation was 63% and 29% in LVd and LVdfg, respectively. The comparison for cultivated soils was limited by the large difference among the soil P contents.
Phosphorus in the soybean shoot dry mass
In the first cultivation, the greatest concentration of P in the soybean shoot dry mass occurred with the inoculation in LVdft (Table 6); with the higher P application in the LAx cultivated soil; with the inoculation and application of the lower P dose in inoculated and cultivated LAd, and the application of the higher P dose in LVw and LVdfg. The lowest values occurred in the lower P application in LAx; in non-inoculated LAd and LVdft soils and in non-inoculated and non-cultivated LVw and LVdfg soils.
In the second cultivation (Table 6), the highest shoot P values were reached with inoculation and application of the higher P dose in cultivated LAd; with the higher P dose in non-cultivated and cultivated LAx and LVw soil; with
the higher P dose in LVdfg, and application of the higher P dose and inoculation in LVdft soil. While the lowest P values occurred with inoculation and the application of the lower P dose in non-cultivated LAd; with P1 and non-cultivated LAx; with P1 in non-inoculated LVdfg and LVdft soil and with P1 in LVw.
In the first cultivation, the increased P dose increased P concentration in the soybean shoot in all soils, except in cultivated LAd and inoculated LVdfg, and the magnitude of the response varied with the historical land use and inoculation. In LAx, the P increased from 0.79 to 1.41g kg-1 (+ 78%) in the NC and from 1.06 to 3.74 g kg-1 (+253%) in the C (Table 6), these increases being inversely proportional to those of the SDM (159% and 37%, respectively) (Table 3), for this same combination of treatments, indicating a dilution effect.
Table 6: P content in soybean shoot dry matter influenced by the interaction between historical land use (NC:
non-cultivated; C: cultivated for long periods), P doses (P1 and P2) and mychorrizal inoculation (NI: non-inoculated; I: inoculated) in five Latosols (Oxisols).
1st Cultivation - Simple interaction 2nd Cultivation - Double interaction
Treatment P doses Inoculation
---LVdft--- P1 P2 NI I
NI 0.97 b
---LVdft---I 1.53 a
NC 1.30 a 1.17aA 1.24aA 1.03bB 1.38aA
C 1.20 a 1.21aA 1.34aA 1.25aA 1.30aA
P1 1.16 b -- -- 1.15aA 1.22bA
P2 1.34 a -- -- 1.13aB 1.46aA
---Double
interaction---
---LAx---NC 0.79bB 1.41bA 1.05bA 1.15bA 0.86bB 1.25bA 1.03bA 1.08bA
C 1.06aB 3.74aA 2.14aB 2.66aA 0.95aB 2.28aA 1.58aA 1.65aA
P1 0.83bB 1.02bA 0.86bA 0.94bA
P2 2.37aB 2.79aA 1.74aA 1.79aA
---Triple interaction---
---LVdfg---P1 P2
NI I NI I
---LVdfg---NC 0.68bBy 0.97aBy 0.92bAx 1.33aAx 0.74aB 0.97aA 0.77aB 0.94aA
C 0.77bBx 1.14aAx 0.88bAx 1.12aAy 0.74aB 0.90aA 0.80aA 0.84bA
1st Cultivation - Simple interaction 2nd Cultivation - Double interaction
Treatment P doses Inoculation
P1 0.68bB 0.80bA
P2 0.89aB 0.98aA
---LVw---NC 0.64bBy 0.78aBy 0.91bAy 1.54aAx 0.87aB 1.03bA 1.03aA 0.88bB
C 0.79bBx 0.96aBx 1.36aAx 1.40aAy 0.95aB 1.25aA 1.01aB 1.19aA
P1 0.95aA 0.87bA
P2 1.09aA 1.20aA
Triple interaction
---LAd---P1 P2
NI I NI I
NC 0.72aBx 0.72aBy 0.94aAx 0.99aAx 0.90aAx 0.64bBy 0.81aAx 0.91aAy
C 0.68bAx 1.10aAx 0.78bAy 0.98aBx 0.74bBy 0.85aBx 0.89bAx 1.10aAx
NC: non-cultivated; C: cultivated; P1: Low P dose; P2: High P dose; NI: non-inoculated; I: inoculated. In simple interaction, a and b compare the mean values within the treatments (inoculation, P dose, and historical land use). In double interaction, A and B compare the mean values horizontally, and a and b, compare them vertically. In triple interaction, A and B compare the effect of P dose (horizontally, within the same historical land use and inoculation procedure), a and b compare the inoculation effect (horizontally, within the same P dose and historical land use, and x and y compare the historical land use effect (vertically, within the same P dose and inoculation procedure). Means followed by the same letters do not differ statistically by Tukey test at 5% probability.
Table 6: Continuation.
In the second cultivation, the response to P increase in LAx was more pronounced in the cultivated soil, with the shoot P concentration increased from 0.95 to 2.28g kg-1 (+140%) (Table 6). In this same soil (non-cultivated) there was an increase from 0.86 to1.25 g kg-1 (+46%). An inversely proportional effect was also seen in the increase of soil P content on the shoot P concentration: to the increases in SDM of 139% and 51% (Table 3), in the NC and C corresponding to increases of 46% and 140% in the soybean shoot P concentration, respectively. The same was observed for LVw, where increases of 32% and 19% in the SDM phosphorus concentration corresponded to increases of 88 and 508% in the SDM in NC and C, respectively. In the LVw and LVdft, the response to P has occurred only in the presence of inoculation.
In the first cultivation, inoculation had no effect on the soybean shoot P concentration for NC and LAx (Table 6). In these same soils, the effect of inoculation was much less than that of P. Although having occurred in LAx and LAd, not always the greatest soybean shoot P concentration occurred with the highest soil P content.
For LVw and LVdfg, the greatest soybean shoot P concentration occurred with the application of the higher P dose in the presence of inoculation in non-cultivated soils, while the greatest content in the soil occurred in the cultivated soil (Table 4). In LVdft, the effect of inoculation on the soybean shoot P concentration was greater than that from the application of the higher P dose. Thus, there is a tendency towards an increase of the relative importance of the mycorrhizae on the soybean shoot P concentration from the more kaolinitic to the more oxidic soils. The fact of inoculation having influenced the soybean shoot P concentration in the LVdft (Table 6), but not the SDM (Table 3), suggests an over consumption of P.
In other study with sorghum and soybean cultivation, an exponential increase in the P concentration with P doses was observed in the presence of Glomus etunicatum inoculum. The P concentration increased by 48.2% in sorghum and by 49.3% in soybean (Bressan et al., 2001) at different P contents (10.4 to 95.5 mg kg-1). For soils cultivated with rice, inoculation with Glomus mosseae always contributed to greater shoot and root P concentrations (Covacevich; Echeverría; Aguirrezabal, 2007).
In LAx, LAd and LVdft, the greatest accumulated P values (1st + 2nd cultivations) occurred in the applications of
the higher P doses in cultivated LAx (96.34 mg) and with the lower dose of P in the presence of inoculated LAd and LVdft (36.06 and 78.01 mg, respectively), while the lowest occurred with the application of P1 in non-cultivated LAx soil (18.81 mg) and P1 in the absence of inoculation in LAd and LVdft (6.99 mg and 26.35 mg, respectively) (Table 7 ). In LVw and LVdfg, the lowest accumulated P values were in non-cultivated P1 soils with inoculation, while the greatest occurred with P2 and inoculation. The response in the LAx, LAd and LVdft was greater in non-cultivated soil and in the absence of inoculation (Table 7), which is due to, in a manner, similar to that observed for the SDM, with the lowest soil P content. In the LVdft, the greater response to P occurred in the cultivated soil (Table 7) in which the P content was lesser than in the non-cultivated.
In LAx, there was no effect of inoculation when the P2 was applied (Table 7). In the same cultivated soil, the P content (111 mg dm-3) (Table 4) inhibited the development of mycorrhizal fungi (Table 5), while in the non-cultivated soil, with a P content of 81 mg dm-3, there was colonization, probably due to that fact that many spores of mychorrhizae occurred in the uncultivated soil and not in the cultivated, but the effect of mycorrhizae on P uptake was not significant. Still, for the LAx, with the P1 dose, inoculation raised the accumulated P from 19.61 mg to 24.17 mg (+23%). In LVdft and LAd the effect, of inoculation was greater with P1 dose, with accumulated P in LAd going from 6.99 mg to 18.88 mg (+170%) and from 27.57 mg to 36.06 mg (+30%) at the P2 dose. In LVdt, these increases were 103% and 54%, respectively, with P1 and P2 (Table 7). The effect of the inoculation was greater in LVdfg under NC conditions, and, within this, under C conditions, greater with P1 than P2.
In the cultivated LVw, there was no effect of inoculation and for NC, the effect was greater with P1. It was thus observed, as with the SDM, an additional complementary effect between P dose and inoculation. The effect of a factor on the P uptake is always lesser in the presence of another factor.
Table 7: Total accumulated P (1st + 2nd cultivations) in
soybean shoot dry matter influenced by the interaction between historical land use (NC: non-cultivated; C: cultivated for long periods), P doses (P1 and P2) and mychorrizal inoculation (NI: non-inoculated; I: inoculated) in five Latosols (Oxisols).
Double Interaction
Treatment P doses Inoculation
P1 P2 NI I
---LAx---NC 18.81 bB 76.93 bA 44.20 bB 51.54 bA
C 24.97 aB 96.34 aA 62.27 aA 59.04 aA
P1 19.61 bB 24.17 bA
P2 86.86 aA 86.41 aA
---LVdft---NC 46.38 aB 67.37 aA 39.16 aB 74.58 aA
C 33.42 bB 61.24 bA 37.78 aB 56.88 bA
P1 26.35 bB 53.45 bA
P2 50.60 aB 78.01 aA
---LAd---NC 7.87 bB 33.49 aA 17.93 aB 23.43 bA
C 18.00 aB 30.14 bA 16.62 aB 21.52 aA
P1 6.99 bB 18.88 bA
P2 27.57 aB 36.06 aA
Triple interaction
P1 P2
NI I NI I
---LVw---NC 4.18 bBy 10.81 aBy 32.89 bAy54.02 aAx
C 16.70 aBx 21.02 aBx 48.92 aAx48.83 aAy
---LVdfg---NC 3.56 bBx 16.02 aBx 24.42 bAx 49.82 aAx
C 5.70 bBx 11.65 aBy24.66 bAx29.11 aAy
NC: non-cultivated; C: cultivated; P1: Low P dose; P2: High P
dose; NI: non-inoculated; I: inoculated. In double interaction, A and B compare the mean values horizontally, and a and b,
compare them vertically. In triple interaction, A and B compare
CONCLUSIONS
The soybean response, in terms of shoot dry mass production and P uptake, was influenced by the interaction between P doses, land use history, and mycorrhizal infections between the Latosols studied. The soil chemical and mineralogical attributes were determinants. Previous long-term soil cultivation reduced the response to P addition and mycorrhizal inoculation, and the magnitude of this reduction varied considerably between the soils. The response to P was lesser in inoculated plants. Response to mycorrhizal inoculation was greatly influenced by cultivation, with generally higher response in cultivated soils. Regardless of the soil, response to inoculation was greater when lesser P doses were applied.
REFERENCES
BRESSAN, W. et al. Fungos micorrízicos e fósforo, no
crescimento, nos teores de nutrientes e na produção
de sorgo e soja consorciados. Pesquisa Agropecuária
Brasileira, 36:315-323, 2001.
CAMARGO, L. A. et al. Mapping of clay, iron oxide and adsorbed phosphate in Oxisols using diffuse reflectance
spectroscopy. Geoderma, 251-252:124-132, 2015.
COMPANHIA NACIONAL DE ABASTECIMENTO - CONAB. Séries históricas. Available in: <http://www.conab.
gov.br/conteudos.php?a=1252&t=2>. Access in: June, 13, 2016.
COVACEVICH, F.; ECHEVERRÍA, H. E.; AGUIRREZABAL, L. A. N. Soil available phosphorus status determines indigenous
mycorrhizal colonization of field and glasshouse grown
spring wheat from Argentina. Applied Soil Ecology, 35:1-9, 2007.
COVACEVICH, F.; MARINO, M. A.; ECHEVERRÍA, H. E. The
phosphorus source determines the arbuscular mycorrhizal potential and the native mycorrhizal colonization of tall
fescue and wheatgrass. European Journal of Soil Biology, 42:127-138, 2006.
COZZOLINO, V.; MEO, V. D.; PICCOLO, A. Impact of arbuscular
mycorrhizal fungi applications on maize production and
soil phosphorus availability. Journal of Geochemical
Exploration, 129:40-44, 2013.
EMPRESA BRASILEIRA DE PESQUISA AGROPECUÁRIA –
EMBRAPA. Manual de análises químicas de solos,
plantas e fertilizantes. 2. ed.Brasília, Embrapa Informação Tecnológica, 2009. 627p.
EMPRESA BRASILEIRA DE PESQUISA AGROPECUÁRIA –
EMBRAPA. Manual de métodos de análise de solo. 2. ed. Rio de Janeiro, Embrapa Solos, 2011. 230p.
FITTER, A. H. Costs and benefits of mycorrhizas: Implications for functioning under natural conditions. Experientia, 47:350-355, 1991.
GERDERMANN, J. W.; NICOLSON, T. H. Spores of mycorrhizal Endogone species extracted from soil by wet sieving and
decanting. Transactions of the British Mycological
Society, 46:235-244, 1963.
GIOVANNETTI, M.; MOSSE, B. An evaluation of techniques for
measuring vesicular-arbuscular mycorrhizal infection in
roots. New Phytology, 84:484-500, 1980.
HART, M. M.; FORSYTHE, J. A. Using arbuscular mycorrhizal
fungi to improve the nutrient quality of crops: Nutritional
benefits in addition to phosphorus. Science Horticulturae,
148:206-214, 2012.
HRITOZKOVA, M. et al. Contribution of arbuscular mycorrhizal
fungi in attenuation of heavy metal impact on Calendula officinalis development. Applied Soil Ecology, 101:57-63, 2016.
KÄMPF, N.; SCHWERTMANN, U. The 5M-NaOH concentration
treatment for iron oxides in soils. Clays and Clay Minerals, 30:401-408, 1982.
LEIFHEIT, E. F.; VERBRUGGEN, E.; RILLIG, M. C. Arbuscular mycorrhizal fungi reduce decomposition of woody plant
litter while increasing soil aggregation. Soil Biology and Biochemistry, 81:323-328, 2015.
LOPES, A. S.; GUILHERME, L. R. G. A career perspective on soil
management in the Cerrado region of Brazil. Advances in Agronomy, 137:1-72, 2016.
MOREIRA, F. M. S.; SIQUEIRA, J. O. Microbiologia e bioquímica
do solo. 2ª Ed. Editora UFLA, Lavras, 2006. 729 p.
MOTTA, P. E. F. et al. Adsorção e formas de fósforo em Latossolos: influência da mineralogia e histórico de uso. Revista Brasileira de Ciência do Solo, 26:349-359, 2002.
OLSEN, S. R.; WATANABE, F. S. A method to determine a
phosphorus adsorption maximum capacity of soils as
measured by the Langmuir isotherm. Soil Science Society of America Proceedings, 21:144-149, 1957.
PAULA, M. A.; SIQUEIRA, J. O. Efeito de micorrizas vesicular-arbusculares no crescimento, nodulação e acúmulo de
QIN, H. et al. Long-term fertilizer application effects on the soil, root arbuscular mycorrhizal fungi and community
composition in rotation agriculture. Applied Soil Ecology, 89:35-43, 2015.
RAMOS, A. C. et al. An outlook on ion signaling and ionome
of mycorrhizal symbiosis. Brazilian Journal of Plant Physiology, 23:79-89, 2011.
RODRIGUES, M. et al. Legacy phosphorus and no tillage agriculture in tropical oxisols of the Brazilian savanna. Science of the Total Environment, 542:1050-1061, 2016.
ROONEY, D. C. et al. Effect of arbuscular mycorrhizal colonization on the growth and phosphorus nutrition of
Populuseur americana c.v. Ghoy. Biomass and Bioenergy, 35:4605-4612, 2011.
SALVAGIOTTI, F. et al. Nitrogen uptake, fixation and response to fertilizer N in soybeans: A review. Field Crops Research, 108:1-13, 2008.
SCHWERTMANN, U. Differenzienrung der Eisenoxide des Bödens durch Extraktion mit Ammoniumoxalat-lösung. Z. Pflanzenernahr. Und Bodenkd, 105:105-202, 1964.
SHARIF, M.; CLAASSEN, N. Action mechanisms of arbuscular
mycorrhizal fungi in phosphorus uptake by Capsicum annum L. Pedosphere, 21:502-511, 2011.
SMITH, S. E. et al. Roles of arbuscular mycorrhizas in plant phosphorus nutrition: Interactions between pathways of
phosphorus uptake in arbuscular mycorrhizal roots have
important implications for understanding and manipulating plant phosphorus acquisition. Plant Physiology, 156:1050-1057, 2011.
WHABI, S. et al. Enhaced transfer of biologically fixed N from faba bean to intercropped wheat through mycorrhizal
symbiosis. Applied Soil Ecology, 107:91-98, 2016.
XIE, X. et al. Effects of arbuscular mycorrhizal inoculation and phosphorus supply on the growth and nutrient uptake of Kandelia obovata (Sheue, Liu and Yong) seedlings in
autoclaved soil. Applied Soil Ecology, 75:162-171, 2014.
XU, P. et al. Response of soils phosphorus required for maximum growth of Asparagus officinalis L. to inoculation of arbuscular
mycorrhizal fungi. Pedosphere, 24:776-782, 2014.
ZARIK, L. et al. Use of arbuscular mycorrhizal fungi to improve
the drought tolerance of Cupressus atlantica G. Comptes Rendus Biologies, 339:185-196, 2016.
ZHAO, R. et al. Arbuscular mycorrhizal fungi affect the growth, nutrient uptake and water status of maize (Zea mays L.)
http://dx.doi.org/10.1590/1413-70542017411000001
ERRATUM
In the manuscript entitled “Long-term phosphate fertilization, mycorrhizal inoculation and historical land use influence on soybean growth and P uptake”, with the DOI number: http://dx.doi.org/10.1590/1413-70542016404014216, published in the period Ciência e Agrotecnologia, 40(4)418-431, page 426:
Where it read:
Table 5: Mychorrizal colonization in soybean (%) in the
studied soils as a function of historical land use and P doses in the two cultivations.
Soil Historical
land use P dose
1st
cultivation 2nd
cultivation
LAx NC P1 34 17
LAx NC P2 46 29
LAx C P1 0 0
LAx C P2 50 20
LAd NC P1 35 26
LAd NC P2 56 3
LAd C P1 24 20
LAd C P2 49 20
LVw NC P1 65 33
LVw NC P2 51 3
LVw C P1 10 14
LVw C P2 30 16
LVdfg NC P1 56 38
LVdfg NC P2 39 9
LVdfg C P1 54 21
LVdfg C P2 62 7
LVdft NC P1 47 53
LVdft NC P2 65 36
LVdft C P1 36 28
LVdft C P2 53 29
NC: non-cultivated; C: cultivated; P: doses of P (P2 - higher dose, P1 – lower dose).
Read:
Table 5: Mychorrizal colonization in soybean (%) in the
studied soils as a function of historical land use and P doses in the two cultivations.
Soil Historical land use P dose cultivation1st cultivation2nd
LAx NC P2 34 17
LAx NC P1 46 29
LAx C P2 0 0
LAx C P1 50 20
LAd NC P2 35 26
LAd NC P1 56 3
LAd C P2 24 20
LAd C P1 49 20
LVw NC P2 65 33
LVw NC P1 51 3
LVw C P2 10 14
LVw C P1 30 16
LVdfg NC P2 56 38
LVdfg NC P1 39 9
LVdfg C P2 54 21
LVdfg C P1 62 7
LVdft NC P2 47 53
LVdft NC P1 65 36
LVdft C P2 36 28
LVdft C P1 53 29