Palavras chave: Eucalyptus urograndis
Volume individual de madeira Seleção de atributos Neossolo Quartzarênico Árvore de decisão Histórico: Recebido 12/01/2017
Aceito 04/05/2017 Keywords: Eucalyptus urograndis
Individual wood volume Feature selection Entisol quartzipsamment soil Decision tree
1Universty of Campinas - Campinas, São Paulo, Brazil 2 Paulista State University - Jaboticabal, São Paulo, Brazil 3 Brasilian Agricultural Research - Campinas, São Paulo, Brazil +Correspondência:
DOI: 10.1590/01047760201723022296
Elizeu de Souza Lima
1+, Zigomar Menezes de Souza
1, Rafael Montanari
2, Stanley Robson
de Medeiros Oliveira
3, Lenon Henrique Lovera
1, Camila Viana Vieira Farhate
1CLASSIFICATION OF THE INITIAL DEVELOPMENT OF EUCALIPTUS USING
DATA MINING TECHNIQUES
ABSTRACT:
Eucalyptus
plantation has expanded considerably in Brazil, especially in regions
where soils have low fertility, such as in Brazilian Cerrados. To achieve greater productivity,
it is essential to know the needs of the soil and the right moment to correct it. Mathematical
and computational models have been used as a promising alternative to help in this
decision-making process. The aim of this study was to model the influence of climate and
physico-chemical attributes in the development of
Eucalyptus urograndis
in Entisol quartzipsamment
soil using the decision tree induction technique. To do so, we used 30 attributes, 29 of them
are predictive and one is the target-attribute or response variable regarding the height of the
eucalyptus. We defined four approaches to select these features: no selection,
Correlation-based Feature Selection (CFS), Chi-square test (
χ
2) and Wrapper. To classify the data, we
used the decision tree induction technique available in the Weka software 3.6. This data
mining technique allowed us to create a classification model for the initial development of
eucalyptus. From this model, one can predict new cases in different production classes,
in which the individual wood volume (IWV) and the diameter at breast height (DBH) are
crucial features to predict the growth of
Eucalyptus urograndis
, in addition to the presence
of chemical soil components such as: magnesium (Mg
+2), phosphorus (P), aluminum (Al
+3),
potassium (K
+), potential acidity (H + Al), hydrogen potential (pH), and physical attributes
such as soil resistance to penetration and related to climate, such as minimum temperature.
CLASSIFICAÇÃO DO DESENVOLVIMENTO INICIAL DO EUCALIPTO
UTILIZANDO TÉCNICAS DE MINERAÇÃO DE DADOS
RESUMO:
O cultivo de eucalipto tem se expandido consideravelmente no Brasil, sobretudo
em regiões em que os solos apresentam baixa fertilidade, como nos Cerrados brasileiros.
Para alcançar maiores produtividades, é fundamental saber a necessidade e o momento
adequado para correção do solo. Para auxiliar esse processo de tomada de decisão, modelos
matemáticos e computacionais têm sido utilizados e são uma alternativa promissora. O
objetivo deste trabalho foi modelar a influência dos atributos físico-químicos do solo e
climáticos no desenvolvimento do
Eucalyptus urograndis
em Neossolo Quartzarênico, por
meio da técnica de indução da árvore de decisão. Para isso foram utilizados 30 atributos, sendo
29 preditivos e um atributo-meta ou variável resposta, a saber, a altura do eucalipto. Foram
avaliadas quatro abordagens para seleção de atributos: sem seleção, seleção de atributos
baseado em correlação (CFS), método do Qui-quadrado (
χ
2) e Wrapper. Para classificar os
dados foi utilizada a técnica de indução de árvore de decisão por meio do software Weka
3.6. As técnicas de mineração de dados através da indução de árvore de decisão permitem
o desenvolvimento de um modelo de classificação do desenvolvimento inicial de eucalipto
eficiente para previsão de novos casos em diferentes classes de produção, onde o volume
individual de madeira (VOL) e o diâmetro altura do peito (DAP) são atributos determinantes
para previsão do crescimento do Eucalyptus urograndis, além de atributos químicos do solo
como: Magnésio (Mg
+2), Fósforo (P), Alumínio(Al
+3), potássio (K
+), acidez potencial (H
+Al)
MINING TECHNIQUES
INTRODUCTION
The plantation of
Eucalyptus spp
in Brazil has
increased in recent years because of the following reasons:
quick growth, diversification in the use of wood and the
ease of adapting to different soil and climate conditions.
This fact makes commercial plantations of eucalyptus in
Brazil quite variable and productive, which contributes
to the recognition of the country as the one with the best
technologies in eucalyptus plantation currently, reaching
around 60 m
3.ha
-1average productivity in rotations of
seven years (SFB, 2016).
Increases in the production of wood led the Brazilian
sector of pulp and paper to stand out in the world’s forest
area as the fourth biggest productor of pulp, the ninth
biggest productor of paper, in addition to being the 13th
biggest in the consumption of paper per capita, totaling 220
companies of pulp and paper with forest activities in 540
cities located in 18 states (TOLEDO et al., 2015).
However, eucalyptus trees have been planted in
regions of Cerrado, whose soils are predominantly highly
weathered and acid, with low nutrient availability, low
aggregation, exposed to prolonged dry seasons, which
can lead to decreased productivity of wood (BARBOSA
et al., 2012). To avoid decreases in productivity, it is
necessary to use monitoring and evaluation methods to
determine which are the variables that most affect the
development and productivity of
Eucalyptus
.
The use of computational systems in the decision
making of commercial plantations of eucalyptus is an
interesting strategy. The reason is that those systems
can make the sector increase even more, since it allows
the evaluation of large amounts of information on soils
and plants, which can lead to new findings and most
appropriate strategies to increase productivity and
environmental protection.
Among the computational techniques used to
interfere in the development of eucalyptus, due to
heterogeneity found in the soil, data mining techniques
aim to find patterns in large amount of data to infer a
dependent variable from a set of features associated with
this variable (CRIVELENTI et al., 2009).
Among the data mining techniques, decision
tree induction is a method very simple and efficient,
because it allows the classification of data sets consisted
of numerical and categorical variables. In addition, the
knowledge found in a decision tree is represented by
rules and the algorithm achieves satisfactory results when
compared with other more sophisticated approaches
available in the literature (HAN et al., 2011). That is why
decision tree induction is seen as a promising approach in
data analysis (SOUZA et al., 2010).
A decision tree is
a flowchart
-like structure that
shows the various outcomes from a series of decisions.
It is formed of nodes connected by branches and leaves.
Nodes represent the variables in the data file analyzed,
while the branches between the nodes represent logical
tests conducted for the separation of data. The first node
is called root node and it is the main one in the decision
tree. Nodes located below the main node are connected
by branches. Leaves are the regions associated with a
label or value of the terminal node (WITTEN et al., 2011).
Decision tree operation occurs with the division of a set
into subsets of data in a recursive way. The separation of
data occurs until each subset is homogeneous, i.e, with
cases of one single class (WITTEN et al., 2011).
The main advantages of using a decision tree
include the support in a decision-making process, which
considers the most relevant attributes, and the facility of
interpretation and understanding of the results, because
the classification is obtained explicitly, simplifying
its interpretation and allowing users to know which
attributes influence the development of eucalyptus. In
addition, the results are usually supplied quickly due to
the computational efficiency provided by this technique
(DAI et al., 2016; HAN et al., 2011).
In this context, this work aimed at modeling the
influence of physico-chemical attributes of the soil and climate
ones in the development of
Eucalyptus urograndis
in Entisol
quartzipsamment soil by using the decision tree technique.
MATERIAL AND METHODS
Area of study
The study was carried out in the 2014/2015
agricultural year, in the experimental area of Farm Bom
Retiro, owned by Eldorado Brazil Celulose, located
in Três Lagoas, state of Mato Grosso do Sul, Brazil, at
latitude 20
o27’S and longitude 52
o29’W, with an annual
average rainfall of 1300 mm and average temperature of
23.7°C. The climate type is A
w, according to the Köppen
classification, being characterized as tropical humid with
a rainy weather during summer and dry one during
winter. The experimental area is under cultivation of
Eucalyptus urograndis.
The soil was classified as Entisol
quatzipsamment soil (EMBRAPA, 2013).
Collection and determination of dendrometric
and soil attributes
individually sampled and soil attributes were determined in
the vicinity of each tree. Thus, we had a database with 300
observations for each plant and soil attribute.
The dendrometric attributes evaluated were:
individual height of eucalyptus trees (IHE), diameter
at breast height (DBH), and determined the volume
(IWV). The cubing occurred with the tree standing. The
collection of data on tree heights was performed with a
clinometer and DBH was collected at 1.300 m hight from
the ground with the aid of a digital caliper.
To determine the individual volume of each tree
(IWV), the cubing occurred with the tree standing using
we used the Huber´s formula because it assumes that
the average area of a sectioned tree is at its midpoint;
but this is not always that the case, it has an intermediate
precision (CAMPOS; LEITE, 2002). In order to have
this correction in the individual wood volume, it used
the form factor equal to 0.4 (OLIVEIRA et al., 2009).
The Huber’s formula, adapted and described by Péllico
Netto (2004), is obtained by the product of the sectional
area (taken by half of the section) and sectional length
determined by equation 1. Which: IWV is the individual
wood volume (m
3); DHB is diameter at breast height (m);
and IHE is the height of the tree (m).
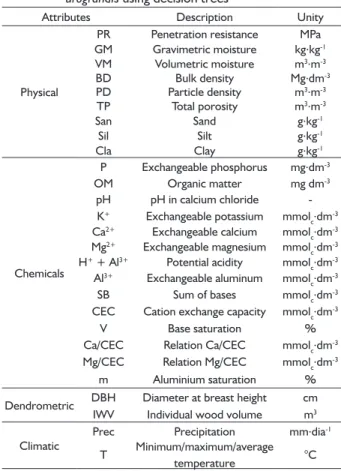
TABLE 1 Description of predictive attributes (physical, chemical, climatic, and dendrometric) used in the database to predict the height of Eucalyptus urograndis using decision trees
Attributes Description Unity
Physical
PR Penetration resistance MPa
GM Gravimetric moisture kg.kg-1
VM Volumetric moisture m3.m-3
BD Bulk density Mg.dm-3
PD Particle density m3.m-3
TP Total porosity m3.m-3
San Sand g.kg-1
Sil Silt g.kg-1
Cla Clay g.kg-1
Chemicals
P Exchangeable phosphorus mg.dm-3
OM Organic matter mg dm-3
pH pH in calcium chloride
-K+ Exchangeable potassium mmol c.dm
-3
Ca2+ Exchangeable calcium mmol
c.dm -3 Mg2+ Exchangeable magnesium mmol
c.dm -3 H+ + Al3+ Potential acidity mmol
c.dm -3 Al3+ Exchangeable aluminum mmol
c.dm -3
SB Sum of bases mmolc.dm-3
CEC Cation exchange capacity mmolc.dm-3
V Base saturation %
Ca/CEC Relation Ca/CEC mmolc.dm-3
Mg/CEC Relation Mg/CEC mmolc.dm-3
m Aluminium saturation %
Dendrometric DBH Diameter at breast height cm
IWV Individual wood volume m3
Climatic
Prec Precipitation mm.dia-1
T Minimum/maximum/average
temperature °C
[1]
Soil attributes were collected around each
evaluated tree, totaling 300 sampling points. The
following soil
attributes were assessment
: mechanical
resistance to penetration (RP), gravimetric moisture
(GM), volumetric moisture (VM), bulk density (BD),
particle density (PD), total porosity (TP), sand, silt, clay,
phosphorus (P), organic matter (OM), hydrogen potential
(pH), potassium (K
+), calcium (Ca
2+), magnesium (Mg
2+),
potential acidity (H
++Al
3+), aluminium (Al
3+), sum of bases
(SB), cationic exchange capacity (CEC), saturation by bases
(SB), calcium with cationic exchange capacity (Ca/CEC),
magnesium with cationic exchange capacity (Mg/CEC),
and aluminum saturation (m) collected in layers of 0-0.20
m and 0.20-0.40 m. These were determined according
to the methodology proposed by Embrapa (2011), Stolf
(1991), and Raij et al. (2001). All analyses were performed
in the laboratory of physics and fertility of the Faculty of
Engineering of Ilha Solteira, Sao Paulo.
Data mining
The original data set was composed by 30
attributes (29 predictive attributes and one
target-attribute or response variable) (Table 1), which were
added to the set of data, totaling 300 observations for
each attribute. The target attribute refers to the height of
Eucalyptus urograndis
and is the target of the classifi cation.
Different heights of
E. urograndis
were submitted
to a discretization procedure in categories, i.e, continuous
data were transformed into discrete data (intervals),
since the categorization of the response variable in
intervals makes the information simpler, facilitating the
interpretation and the decision-making when analyzing
a decision tree. To do so, height values of
E. urograndis
were organized in ascendent order and divided equally
into three classes (low, medium and high) (Table 2).
Selection of attributes
To select attributes, the most common methods
are those based on the theory of information, such
as information gain, which represents the expected
reduction in entropy caused by partitioning the examples
according to an attribute (HAN et al., 2011).
TABLE 2 Distribution of Eucalyptus urograndis heights according to low, medium and high classes and their respective limits, aimed at inducing decision trees to predict different heights of Eucalyptus.
Classes Interval Frequency
Low [1.4 – 3.8] 99
Medium [3.9 – 9.9] 101
MINING TECHNIQUES
Entropy measures the amount of information
brought by an attribute, thus characterizing the
uncertainty or randomness of a set of examples
(Shannon, 1949). Given a set of examples concerning the
target attribute (S) of interest, and a categorization (C) of
the same attribute in n classes S1, S2, ..., Sn, the entropy
H (S) is defi ned by the equation 2, as follows, where
pi
is
the ratio of favorable cases in the class Si.
From the confusion matrix, it is possible to get
the measures of performance evaluation. Accuracy is the
percentage of examples that were correctly classifi ed by
the classifi er and can be expressed as in Equation 4.
[2]Because of the large number of attributes
generated in data preprocessing, a selection procedure
was applied to attributes with the purpose of removing
those highly correlated, considering they can bring
redundancy to the generated model. To do so, we
evaluated four approaches to select the attributes:
1-Without attribute selection, in which all
attributes were used. We characterized this approach by
the absence of selection;
2-Attribute selection based on correlation (CFS)
searches for a set of correlated attributes to prevent the
use of the same information already used previously;
3-The Chi-square test (
χ
2) is based on the concept
of statistical independence. To accomplish that, attributes
are evaluated individually by using the
χ
2measure
regarding the class of interest held by equation 3.
[3]
The observed frequencies are directly obtained
in the sampling data, and the expected frequencies are
calculated based on the observed ones.
The Wrapper approach is applied together with a
basic learning algorithm. This method generates a subset of
attributes, which is tested by the learning algorithm of interest.
Such a process is repeated for each subset of attributes until
the stop criterion is satisfi ed (WITTEN et al., 2011).
Induction and validation of the classifi cation
model (decision tree)
Induced models with a variation in the number
of instances (or observations), per leaf, were assessed
using the cross-validation method using 10 folds. The
selection of the best model was made based on the
following measures: (i) accuracy; (ii) number of leaves
(number of rules), generally associated with the ease
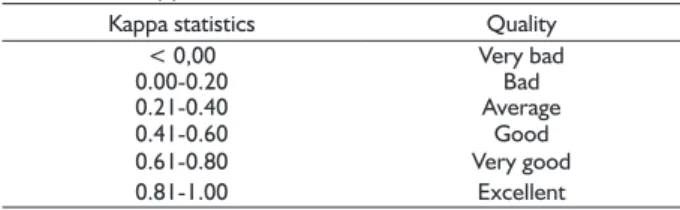
of interpretation of the model; (iii) Kappa coeffi cient,
which is a measure of agreement between predicted and
observed classes of the classifi er.
As a result of the induction of the decision
tree model, a data analyst obtains the confusion
matrix (Table 3), widely used in statistical analysis of
agreement (HAN et al., 2011).
TABLE 3 Example of a confusion matrix of 2 × 2 size. Predicted
Observed Class A Class B Total
Class A TP FN P
Class B FP TN N
Total P’ N’ P + N
[4]
The Kappa coeffi cient is used to describe the
measure of agreement between the predicted and
observed classes. Such a coeffi cient ranges from 0 to
1, representing poor and excellent ranking results,
respectively. It can be defi ned by Equation 5, as follows
(WITTEN et al., 2011), where Pr (a) is a relative
agreement observed for a given class in the confusion
matrix; Pr (e) is the probability of the expected agreement
in this same class.
[5]
The Kappa coeffi cient is calculated considering all
the classes available in a data set. A possible interpretation
of models performance from the Kappa statistic method
was introduced by Landis and Koch (1977) and can be
seen in Table 4.
TABLE 4 Performance of classifi cation models using the
Kappa statistics method.
Kappa statistics Quality
< 0,00 Very bad
0.00-0.20 Bad
0.21-0.40 Average
0.41-0.60 Good
0.61-0.80 Very good
0.81-1.00 Excellent
For data classifi cation, we used the method of
binary decision tree available in the Weka software 3.6
(WITTEN et al., 2011). The induction algorithm used was
the J48, widely known as C4.5 and developed by Quinlan
(1993). With the aim of minimizing a possible overfi tting
effect, tree pruning techniques were used to reduce the
number of internal nodes, generating smaller and less
complex trees and, therefore, easier to be understood.
RESULTS AND DISCUSSION
In general, the performance achieved by
different methods of attribute selection was very
similar. IIn particular, the accuracy ranged from 83.66%
to 84.67%, while Kappa ranged from 0.75 to 0.77.
So the classification of all the methods is considered
very good, as can be seen in Table 5. In addition, it is
possible to notice a wide variation in the number of
selected attributes and the number of generated rules,
ranging from 12 to 21.
also generated a decision tree with a number of rules and
attributes excessively low.
The method based on the Chi-square test
excluded 16 attributes of the data set, thus only remaining
the following ones: BD, PD, SAND, Clay, Silt, pH, Ca,
H=Al, SB, CEC, V and Mg/CEC. However, this method
presented a lower accuracy among all other evaluated
methods for attribute selection (83.66%). In parallel,
this method also presented one of the smallest Kappa
coefficient (0.75), totalling 21 generated rules.
In Table 6, we present data from the confusion
matrix generated through the execution of the J48
algorithm for decision tree induction without selection
of attributes, which gives details on both good and
bad matches of the model. The results revealed that
the model achieved a high accuracy, as can be seen in
the main diagonal in which 252 cases were correctly
classified and distributed in low, medium and high classes,
confirming an accuracy of 84% and Kappa coefficient
of 0.78 (Table 6). The values available out of the main
diagonal represent the model error, totalling 48 cases,
corresponding to an error rate of 16%.
TABLE 5 Accuracy, Kappa coefficient, and the number of
rules for different methods of attribute selection for the induction of decision trees to predict the height of Eucalyptus urograndis.
Met. Selection Accuracy Kappa Precision by class Number Rules Low Medium High
Without selection 84.00 0.78 0.89 0.75 0.87 18
CFS 84.67 0.77 0.90 0.75 0.91 14
χ2 83.66 0.75 0.88 0.74 0.90 21
Wrapper 84.67 0.77 0.87 0.77 0.90 12
Among the methods for attribute evaluation, that
one without attribute selection showed better efficiency
of the model, with and accuracy of 84% and Kappa of
0.78, indicating a very good classification. This method
used all attributes in the set of data and generated a
decision tree with 18 rules. In addition, it is possible to
notice that this method showed high accuracy for all
classes evaluated: 89% for the low class, 75% for the
medium class, and 87% for the high class, indicating the
model efficiency in classifying all the classes.
Despite presenting a good accuracy (84.67%), the
CFS classifier generated a decision tree with only 14 rules
and used only four attributes, namely: Diameter at breast
height (DBH), individual wood volume (IWV) and minimum
temperature (T min). In the decision trees interpretation,
there is a preference for smaller trees, because they
are more comprehensive, present less redundancy of
attributes and are susceptible to have greater accuracy
because of optimization by pruning; however, in this case,
the generated tree does not meet the identification of the
standards previously mentioned in the database, since it is
quite general (only adding little information), since it uses
only four attributes out of 29 predictive ones.
From the 29 predictive attributes in the dataset,
the Wrapper method selected just five of them: diameter
at breast height (DBH), individual wood volume (IWV),
organic matter (OM), Potential acidity (H+Al) and
sum of bases (SB) at a depth from 0.20 to 0.40 m, and
potential acidity at a depth from 0.00 to 0.10 m with an
accuracy of 84.67% and Kappa of 0.77, indicating that
the use of these five attributes are enough to achieve a
very good classification. However, this selection method
TABLE 6 Confusion matrix obtained by the execution of the J48 algorithm for the decision tree induction, without attribute selection.
Predicted
Observed Low Medium High
Low 86 13 0
Medium 11 79 11
High 0 13 87
The decision tree generated by the execution
of the J48 algorithm is available in Figure 1, without
attribute selection.This decision tree is composed of
18 rules, five of them belonging to the low class, nine
belonging to the medium class and four belonging to the
high class, corresponding to 27%, 50% and 22% of the
total of generated rules, respectively (Table 7).
Analyzing the decision tree illustrated in Figure
1, one can infer that the individual wood volume (IWV)
attribute showed the highest importance because of its
higher information gain. So it is placed in the root of the
tree. According to Quinlan (1993), the root node is the
attribute with lower entropy and, consequently, it has
the highest gain of information, optimizing the generation
process of decision trees.
TABLE 7 Number of rules generated by using the J48 algorithm, without attribute selection to predict the growth of Eucalyptus urograndis.
Classes Number of rules
Low 5
Medium 9
High 4
MINING TECHNIQUES
to the individual wood volume (IWV) equal tor lower
than 0.001796 m
3. Thus, we observed sampling data of
higher individual wood volume (> 0.001796 m
3) in the
highest levels of production of
Eucalyptus urograndis
. The
increase in the individual wood volume is conditionated
to mineral fertilization of the soil, which is a commonly
used tool to modify the quality of forest area and, thus,
increase the growth rate of trees. According to Barbosa
et al. (2014), the fertilization techniques used for the
initial development of eucalyptus trees causes an increase
in the volume of wood, since this is highly sensitive to
environmental changes.
Moreover, it can be observed that for the
determination of the high class, the most decisive
attributes were those associated with soil chemistry, such
as: Magnesium (Mg
+2), phosphorus (P) and aluminum
(Al
+3) in the layer from 0.20 to 0.40 m and potassium
(K
+) in the layer from 0.00 to 0.10 m, which have been
present throughout the right branch. The relationship
of these chemical attributes was due to the fact that
they are indispensable elements for the development
of eucalyptus. Magnesium plays an essential role in
chlorophyll constitution, which is very important in
photosynthesis. Phosphorus is the most limiting nutrient
in the initial growth of eucalyptus in Brazil because
of its participation in metabolic processes of roots
development and in reproductive initiations (RAIJ, 2011).
Potassium is one of the nutrients more demanded by
the eucalyptus because it is directly associated with the
water balance of trees; potassium deficiency is one of the
most frequent in forest plantations of eucalyptus, which
directly influences foreign exchange activities and wood
formation (FREITAS et al., 2015). Aluminum toxicity is
one of the factors that most restrict development and
FIGURE 1 Resultant decision tree from the execution of the J48 algorithm without attribute selection to predict the growth of Eucalyptus urograndis.
The organization of a decision tree follows a
hierarchy, so that the highest hierarchy attributes are also
the highest in information gain in the decision-making
process. Hence, variables with greater proximity to the
root node of the tree have higher relevance in eucalyptus
growth classification.
It is possible to see in Figure 1 that the second
most important attribute was the diameter at breast
height (DBH). Lima et al. (2010), studying the
physico-chemical attributes of a oxysol from Cerrado and its
association with the dendrometric characteristics of
Eucalyptus camaldulensis
, found a high positive correlation
between individual wood volume (IWV) and the diameter
at breast height (DBH). Carvalho et al. (2012) also styding
forestry production in acid soils, especially in pH less than
5.0, because it interferes in the fixation of phosphorus,
decreases root respiration and interferes in absorption,
transportation and in the use of nutrients and water by
plants (COSTA et al., 2015).
The results also showed that the only physical
attribute capable of influencing the high production of
eucalyptus was soil resistance to penetration in the layer
of 0.20 to 0.40 m. Lima et al. (2010) observed simple
linear correlations between individual wood volume of
Eucalyptus camaldulensis
and soil attributes when paired
with significant mechanical resistance to penetration and
pH. On the other hand, Rosa Filho et al. (2010) observed
simple linear correlations between individual wood volume
of
Eucalyptus camaldulensis
and soil attributes, which
showed to be significant when both were paired with
resistance to penetration only in depth from 0.2 to 0.3m.
Apart from that, we also observed that of
all climatic attributes evaluated only the minimum
temperature was present in the decision tree, and only
temperatures above 18.25 provided greater growth of
eucalyptus. Studies associated with a decrease in the
temperature below the optimum temperature tend to
reduce plant growth by limiting the production of wood
and damaging the formation of homogeneous plantations
(FLORIANI et al., 2013; GAVITO et al. 2001; PENG;
DANG 2003). In particular, young eucalyptus plants are
more sensitive to low temperatures than adult plants,
which can lead them to death because they are not
completely established in the environment where they
were planted (MORAES et al., 2015).
Attributes associated with the soil acidity, such as
potential acidity (H + Al) in a layer from 0.20 to 0.40 m,
pH in layers from 0.00 to 0.20 m and 0.20 to 0.40 m were
decisive in the generation of rules related to the low class,
and these attributes are present in 60% of rules of the low
class of eucalyptus growth. Lima et al. (2010) observed
that the pH in surface layer of the soil was the attribute
that showed the best interaction with the productivity of
individual wood volume (IWV) of
Eucalyptus camaldulensis
to conditions in Selvíria (Mato Grosso do Sul, Brazil)
and therefore it can be thought of as the best indicator
of the quality of the soil studied, when intended for the
productivity of wood.
CONCLUSION
The use of data mining techniques, in particular
the data classification algorithm based on decision tree
allowed for the development of a model for the initial
development of eucalyptus to predict new cases in
different production classes. The decision tree showed to
be a representative, comprehensive and understandable
model that allows for the identification of decision limits
of the data evaluated, contributing to the understanding
of the attributes. In addition, this model helps domain
experts interpret the development of
Eucalyptus
.
The results showed the classification models
generated in the initial development of eucalyptus were
very efficient to predict new cases in different classes of
production, notably when the individual wood volume
(IWV) and the diameter at breast height (DBH) are crucial
attributes to predict the growth of
Eucalyptus urograndis
.
ACKNOWLEDGEMENTS
The authors would like to thank FAPESP (process
number: 2013/25329-5) and the encouraging fundraising
FUNDUNESP (process number: 2333/002/14-PROPe/
CDC) for the finantial support, and Eldorado Brasil
Celulose from Três Lagoas, Mato Grosso do Sul, Brazil
state, to allow us to use the study area.
REFERENCES
BARBOSA, B.M.; COLODETTE, J.L.; CABRAL, C.P.T.; GOMES, F.J.B.; SILVA, V.L. Efeito da fertilização na qualidade da madeira de Eucalyptus spp. Scientia Forestalis, v. 42, n. 101, p. 29-39, 2014.
BARBOSA, C.E.M.; FERRARI, S.; CARVALHO, M.P.; PICOLII, P.R.F.; CAVALLINI, M.C.; BENETT, C.G.S.; SANTOS, D.M.A. Inter-relação da produtividade de madeira do pinus
com atributos físico-químicos de um latossolo do cerrado
brasileiro. Revista Árvore, v. 36, n. 1, p. 25-35, fev., 2012. CAMPOS, J.C.C.; LEITE, H.G. Mensuração Florestal:
Perguntas e Respostas. Viçosa: Ed. UFV, 2002. 407 p. CARVALHO, M.P.; MENDONÇA, V.Z.; PEREIRA, F.C.B.L.; ARF,
M.V.; KAPPES, C.; DALCHIAVON, F.C. Produtividade de madeira do eucalipto correlacionada com atributos do solo
visando ao mapeamento de zonas específicas de manejo. Ciência rural, v. 42, n. 10 p. 1797-1903, 2012.
COSTA, C.D.O.; ALVES, M.C.; SOUSA, A.P.; SILVA, H.R.
Propriedades químicas dos solos de uma sub-bacia
hidrográfica sob processo de degradação ambiental. Revista
de Ciências Ambientais, v. 9, n. 2, p. 37-50, 2015. CRIVELENTI, R. C.; COELHO, R.M.; ADAMI, S.F.; OLIVEIRA,
S.R.M. Mineração de dados para inferência de relações solo-paisagem em mapeamentos digitais de solo. Pesquisa Agropecuária Brasileira, v. 44, n. 12, p. 1707-1715, 2009. DAI, Q. Y.; ZHANG, C. P.; WU, H. Research of Decision Tree
Classification Algorithm in Data Mining. International
MINING TECHNIQUES
EMBRAPA. EMPRESA BRASILEIRA DE PESQUISA AGROPECUÁRIA. Centro Nacional de Pesquisa de Solos, 2011. Manual de métodos de análise de solos. 2. Ed. Rio de Janeiro; Embrapa, 2011, 230p.
EMBRAPA. EMPRESA BRASILEIRA DE PESQUISA AGROPECUÁRIA. Sistema Brasileiro de Classificação
de solos. 3. Ed. Rio de Janeiro: Embrapa, 2013, 306p. FLORIANI, M.M.P.; STEFFENS, C.A.; CHAVES, D.M.;
AMARANTE, C.V.T.; PIKART, T.G.; RIBEIRO, M.S. Relação entre concentrações foliares de carboidratos solúveis totais e tolerância ao frio em diferentes espécies de Eucalyptus spp. Ciência Florestal, v. 23, n. 1, p. 165-174, 2013. FREITAS, P.C.; SETTE JUNIOR, C.R.; CASTRO, V.R.; GILLES
CHAIX, G.; LACLAU, J.P.; TOMAZELLO FILHO, M. Efeito
da disponibilidade hídrica e da aplicação de potássio e sódio nas características anatômicas do lenho juvenil de Eucalyptus
grandis. Revista Árvore, v. 39, n. 2, p. 405-416, 2015. GAVITO, M.E., CURTIS, P.S., MIKKELSEN, T.N., JAKOBSEN, E.I.
Interactive effects of soil temperature, atmospheric carbon dioxid and soil N on root development, biomass and nutrient uptake of winter wheat during vegetative growth. Journal of Experimental Botany, v. 52, p. 1913-1923, 2001.
HAN, J.; KAMBER, M.; PEI, J., 2011. Data mining: concepts and techniques. 3rd edition. San Francisco: Morgan Kaufmann Publishers.
LANDIS, J.R.; KOCH, G.G. The measurement of observer agreement for categorical data. Biometrics, v. 33, n.1, p. 159-174, 1977.
LIMA, C.G.R.; CARVALHO, M.P.; NARIMATSU, K.C.P.;
SILVA, M.G.; QUEIROZ, H.A. Atributos físico-químicos
de um latossolo do cerrado brasileiro e sua relação com
características dendrométricas do eucalipto. Revista
Brasileira de Ciência do Solo, v.34, p.163-173, 2010. MORAES, C.B.; CARVALHO, E.V.; ZIMBACK, L.; LUZ, O.S.L.;
PIERONI, G.B.; MORI, E.S.; LEAL, T.C.A.B. Variabilidade genética em progênies de meios-irmãos de eucaliptos para tolerância ao frio. Revista Árvore, v. 39, n. 6, p. 1047-1054, 2015.
PÉLLICO NETTO, S. Equivalência Volumétrica: Uma nova metodologia para estimativa do volume de árvores.
Revista Acadêmica: Ciências Agrárias e Ambientais, v. 2, n. 1, p. 17-30, 2004.
PENG, Y.Y.; DANG, Q. Effects of soil temperature on biomass production and allocation in seedlings of four boreal tree species. Forest Ecology and Management. v. 180, p. 1-9, 2003.
PINKARD, E.A.; NEILSEN, W.A. Crown and stand characteristics of Eucalyptus nitens in response to initial spacing: implications for thinning. Forest Ecology and Management, v. 172, n. 2/3, p. 215-227, 2003.
QUINLAN, J. R. C4.5: Programs for Machine Learning. Morgan Kaufmann Publishers. 1993.
RAIJ, B. V. Fertilidade do solo e manejo de nutrientes. Piracicaba: Ed. IPNI, 2011. 420 p.
RAIJ, B.; ANDRADE, J.C.; CANTARELLA, H.; QUAGGIO, J.A.,
2001. Análise química para avaliação da fertilidade de solos
tropicais. Campinas: Instituto Agronômico.
ROSA FILHO, G.; CARVALHO, M.P.; MONTANARI, R.; SILVA, J.M.; SIQUEIRA, G.M.; ZAMBIANCO, E.C. Variabilidade espacial de propriedades dendrométricas do eucalipto e
de atributos físicos de um Latossolo Vermelho. Bragantia,
campinas, p. 439-446, 2011.
SERVIÇO FLORESTAL BRASILEIRO – SFB. As florestas plantadas. Brasília: SFB, 2016. Disponível em: < http:// www.florestal.gov.br/snif/recursos-florestais/estoque-das-florestas>. Acesso em: 12 mai. 2016.
SHANNON, C.E., 1949. The mathematical theory of communication. Warren Weaver. University of Illinois Press. SOUZA, Z. M.; CERRI, D. G. P.; COLET, M. J.; RODRIGUES,
L. H. A.; MAGALHÃES, P. S. G.; MANDONI, R. J. A. Análise dos atributos do solo e da produtividade da
cultura de cana-de-açúcar com o uso da geoestatística e
árvore de decisão. Ciência Rural, Santa Maria, v.40, n.4, p.840-847, abr., 2010.
STOLF, R. Teoria e teste experimental de fórmulas de transformação dos dados de penetrômetro de impacto em resistência do solo. Revista Brasileira de Ciência do Solo, v. 15, n. 3, p. 229-235,1991.
TOLEDO, F. H. S. F.; VENTURIN, N.; CARLOS, L.; DIAS, B. A. S.; VENTURIN, R. P.; MACEDO, R. L. G. Composto
de resíduos da fabricação de papel e celulose na
produção de mudas de eucalipto. Revista Brasileira de Engenharia Agrícola e Ambiental, v.19, n.7, p.711–716, 2015.