Effect of biofertilizer on soil fertility and lettuce
nutrition
Westefann dos Santos Sousa1 José Roberto Verginio de Pontes2 Osmanny Francisco Pereira de Melo3
Abstract
This work aimed to evaluate the effect of the application of efficient microorganisms (EM), in the form of a biofertilizer, on soil fertility and leaf nutrition of lettuce during two crop cycles. One of the biggest challenges of organic production is the fertilization of crops. EMs are considered an alterna-tive, sustainable, safe and low-cost technique to increase the productivity of organic foods, and their use is a good option for agroecological management. For the capture of the EMs and the production of the biofertilizer, a rice substrate was used, according to the methodology used by Brazilian Minis-try of Agriculture, Cattle and Supplying (MAPA, in Portuguese: Ministério da Agricultura, Pecuária e Abastecimento). Soil samples were collected at the beginning of the first cycle and at the end of the second cycle. The samples were sent for chemical analysis, in order to evaluate possible changes in the concentration of Ca, Mg, K, P and Zn, as well as the levels of CTC, base saturation, organic matter and pH. For leaf analysis, leaf concentrations of the following nutrients were observed: N, P, K, Ca, Mg, S, B, Cu Fe, Mn, Zn. The results were satisfactory for the treatment that received weekly application of efficient microorganisms, which resulted in a greater increase of the elements K, Zn and Ca in the soil. As for leaf concentrations, there was a significant difference for N and P (48 and 9.2 g kg-1, respectively) in the treatment used with biofertilizer.
Keywords: Lactuca sativa L. Organic production. Efficient microorganisms. Organic cocktail.
Introduction
Lettuce (Lactuca sativa L.) is the most consumed leafy vegetable in Brazil, being grown throughout the country. Therefore, it contributes to improving income and quality of life, especially, for small producers who sell the product directly at farm markets (INAGAKI et al., 2011).
Vegetables, including lettuce, when grown in the organic system, are as productive as con-ventional ones, in addition to the higher commercial value (SAMPAIO, 2013). In this sense, further research in the agroecological area, especially in the use of techniques that increase the productivity of vegetables, maintaining their quality, can benefit the producer, the consumer and the environment.
1Universidade Estadual de Goiás, mestrandos pelo Programa de Pós-Graduação em Produção Vegetal, mestrando. [email protected]. Rodovia GO-330, Km 241, Anel Viário, Ipameri (GO).
2 Instituto Federal de Educação, Ciência e Tecnologia do Pará (IFPA), Campus de Conceição do Araguaia, Pará, professor doutor. [email protected].
Among the numerous challenges of organic production, maintaining soil fertility is one of the main challenges. This is because crop productivity is directly related to soil fertility, which in organic production must be maintained with natural sources of nutrients. Pereira et al. (2014) state the ef-fectiveness of using fertilizers based on efficient microorganisms (EM), in addition to considering the technique an alternative, sustainable, safe and low cost to increase the productivity of organic foods.
In the agroecological context, the use of biofertilizer in agricultural production is necessary to replace chemical inputs, giving more priority to biological processes in production systems, similar to what occurs in natural ecosystems (KATHOUNIAN, 2001).
The product based on efficient microorganisms appeared in Japan, and it was developed by Dr. Teruo Higa, and it has been used in organic agriculture since the 1980s (MITSUIKI, 2006). Current-ly, this product is produced and distributed in Brazil by the Mokiti Okada Foundation. Despite this commercial product, produced and distributed by the aforementioned Foundation, there is knowledge of the homemade method of capturing the microorganisms making the social technology more adapt-able to local conditions and more accessible to agricultural families for its low cost and the simplicity of its production (ANDRADE, 2011).
The microorganisms identified as efficient have a primordial function, since they capture solar energy and are able to change the soil. According to Andrade (2011), EMs are classified into two groups: regenerative microorganisms (which produce organic substances useful to plants, improving the physical, chemical and biological properties of the soil) and degenerative microorganisms (which produce substances harmful to plants and compact the soil, preventing plants from growing and favoring infestation of pests and diseases). The group of interest in this study is that of regenerative microorganisms, which exist in abundance in nature, and the vast majority of them is already used in the food industry; therefore, they are harmless to man and animals (BATTISTI; SANTOS, 2011).
Combining the tradition of production with the worldwide trend of consumption of organic prod-ucts, this study aimed to evaluate the effect of the application of a biofertilizer, derived from efficient microorganisms, on the chemical fertility of the soil and on the leaf nutrition of lettuce, during two crop cycles.
Material and methods
The work was developed on a family farm in the municipality of Conceição do Araguaia, Pará, Brazil. The study started in the first semester of 2018 and it was completed in the second semester of the respective year. The region’s climate, classified according to Köppen-Geiger, falls under the category of dry humid equatorial in winter, type Aw, the average annual temperature is 26.1ºC and there is an average annual rainfall of 1,734 mm.
The efficient microorganisms were captured in a reserve forest, close to the property, and then the EM were activated with sugar cane molasses, in order to prepare the biofertilizer.
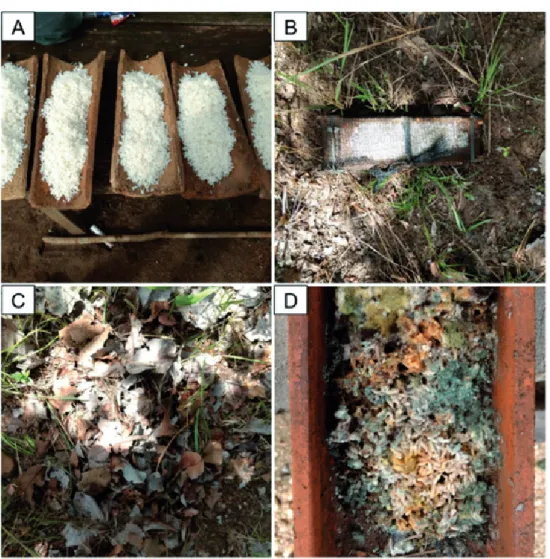
For the capture of EM and preparation of the biofertilizer, a methodology provided by Leite and Meira (2016) was used in the agroecological forms of the Brazilian Ministry of Agriculture, Cattle and Supplying (MAPA, in Portuguese: Ministério da Agricultura, Pecuária e Abastecimento). The substrates for the capture of efficient microorganisms consisted of a homemade mixture of cooked rice (1.0 kg) without salt and oil. The mixture was distributed on tiles and covered with a shade, intercepting 50% of the light radiation. Afterwards, it was spread in the forest, remaining on the soil surface and covered with organic soil material, where it remained for 15 days (FIGURE 1).
After the deadline, the tiles were discovered and the rice portions separated according to their pink, yellow, blue and orange color, indicating the presence of molds, which are considered efficient microorganisms (LEITE; MEIRA, 2016). The portions of rice with dark coloring (gray, brown and black) were discarded in the forest, as they consist of non-beneficial microorganisms.
Figure 1 – (A) Substrate used to capture EM. (B) Container with substrate deposited in the forest. (C) Covering the tile with organic soil material. (D) Portion of rice covered by molds, which were selected and used in the preparation of the biofertilizer.
Source: Sousa et al. (2020).
Of the material colonized by the fungi, 25.0 g was placed in transparent 600 ml containers, in which 50.0 g of brown sugar were added and its volume completed with water. The containers were closed, left in the shade and opened every two days to remove the gas produced inside.
T he biofertilizer was ready between 10 and 20 days, when gas production ceased. According to Siqueira and Siqueira (2013), the biofertilizer can remain stored for up to one year, but the smell must be sweet and pleasant, characteristic of lactic and acetic fermentation, in addition to orange color (FIGURE 2). The development of an unpleasant odor indicates that the biofertilizer is unsuitable for use.
Figure 2 – (A) Efficient microorganisms stored in transparent containers to prepare the biofertilizer. (B) Biofertilizer ready for use, after approximately 20 days of fermentation.
So urce: Sousa et al. (2020).
The experimental design adopted was randomized blocks containing 8 blocks and 3 treatments. The experimental unit was installed in a production greenhouse with dimensions of 16.0 m x 5.0 m, each block was formed by an 8 m² construction site and 2.5 m² plots. The plots corresponding to each treatment were composed of three rows of plants, with a spacing of 0.25 m x 0.25 m between plants and between rows, totaling 27 plants per plot. The useful portion of plants used in the analyzes was composed of the central row of the plot.
Th e treatments used were: T1 – Weekly spraying of the efficient microorganism (biofertilizer); T2 – weekly spraying of a mineral fertilizer (NPK 30-10-10); T3 – Witness, without any fertilization.
For each portion of the T1 treatment, 5.0 L of syrup were prepared by mixing in 5.0 L of water, 10.0 ml of the biofertilizer, plus 10.0 ml of molasses, according to the recommendations of Leite et al. (2016). The microorganism solution was applied weekly, in the coolest hours of the day, during the two crop cycles, from transplanting to harvest.
In the T2 treatment, each plot received 5.0 L of the mineral fertilizer syrup NPK 30-10-10 weekly. To prepare the syrup, according to the recommendation described on the product, 15.0 g of
the product was used in 5.0 L of water. In the application of both treatments, a plastic watering can with fine sieves was used.
Th e variety of lettuce used in the experiment was the Lucy Brown, which is well accepted by producers and consumers. It is characterized by being a large, early, uniform plant and by the forma-tion of its head. It has an excellent bright green color and crispy leaves due to its greater thickness (MATOS et al., 2011).
The seedlings were produced by sowing in Styrofoam trays with 128 cells, using a commercial substrate, in protected cultivation (greenhouse with plastic film). The beds, also in protected culti-vation, were prepared concurrently with the formation of the seedlings, remaining in “rest” until the moment of transplanting. The preparation was common to all treatments and the operation involved manually turning the soil.
During the crop cycles, manual cleaning was performed to remove weeds by means of manual pulling, in order to avoid the competition for light and nutrients as much as possible and no chemical product was used for phytosanitary control.
A simple soil sample of approximately 200.0 g was collected in each portion of the treatments, at the beginning (before the application of treatments) and at the end of the experiment, with the aid of a Dutch auger at a depth of up to 20.0 cm. Subsequently, the simple samples were mixed to form a sample composed of 500.0 g of each treatment. The samples were transferred to plastic bags, previously identified, which were sent to a specialized laboratory (ESALQ, 2013). The samples were subjected to chemical analysis in order to observe the concentrations of calcium (Ca), magnesium (Mg), potassium (K), phosphorus (P) and zinc (Zn), and also, the levels of exchange capacity cationic (CTC), base saturation (V%), organic matter (MO) and hydrogen potential (pH).
For leaf analysis and determination of the concentration of nutrients in the leaves of those plants, a sample was collected from each plot, the collection was performed in the formation of the head and the selected leaves were freshly ripe, a recommendation from Malavolta et al. (1997).
The material was dried in an oven with forced air circulation at 70ºC, until constant mass. Then, they were sent for laboratory analysis in order to determine the following chemical elements: nitrogen (N), by the Kjeldahl method (nitrogen distillation and titration); phosphorus (P), potassium (K), sulfur (S), calcium (Ca), magnesium (Mg), copper (Cu), iron (Fe), manganese (Mn), zinc (Zn), by opening with wet digestion with HNO3 + HClO (3:1, respectively); and boron (B), through dry digestion (SILVA, 2009).
With the results of analysis in leaf tissues, the Percentage Deviation from Optimal (DOP) meth-od was used, in order to know the percentage deviation from the concentration of a given nutrient, in relation to a reference value (RIBEIRO et al., 1999).
All the results of the evaluated parameters were analyzed by means of analysis of variance (ANOVA) and later by the Tukey’s means comparison test at the 5% probability level. These analyzes were performed using the Sisvar program, version 5.6.
Results and discussion
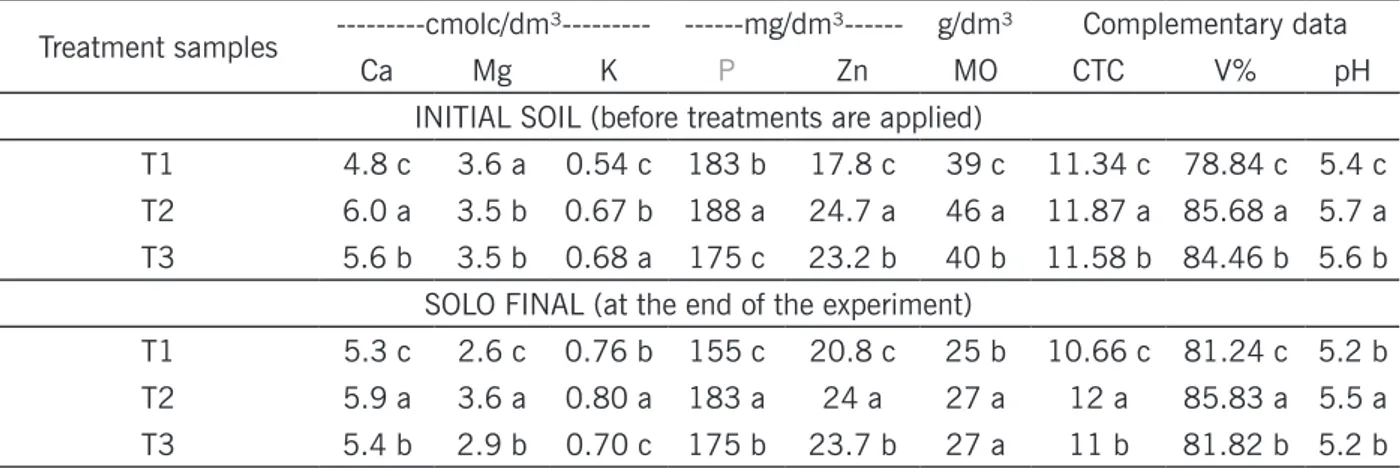
The results of the chemical analysis, carried out on the soil before applying the treatments and at the end of the experiment, are organized in Table 1.
Table 1 – Results of chemical analysis for each treatment, before the application of treatments and at the end of the experiment.
Treatment samples ---cmolc/dm³--- ---mg/dm³--- g/dm³ Complementary data
Ca Mg K P Zn MO CTC V% pH
INITIAL SOIL (before treatments are applied)
T1 4.8 c 3.6 a 0.54 c 183 b 17.8 c 39 c 11.34 c 78.84 c 5.4 c
T2 6.0 a 3.5 b 0.67 b 188 a 24.7 a 46 a 11.87 a 85.68 a 5.7 a
T3 5.6 b 3.5 b 0.68 a 175 c 23.2 b 40 b 11.58 b 84.46 b 5.6 b
SOLO FINAL (at the end of the experiment)
T1 5.3 c 2.6 c 0.76 b 155 c 20.8 c 25 b 10.66 c 81.24 c 5.2 b
T2 5.9 a 3.6 a 0.80 a 183 a 24 a 27 a 12 a 85.83 a 5.5 a
T3 5.4 b 2.9 b 0.70 c 175 b 23.7 b 27 a 11 b 81.82 b 5.2 b
Ca = calcium, Mg = magnesium, K = potassium, P = phosphorus, Zn = zinc, MO = organic matter, CTC = cation exchange capacity, V% = base saturation and pH = hydrogen potential. T1 = Weekly spraying of the efficient microorganism, T2 = weekly spraying of a mineral fertilizer and T3 = Witness. Values with the same letter in the column, for initial and final solo separately, do not differ statistically by the Tukey test at the 5% level (p <0.05).
Source: Sousa et al. (2020).
Statistically (Tukey p < 0.05), the highest levels of the elements calcium, phosphorus, zinc, organic matter, cation exchange capacity, base saturation and hydrogen potential were given for the T2 treatment (mineral fertilizer) at the beginning of the experiment (initial soil); at the end of the experiment (final soil), the same elements remained high in the soil, for treatment T2, adding the element potassium.
It is possible to observe a decrease in the organic matter content in all treatments, in relation to the initial soil value, the cation exchange capacity varied from 10 to 12, the base saturation of all treatments was above 80%, characterizing an eutrophic soil, which according to Santos and Zaroni (2006) is directly related to soil fertility; and the hydrogen potential was maintained between 5.0 and 5.5, which is considered of medium acidity.
Calculating the relationship of calcium, magnesium and potassium, according to the contents of these elements in the soil analysis described above, it was found that in all treatments for both cycles the interaction between these elements is considered median, according to Braga (2010). Only the Mg/K ratio in the first cycle resulted in adequate values, but in the second cycle it changed to median (TABLE 2).
Table 2 – Results for the relationships between calcium, magnesium and potassium for all treatments in the two crop cycles.
FIRST CICLE
--- Ca/K --- --- Mg/K --- (Ca+Mg)/K
---T1 8.9 Medium 6.7 Suitable 15.6 Medium
T2 9.0 Medium 5.2 Suitable 14.2 Medium
T3 8.2 Medium 5.1 Suitable 13.4 Medium
SECOND CYCLE
--- Ca/K --- --- Mg/K --- (Ca+Mg)/K
---T1 7.0 Medium 3.4 Medium 10.4 Medium
T2 7.4 Medium 4.5 Medium 11.9 Medium
T3 7.7 Medium 4.1 Medium 11.9 Medium
Ca = calcium, k = potassium and Mg = magnesium. T1 = Weekly spraying of the efficient microorganism, T2 = weekly spraying of a mineral fertilizer and T3 = Witness.
Source: Sousa et al. (2020).
Braga (2010) declares that these elements are important in the plant’s nutrition process and the interaction between them is fundamental, in terms of favoring or inhibiting the absorption by plants of one element in detriment of the other.
The excess calcium inhibits the absorption of magnesium and vice versa, on this interaction (Ca:Mg), Braga (2010) declares that the recommended for most cultures is a ratio between 3-5 cmolc/dm³, considered ideal (GRAPHIC 1).
Graph 1 – Calcium magnesium ratio for all treatments in the two crop cycles, comparing with the value considered ideal.
Ca:Mg = calcium magnesium ratio. T1 - Weekly spraying of the efficient microorganism; T2 - weekly spraying of a mineral fertilizer; T3 - Witness.
Based on the graph above, it is possible to say that all treatments, in both cycles, did not pres-ent Ca: Mg interactions within what is considered ideal. It is observed that in all treatmpres-ents calcium showed higher values than magnesium, ranging from 4.8 to 6.0 and 5.3 to 5.9 cmolc/dm3 (GRAPHS
2 and 3) in the first and second cycles, respectively.
Graph 2 – Values of calcium and magnesium for
treatments in the first cycle of culture. Graph 3 – Values of calcium and magnesium for treatments in the second cycle of culture.
Ca = calcium and Mg = magnesium. T1 - Weekly spraying of the efficient microorganism; T2 - weekly spraying of a mineral fertilizer; T3 - Witness.
Source: Sousa et al. (2020).
The treatments did not influence this interaction (Ca: Mg), at which calcium, due to its high content in the soil, may have been a determining factor in the inhibition of magnesium absorption, due to the antagonism of calcium, interfering in the availability of magnesium in the ground. In this case, dolomitic limestone can be added to regularize the relationships, taking care of potassium re-placement to maintain the balance.
As for the level of phosphorus content in the soil, for all treatments used, it was considered very high, according to the interpretation of phosphorus contents in soils for vegetables of the Agronomic Institute, which considers between 0-10 mg/dm3 very low, among 11-25 mg/dm3 is low, between
26-60 mg/dm3 is medium, between 61-120 mg/dm3 is high and greater than 120 mg dm-3 is very
high (CAMARGO et al., 2009).
It is noted that for the treatment with EM, the phosphorus content in the soil decreased acci-dentally when compared with its level in the initial soil, before the application of the treatments (183 - 155 mg dm-3), because, according to Mendes and Reis Junior (2003), bacteria, fungi and
actinomy-cetes (components of efficient microorganisms) are involved in the phosphorus solubilization and min-eralization processes in the soil; therefore, the reduction in phosphorus content may be related to the export of this nutrient by harvesting the plants of lettuce, since there was no replacement in the soil.
According to Camargo et al. (2009), the level of zinc in the soil is considered high when it is greater than 1.2 mg dm-3. All treatments resulted in zinc levels above what is considered high,
rang-ing from 17.8 to 24.7 mg dm-3. Corroborating, Fageria (1999) states that zinc levels between 12.5
When observing the increase in the levels of each element, it is possible to say that the treat-ment with efficient microorganisms (T1) resulted in a greater increase in the eletreat-ments potassium, zinc and calcium in relation to the initial soil and the other treatments, which was 40.7 %, 16.9% and 10.4%, respectively (GRAPH 4).
Graph 4 – Variation for the elements observed in the chemical analyzes of the soil for all treatments.
Ca = calcium, Mg = magnesium, K = potassium, P = phosphorus, Zn = zinc, MO = organic matter, CTC = cation exchange capacity, V = base saturation and pH = hydrogen potential. T1 = Weekly spraying of the efficient microorganism, T2 = weekly spraying of a mineral fertilizer and T3 = Witness.
Source: Sousa et al. (2020).
The results were satisfactory, when the levels of each element increased, for the treatment that received weekly application of efficient microorganisms, which resulted in a greater increase in the soil of the elements potassium, zinc and calcium, in relation to the result of the analysis soil chemistry at the beginning of the experiment and other treatments.
There were no great variations for organic matter, cation exchange capacity, base saturation and hydrogen potential in the treatment applied to efficient microorganisms, which is in disagreement with that stated by Battisti and Santos (2011), who observed in their work an increase in the availability of organic matter, base saturation and soil pH, after application of EM during lettuce cultivation.
The results of the concentrations of each nutrient observed in the leaf analysis and the ideal level for each nutrient, as recommended by Ribeiro et al. (1999), are shown in Table 3.
Table 3 – Leaf contents of nutrients observed in chemical analysis, first and second crop cycles, and the ideal value of the levels for each nutrient.
1st CYCLE ---g kg-1--- ---mg kg-1 ---N P K Ca Mg S B Cu Fe Mn Zn T1 40 b 6.1 a 35.2 a 4 b 2.3 b 3 a 14 a 9 a 180 a 48 a 67 a T2 44 a 6 b 33.6 b 4.1 a 2.4 a 2.7 b 13 b 7 c 127 c 36 b 65 b T3 40 b 6 b 32 c 3,8 c 2.1 c 2.6 c 14 a 8 b 150 b 30 c 58 c 2nd CYCLE T1 48 a 9.2 a 62 b 6.6 c 3.6 b 2.2 c 18 c 10 a 277 b 70 c 110 c T2 47 b 9.1 b 61 c 7.2 b 3.7 a 2.5 a 24 b 9 b 290 a 93 b 130 b T3 46 c 8.8 c 65 a 7.4 a 3.7 a 2.4 b 28 a 10 a 263 c 95 a 150 a IL 40 8 70 15.4 4 1.9 80 15 125 150 137.5
IL = ideal level for each nutrient. N = nitrogen, P = phosphorus, K = potassium, Ca = calcium, Mg = magnesium, S = sulfur, B = boron, Cu = copper, Fe = iron, Mn = manganese and Zn = zinc. T1 = Weekly spraying of the efficient microorganism, T2 = weekly spraying of a mineral fertilizer and T3 = Witness. Values with the same letter in the column, for the 1st and 2nd cycle separately, do not differ statistically by the Tukey test at the level of 5% (p <0.05).
Source: Sousa et al. (2020).
According to the Tukey Test, plants submitted to T1 treatment (efficient microorganisms) in the first cycle had the highest concentrations of phosphorus, potassium, sulfur, copper, iron, manganese and zinc, however in the second cycle this number decreased and the highest concentrations of nu-trients found in the leaf tissues of lettuce plants were nitrogen, phosphorus and copper. Battisti and Santos (2011) reported a similar result, at which lettuce grown with EM application presented higher concentrations of nitrogen and phosphorus.
Using DOP (Percentage Deviation from Optimal), he observed that in the first cycle, nitrogen concentrations in leaf tissue were considered optimal for the treatment used by efficient microorgan-isms (T1) and the control (T3). The other nutrients resulted in positive or negative indices, demon-strating that the concentrations of certain nutrients were in excess or in a deficiency state, respective-ly. It is important to note that the nutrients sulfur and iron showed the highest levels of concentration for T1 treatment (GRAPH 5).
Graph 5 – Optimal percentage deviation (DOP) for the concentrations of nutrients in the leaf tissues of all treatments in the first cycle.
N = nitrogen, P = phosphorus, K = potassium, Ca = calcium, Mg = magnesium, S = sulfur, B = boron, Cu = copper, Fe = iron, Mn = manganese and Zn = zinc. T1 = Weekly spraying of the efficient microorganism, T2 = weekly spraying of a mineral fertilizer and T3 = Witness.
Source: Sousa et al. (2020).
As for the second cycle, the same result was obtained, with the nitrogen concentration for the T1 and T3 treatments, which were previously balanced, shown to be in excess (GRAPH 6). Another important point was the elements sulfur and iron, which in the first cycle showed greater concentra-tion for the T1 treatment, and in the second cycle this increase was for the T2 treatment.
Graph 6 – Optimal percentage deviation (DOP) for the concentrations of nutrients in the leaf tissues of all treatments in the second cycle.
N = nitrogen, P = phosphorus, K = potassium, Ca = calcium, Mg = magnesium, S = sulfur, B = boron, Cu = copper, Fe = iron, Mn = manganese and Zn = zinc. T1 = Weekly spraying of the efficient microorganism, T2 = weekly spraying of a mineral fertilizer and T3 = Witness.
Relating the two cycles, it is possible to observe that the concentration values increased sig-nificantly in the second cycle, for all treatments, presenting some small variations. In addition, the behavior was similar for all nutrients in all treatments.
Conclusions
It was found that the treatment with efficient microorganisms resulted, at the end of the ex-periment, in a higher leaf concentration of nitrogen and phosphorus, when compared to the other treatments. Furthermore, the product used proved to be efficient in the availability of phosphorus for the plants, since the levels of P in the soil decreased accidentally, when compared with its level in the initial soil, that is, the efficient microorganisms allowed a greater absorption of this nutrient by lettuce plants.
The results obtained in this study show that EM is a product that can be used as a biofertilizer in the cultivation of Lucy Brown lettuce, causing positive effects on the soil’s chemical fertility and crop nutrition, which can be very promising for agroecological production and diversifying existing techniques.
According to the results obtained in this study, it is necessary a continuity in the theme of this research, testing different concentrations and doses of this product, verifying its relationship with the dynamics of nutrients in the soil more deeply, improving the technique and making it a reliable and accessible tool for producers.
Efeito de biofertilizante na fertilidade do solo e nutrição de alface
Resumo
Este trabalho teve como objetivo analisar o efeito da aplicação de Microrganismos Eficientes (EMs), na forma de um biofertilizante, sobre a fertilidade do solo e nutrição foliar da alface durante dois ciclos da cultura. Um dos maiores desafios da produção orgânica é a fertilização das culturas. Os EMs são considerados uma técnica alternativa, sustentável, segura e de baixo custo para aumentar a produtividade dos alimentos orgânicos, sendo sua utilização uma boa opção de manejo agroecológi-co. Para a captura dos EMs e produção do biofertilizante, utilizou-se de um substrato de arroz, con-forme a metodologia empregada pelo Ministério da Agricultura, Pecuária e Abastecimento (MAPA). Foram coletadas amostras de solo no início do primeiro ciclo e no final do segundo ciclo. As amostras foram encaminhadas para análise química, com a finalidade de avaliar possíveis alterações na con-centração de Ca, Mg, K, P e Zn, assim como os níveis de CTC, saturação por bases, matéria orgânica e pH. Para a análise foliar, foram observadas as concentrações foliares dos seguintes nutrientes: N, P, K, Ca, Mg, S, B, Cu, Fe, Mn, Zn. Os resultados se mostraram satisfatórios para o tratamento que recebeu aplicação semanal de Microrganismos Eficientes, o qual resultou em um maior incremento dos elementos K, Zn e Ca no solo. Quanto às concentrações foliares, houve diferença significativa para N e P (48 e 9,2 g kg-1, respectivamente) no tratamento que utilizou o biofertilizante.
References
ANDRADE, F. M. C. Cadernos dos microrganismos eficientes (EM): Instruções práticas sobre o uso ecológico e social do EM. 2 ed. Viçosa: [s.n.], 2011.
BATTISTI, M. B.; SANTOS, M. G. Avaliação da eficiência da aplicação de microrganismos eficientes EM•1® em cultivo de alface. 2011. 41 p. Trabalho de Conclusão de Curso (TCC). Universidade Tec-nológica Federal do Paraná, Medianeira. Disponível em: <http://repositorio.roca.utfpr.edu.br/jspui/ handle/1/459>. Acesso em: 27 fev. 2019.
BRAGA, G. N. M. A Relação Ca:Mg do Solo e o Ideal para as Plantas. 2010. Disponível em: <https://agronomiacomgismonti.blogspot.com/2010/08/relacao-camg-do-solo-e-o-ideal-para-as. html>. Acesso em: 27 fev. 2019.
ESCOLA SUPERIOR DE AGRICULTURA LUIZ DE QUEIROZ. Instruções para Coleta e Remessa de Amostras. Departamento de Ciência do Solo – USP, 2013. Disponível em: <http://www.esalq.usp.br/ departamentos/lso/coleta.htm>. Acesso em: 15 maio 2019.
FAGERIA, N. K. Níveis adequados e tóxicos de Zinco na produção de arroz, feijão, milho, soja e trigo em solo de cerrado. Revista Brasileira de Engenharia Agrícola e Ambiental, Campina Grande, v. 4, n. 3, p.390-395, out. 1999. Disponível em: <https://www.alice.cnptia.embrapa.br/bitstream/ doc/212439/1/CNPAF2000nkf.pdf>. Acesso em: 27 fev. 2019.
INAGAKI, A. M.; DIAMANTE, M. S.; SEABRA JÚNIOR, S. NUNES, M. C. M.; SILVA, M. B.; NEVES, S. M. A. S. Identificação, mapeamento e comercialização de alface em Cáceres, Mato Grosso – Bra-sil. Horticultura Brasileira, v. 29, n. 2, p.353-361, jul. 2011. Disponível em: <http://www.abhorti-cultura.com.br/EventosX/Trabalhos/EV_5/A4138_T6262_Comp.pdf>. Acesso em: 28 fev. 2019. CAMARGO, O. A.; MONIZ, A. C.; JORGE, J. A.; VALADARES, J. M. A. S. Métodos de Análise Química, Mineralógica e Física de Solos do Instituto Agronômico de Campinas. Campinas: In-stituto Agronômico. Boletim técnico, Edição revisada e atualizada, 106. 77 p. 2009. Disponível em: <http://www.iac.sp.gov.br/produtoseservicos/analisedosolo/docs/Boletim_Tecnico_106_rev_atu-al_2009.pdf>. Acesso em: 28 fev. 2019.
KATHOUNIAN, C. A. A reestruturação ecológica da agricultura. Botucatu: Muccio & Associado, 2001. 345 p. Disponível em: <https://edisciplinas.usp.br/pluginfile.php/4353522/mod_resource/ content/0/A%20reconstrucao%20ecologica%20da%20agricultura.pdf>. Acesso em: 28 fev. 2019. LEITE, C. D.; MEIRA, A. L. Preparo de microrganismos eficientes (EM). Fichas Agroecológicas do Ministério da Agricultura, Pecuária e Abastecimento (MAPA), n. 31, 2016.
LEITE, C. D.; MEIRA, A. L.; MOREIRA, V. R. R. Uso de microrganismos eficientes em Plantas, Se-mentes e Solo. Fichas Agroecológicas do Ministério da Agricultura, Pecuária e Abastecimento, n. 32, 2016.
MALAVOLTA, E.; VITTI, G. C.; OLIVEIRA, S. A. Avaliação do estado nutricional das plantas: princípios e aplicações. 2. ed. Piracicaba: Potafos, 1997. 319 p.
MATOS, F. A. C.; COSTA JÚNIOR, A. D.; SERRA, D. D.; BOAVENTURA, E. C.; DIAS, R. L.; CASCEL-LI, S. M. F. Alface: saiba como cultivar hortaliças para colher bons negócios. Brasília: Plano Mídia, (Agricultura Familiar). 2011, 32 p.
MENDES, I. C.; REIS JUNIOR, F. B. Microrganismos e disponibilidade de Fósforo (P) nos solos: uma análise crítica. Planaltina: Embrapa, 2003. 26 p. Disponível em: <https://www.infoteca.cnptia.em-brapa.br/bitstream/doc/568171/1/doc85.pdf>. Acesso em: 28 fev. 2019.
MITSUIKI, C. Efeito de sistemas de preparo de solo e do uso de Microrganismos Eficazes nas propriedades físicas do solo, produtividade e qualidade de batata. 2006. 98 f. Dissertação (Me-strado). Universidade de São Paulo, Piracicaba. Disponível em: <http://www.teses.usp.br/teses/dis-poniveis/11/11136/tde-26022007-151401/pt-br.php>. Acesso em: 28 fev. 2019.
PEREIRA, T. G.; SILVA, S.; MORAIS, E. G.; LOPES, M. A. P.; PEREIRA, J. G.; GONÇALVES, L. D. Uti-lização de microrganismos eficientes (EM) na produção de alimentos orgânicos. In: VII Semana de Ciência e Tecnologia do IFMG – Campus Bambuí, 2014.
RIBEIRO, A. C.; GUIMARÃES, P. T. G.; VENEGAS, V. H. A. Recomendações para o uso de corretivos e fertilizantes em Minas Gerais: 5ª Aproximação. Viçosa: UFV, 1999. 359 p.
SAMPAIO, B. S. Biofertilizante na produção de Alface. 2013. 85 p. Dissertação (Mestrado). Uni-versidade Federal do Espírito Santo, São Mateus. Disponível em: <http://repositorio.ufes.br/han-dle/10/5196>. Acesso em: 28 fev. 2019.
SANTOS, H. G.; ZARONI, M. J. Saturação por bases. Agência Embrapa de Informação Tecnológica, 2006. Disponível em: <http://www.agencia.cnptia.embrapa.br/gestor/solos_tropicais/arvore/CON-TAG01_21_2212200611544.html>. Acesso em: 29 out. 2018.
SILVA, F. C. Manual de análises químicas de solos, plantas e fertilizantes. 2. ed., revista ampliada. Brasília, DF: Embrapa Informação Tecnológica, 2009.
SIQUEIRA, A. P. P.; SIQUEIRA, M. Bokashi: adubo orgânico fermentado. Niterói: Coordenadoria de Difusão de Tecnologia, 2013. 18 p. Programa Rio Rural. Disponível em:<http://www.pesagro.rj.gov. br/downloads/riorural/40_Bokashi_Adubo_organico_fermentado.pdf>. Acesso em: 28 fev. 2019.