Attraction factors of FDI in Portugal
Carina De Paiva Ferreira
Dissertation submitted as partial requirement for the degree of Master in Economics
Supervisor:
Prof. Felipa Dias de Mello Sampayo, Assistant Professor, ISCTE Business School, Department of Economics
ii
A
tt
ra
ct
io
n
fac
to
rs
o
f
FD
I i
n
P
o
rt
u
g
al
C
a
ri
n
a
D
e P
a
iv
a
F
errei
ra
iii Resumo
O Investimento Direto Estrangeiro (IDE) é um fenómeno crescente a nível global com diversas implicações tanto ao nível económico como social dos países intervenientes. Portugal, não é exceção, as entradas de capital estrangeiro assumiram uma posição de liderança na economia nacional. Posto isto, é essencial que o governo de cada país crie e desenvolva novas condições que permitem a atração de novos investidores estrangeiros.
Esta dissertação surge no sentido de identificar e conhecer quais os determinantes responsáveis pela atração deste tipo de investimento em Portugal, ou seja, quais os fatores que levam as empresas internacionais a optarem por Portugal no momento de decisão do IDE. Através do estudo realizado durante o período de 2000 a 2016 a um conjunto de países investidores em Portugal nomeadamente, a Espanha, Suíça, Holanda, França, Alemanha, Luxemburgo, Estados Unidos, Reino Unido, Itália e a Bélgica permitiu-nos concluir que baixos custos de mão-de-obra aliados a altos níveis de qualificação são os fatores que mais atraem o IDE em Portugal. Outra conclusão retirada do estudo está relacionada com o facto da dimensão do país ser relativamente pequena e portanto não permite o desenvolvimento de economias de escala sendo um aspeto negativo para o IDE e que sugere que o IDE em Portugal é mais direcionado para as exportações do que para o mercado interno.
Palavras-chave: Investimento Direto Estrangeiro, Portugal, Método GMM, Determinantes da localização de IDE
iv Abstract
Foreign Direct Investment (FDI) is a growing phenomenon at the global level with several economic and social implications of the countries involved. Portugal, is no exception, foreign capital inflows have taken a leading position in the national economy. Thus, it is essential that the government of each country creates and develops new conditions that allow the attraction of new foreign investors.
This dissertation aims to identify and acknowledge the factors attracting FDI into Portugal, ie, the factors that make international companies to opt for Portugal at the moment of location decision of the FDI. Through the study conducted between 2000 and 2016, a number of investor countries in Portugal, namely Spain, Switzerland, Netherlands, France, Germany, Luxembourg, the United States, the United Kingdom, Italy and Belgium have allowed us to conclude that low labor costs, high levels of labor skills are the factors that most attract FDI in Portugal. Another conclusion drawn from the study is related to the fact that the size of the country is relatively small and therefore does not allow the development of economies of scale, suggesting that FDI into Portugal is more directed to exporting rather than to the internal market.
Key-words: Foreign Direct Investment, Portugal, GMM method, FDI determinants JEL Classification: F23, F21
v Acknowledgements
First of all, I would like to thank all the people who somehow contributed to this long journey and to the realization of this dissertation.
To my supervisor, Professor Felipa Sampayo for all the availability and support granted throughout this process, for the constant contribution and sharing of knowledge that so much enriched this dissertation.
To my parents and sister, for all the strength, affection and trust placed in me and in everything I do.
To all my friends who always gave me a friendly word of support and motivation in the most difficult moments and the patience to hear me when I needed. A special thank you to my best friend, Liliana Gavazzi, who, like me, went through this stage that with much effort and dedication comes to an end.
Finally, to my boyfriend, for all the strength and support, for the understanding and love shown throughout this adventure.
To all others who have played an important role in completing this step, Thank you!
vi Index Resumo ... iii Abstract ... iv Acknowledgements ... v 1. Introduction ... 1 2. Literature review ... 3
2.1 THE THEORIES OF FDI ... 3
2.2 EMPIRICAL STUDIES IN FDI... 9
2.3 EMPIRICAL STUDIES ON THE DETERMINANTS OF FDI IN PORTUGAL ... 11
3. Foreign direct investment in portugal ... 13
3.1 HISTORICAL PERSPECTIVE ... 13
3.2 WHY INVEST IN PORTUGAL? ... 16
4. Methodology ... 19
4.1 DATA ... 20
4.2 UNIT ROOTS TESTS ... 25
4.3.ECONOMETRIC METHOD ... 28
4.5 RESULTS ... 28
5. Conclusion ... 31
References ... 33
vii List of figures
Figure 1-Trade balance (millions €) ... 15
Figure 2- Main countries in exports (2016) ... 15
Figure 3-Evaluation of attractiveness factors in Portugal: 2017 ... 18
Figure 4 – Foreign Direct Investment (FDI) ... 20
Figure 5- Relative Gross Domestic Product ... 21
Figure 6- Relative Labor Cost ... 22
Figure 7- Relative Labor Qualification ... 23
Figure 8- Relative Corruption level ... 24
List of tables Table 1- Correlation Matrix ... 24
Table 2- Descriptive Statistics... 25
Table 3- FDI1 Unit Root tests ... 25
Table 4- First Difference test ... 26
Table 5 – LLC unit root test ... 26
Table 6- First difference LLC test ... 26
Table 7- IPS unit root test ... 27
Table 8 – First Difference IPS test ... 27
Table 9 – ADF-Fisher unit root test ... 27
Table 10- First Difference ADF-Fisher test ... 27
1 1. Introduction
Foreign Direct Investment (FDI) plays an important role in the most diverse economies, in addition to promoting economic growth and development, it is also a source of innovation and added value. More than a source of funding, it brings with it the possibility of entering new markets, increasing the transfer of innovation and technological development, being one of the best resources that a country can use. In regard to the positive effects of FDI in the Portuguese Economy, Crespo, Isabel Proença, & Fontoura, (2012) studied the impact of geographical proximity between the locations of multinational and national companies for FDI in Portugal and concluded that there is a positive impact through backward linkages. Regarding its evolution, FDI has been growing at considerable levels in the last decades, despite some oscillations, especially during the installed crisis of 2008.
According to AICEP data, 2012 was the year in which the highest FDI inflow was recorded, reaching 6.9 billion euros and at the end of 2013 the FDI stock was 2.7 times that of 2000. This development allowed not only the diversification of multinational companies (MNEs) between economies and sectors, but also an increase in the competitiveness of the countries. Portugal was not immune to its impact and according to the EY (2017) survey “is on the investor radar, recording investment intentions above the European average and predicting an increase in the attractiveness of the country”. FDI is essential for the Portuguese economy and its positive effects depend on the ability of the country to adapt its comparative advantages in order to take advantage of the opportunities that arise from the effect of globalization.
According to the Organization for Economic Co-operation and Development (OECD, 2008), foreign direct investment is a key element in international economic integration known as globalization. The International Monetary Fund (IMF) declare that, the investment is considered direct when the investor holds a stake of at least 10% of the company’s stock and can exert a significant influence on the management of the company. Given a correct policy environment, FDI can serve as an important vehicle for the development of local businesses contributing to the improvement of the competitive position of the host country as well as the country that invests. Thus, foreign direct investment involves the transfer to another country, the host country, of assets and intermediate products, covering technology, financial capital, management techniques, know-how, leadership and access to external markets, with a control by part of the investor in the resources used in the transfer.
2 From a macroeconomic perspective, FDI is a type of capital flow across borders, between home and host countries, and is captured in the country balance of payments, with the variable of interest being capital flows and stocks, the results of such investments (Denisia, 2010).
Regarding the microeconomic perspective, it is related to the motivations for investing across national borders from the investor's point of view (Makoni, 2015).
This dissertation aims to understand the factors attracting FDI to the Portuguese economy. The central objective is to analyze what are the most attractive factors of Portugal from the investor’s point of view. The data analysis and the empirical study will allow to understand the specific characteristics of Portugal that lead investors to invest in our country in the period between 2000 and 2016.
As for the structure of the dissertation, it is divided into 5 main chapters. In Chapter 2, a review of the literature is made, in which essential concepts are described about the various explanatory theories of FDI. The different approaches to the theories presented allow a better perspective on its evolution over the years as well as some of its limitations. Just as there are several theories, there are also several determinants that lead a company to choose one country over others. Examples of these determinants are inflation rate, GDP, political and economic stability, labor cost, economic growth, openness to trade, etc. Finally, some international and national empirical studies on the determinants of FDI are discussed with a particular interest to the empirical studies of FDI in Portugal.
In Chapter 3, the evolution of FDI in Portugal during 2000 to 2016 is described. It is also analyzed the main investing countries, some attraction factors and sectors that received FDI. Spain and Netherlands were the countries that invest more in Portugal. These countries pointed growth in productivity, stability of the social climate as well as the quality of transport and logistics infrastructures as the main factors attracting FDI into Portugal.
In Chapter 4, it is presented the methodology used in the study. First the statistical properties of data used in the empirical application is discussed. The econometric method adopted in the empirical study on the determinants attracting FDI into Portugal was the GMM. The results suggest that low labor costs combined with a high level of qualification and greater economic transparency of Portugal are essential factors attracting FDI. In Chapter 5, the conclusion is presented as well as this study’s limitations and future research.
3 2. Literature review
The objective of this Chapter is to review the literature explaining the locational factors of FDI. This chapter is organized as follows, initially it is reviewed the main theories of FDI that focus on the locational determinants of FDI. Finally, an analysis of some empirical studies on the factors explaining FDI location, with a special focus to the empirical studies of FDI into Portugal.
2.1 The Theories of FDI
The first theories emerged in the 1960s and 1970s and were conducted by MacDougall (1960) and Kemp (1964) who followed a neoclassical approach, known as the MacDougall-Kemp Model. This model was based on the assumptions of a perfectly competitive market and according to him, FDI was characterized by higher profitability in growing foreign markets and a lower labor cost and currency risk.
Hymer (1960) was one of the first authors to criticize the neoclassical approach because of its limited ability to explain FDI movements. Hymer (1976)1 developed his work in the
context of an imperfect market, arguing that multinational companies (MNCs) only invest in the international market if they obtain a competitive advantage. Foreign investment entails high costs and risks inherent in the disadvantages faced by multinationals, namely in terms of communication, transport, difficulty accessing information and business ethics. The need for firms to have specific ownership advantages, such as product differentiation, patents, management skills, among others, enable them to compete with local firms and thus compensate for these disadvantages (Chawla & Rohra, 2015).
Subsequently, still highlighting the existence of market imperfections, Kindleberger (1969) and Caves (1971) conducted an analysis similar to that of Hymer. However, Kindleberger (1969) argued that to exist FDI would have imperfections to occur. Caves (1971) based on product differentiation, believed that the FDI had an advantage over export and licensing. According to the author, the differentiation of products must be supported with the knowledge (Assunção, Forte, & Teixeira, 2011). Knickerbocker (1973), based on the relationship between FDI and oligopoly rivalry between firms, stated that FDI flows reveal the strategic rivalry between firms in the global market as a result of reactive behavior towards competitors in some markets. His theory became known as the "theory of oligopolistic reaction"
4 as companies follow the internationalization of competitors so that they do not have a strategic advantage (Chawla & Rohra, 2015).
Another current of studies is represented by Vernon, (1966) Product Life Cycle theory, initially used to explain investments made by American companies in foreign markets after World War II in the manufacturing industry. According to Vernon, all products has a four phase life cycle, innovation, growth, maturity and decline. In a first phase, US companies created their innovative products for local consumption and exported the surplus to foreign markets by enjoying technological advantages over their competitors, with a high profitability and a significant return from exports. As the product develops, the diffusion of technology occurs and as a result products that were once difficult to imitate are now traditional products, increasing dependence on the labor cost. According to Vernon, companies choose to invest directly in a given location as an alternative to export, as in the maturity and decline phases, production is transferred to developing countries where markets are saturated and products are less innovative, so there is a greater pressure to reduce costs (Denisia, 2010). Technological innovations are the determining factor in international trade and the decision to internationalize companies. Thus, countries with better conditions of investment in technology will have an advantage over those that do not have these more favorable conditions. Aharoni (1966) explained why firms opted for FDI, for reasons of fear of losing competitiveness, the need to follow competitors in foreign markets and increase competition in the domestic market, which he called competitive factors (Assunção et al., 2011).
Another approach on the determinants of FDI is the theory based on internalization, proposed by Buckley and Casson (1976). According to the authors, companies opt to internalize the operations, that is, carry out one or several activities of the value chain within the company, through FDI, when the transaction costs are higher than the costs of internalization. Transaction costs are related to costs such as information and trading costs that arise from relationships with foreign trade. There are several advantages that the process of internalizing is characterized, one of the advantages is that the company has a greater control over the foreign operations; reduction of uncertainty in transactions; the concentration of market power, among others. In this way, companies should analyze each market and analyze the costs and benefits before choosing to internalize their activities.
The most well-known and comprehensive theory of FDI is the eclectic paradigm theory (OLI) developed by Professor John Dunning. According to Dunning, (1980), for a company to
5 make foreign direct investments must simultaneously meet three conditions. It should have ownership advantages (O), which offer it a competitive advantage over other companies in the external market, location advantages (L), which relate to the comparative advantages of the country of origin and the internalization advantages (I) that are associated with the intrinsic characteristics of each company. Ownership advantages, are those that are business-specific and are in the form of tangible and intangible assets such as trademarks, patents, information and technologies. These advantages result in a reduction of the production costs for the company, allowing to compete with companies in the external market. The location advantages are related to the comparative advantages of the country of origin and can be the existence of productive factors, incentives to the FDI, existence of barriers to trade, among others. Finally, the internalization advantages are associated with the characteristics of each company and benefits more in making transactions within the company itself than relying on external markets (Nayak & Choudhury, 2014). In addition, Boddewyn (1985) (in Makoni, 2015) points out that the more firms in a country enjoy ownership advantages, the more incentives it has to internalize them, and the more profitable it will be to exploit them outside their home country and thus, the greater would be the probability of getting involved in FDI and in international production.
According to Denisia (2010), the OLI eclectic paradigm shows that OLI parameters are different from company to company, depend on context and represent the economic, political and social characteristics of the host country. Thus, the objectives and strategies of companies, the magnitude and pattern of production will depend on the challenges and opportunities that different types of countries offer.
However, although the theory has been empirically tested by the author himself, there are still some limitations that have been pointed out by several critics. One of the main criticisms of the theory is that it contains many variables and as a consequence loses operational practice (Nayak & Choudhury, 2014). In order to solve this problem, Dunning came up with a new theory, the Investment Development Cycle (IDP), which is a link between a country's level of economic development and its investment positions. Yet, the OLI eclectic paradigm theory continues to be one of the most recognized theories to explain FDI.
The new trade theory is an addition to Dunning's eclectic paradigm and combines the advantages of ownership and location advantages with the technology and characteristics of a country. This new theory was based on the models proposed by Kindleberger (1969), Hymer (1976) and Caves (1971), and several studies have been done on this subject (Chawla & Rohra,
6 2015). Markusen (1995) criticized the inability of early models to explain the existence of MNEs, and during the 1980s and 1990s, along with other researchers, they changed the models to include MNEs and FDI. Foreign investors decide their location based on the advantages of producing to achieve economies of scale or reductions in production costs in different countries. As a result, the classification of the FDI appeared in two types, the horizontal FDI and the vertical FDI. The horizontal FDI model was developed by Markusen, noting that investors are motivated by markets with growth potential to sell the products and means that a MNE replicates the same activities in several different geographical locations. This type of FDI replaces exports and according to Markusen et al. (1996) tends to arise more when countries are similar in terms of market size and factor endowment.
In the case of the vertical FDI model developed by Helpman (1984) the MNEs locate the production according to the intensity of the factors, that is, they decompose the production process in places where the differences in production costs are more advantageous. According to Markusen et al., (1996) this model is more suitable for investments in developing countries, since they are characterized by cheaper labor attracting foreign investors. The knowledge capital model included the two previous models and was developed by Markusen (1995). He defends that the specific advantages of MNEs are based mainly on knowledge capital, consisting of intangible assets such as patents, trademarks or human capital. Markusen (1995) states that the importance of knowledge for MNCs has implications for the decision on the mode of entry abroad, that is, knowledge-based resources share characteristics that give rise to the FDI. Knowledge-based assets are easy and cheap to transfer to other geographic locations and have a common character, so this explains why companies prefer to do FDI.
Institutional theory asserts that firms operate in a complex and challenging environment and that firm decisions will depend on the institutional forces that have an effect on them, specifically on regulations, policies and incentives (Francis et al., 2009), cited in (Assunção et al., 2011). The institutional environment is an essential asset for greater foreign investment. Several authors argue that the quality of institutions has a positive influence on the attraction of FDI.
Finally, the institutional FDI fitness theory developed by Saskia Wilhelms in 1998 is the least mentioned when talking about FDI. This theory refers to a country's ability to attract, absorb, and retain FDI, that is, it is not the largest countries but the fittest countries that receive the bulk of FDI. Therefore, the most attractive countries for FDI will be those that adapt more
7 quickly to the environment, seizing opportunities, responding to threats to compete with competitors. According to this theory, it is the institutions, their policies and their implementation that give a country competitive advantages in the global FDI market, that is, the role of governments in economic measures and the adaptation of public policies are fundamental to attract foreign investors. Wilhelms (1998) states that institutional variables are the main influencers of FDI inflows in a country.
According to Dunning (2001), there are four major economic drivers for FDI: market seeking, resource seeking, efficiency seeking and strategic assets seeking. Market seeking is a type of investment aims to enter new economic spaces in order to increase market shares. Allows MNEs to operate in markets where the growth rate is higher and thus benefit from economies of scale in production. Resource seeking is one of the most important determinants of the FDI decision, due to the availability of natural resources in the host country such as raw materials, agricultural products and labor. MNEs invest in these types of countries for the purpose of using or purchasing resources that are not available in their country or for access to lower labor costs. In the case of efficiency seeking, investors look for regions with specific characteristics for their operations in order to obtain a better division of labor, improving the efficiency of the company and making it more productive. The characteristics of interest are, in particular, the culture, demand patterns and institutions that make it possible to concentrate production in different places and thus serve several markets. In this way, companies could achieve advantages such as economies of scale, cost reduction and risk diversification. The search for efficiency can be as much in the productive processes level as in the products. The search for strategic assets aims to achieve long-term skills and resources in order to sustain or increase the competitive advantages of companies. These strategic assets may be of a tangible nature, such as communications infrastructures or intangible assets such as organizational skills, technological, innovation or management skills. This type of investment aims to reinforce the advantages of multinationals that allow them to differentiate themselves from the competition, bringing benefits in particular through the opening of new markets, synergies in terms of R&D and technological innovation.
In summary, there are three hypotheses that emerged from international trade theory to explain the location of FDI. The hypothesis "factor proportions" (Helpman, 1984, Markusen, 1984, Helpman and Krugman, 1985, Ethier and Horn, 1990), the “proximity-concentration” hypothesis (Krugman 1983, Horstmann and Markusen 1992 Brainard 1993, 1997) and the “internalization” hypothesis (Ethier, 1996; Horstman and Markusen, 1987; Dunning, 1988,
8 1993; Ehtier and Markusen, 1996). The first hypothesis assumes that firms in order to benefit from the low costs of production factors locate their subsidiaries in places that allow them to have that advantage. That is, the firm will place its headquarters in the capital-abundant market and concentrate production in the labor abundant location, exporting back to the headquarters market. The second hypothesis explains the location of business activities through the trade-off between proximity to consumers and concentration of production. In spite of assigning some opposite roles to some variables (e.g. regarding transport costs), these two hypotheses are not necessarily mutually exclusive (Brainard, 1997), since the proximity-concentration hypothesis is essentially tailored to explain horizontal FDI whereas the factor-proportions hypothesis is more suitable to account for the emergence of vertical FDI. (de Mello-Sampayo, 2009) Finally, the hypothesis "internalization" reveals that EMs have their own advantages that are better monetized internally. That is, if the product or service that the company provides requires a local presence in order to guarantee the quality or even best meet the preferences of consumers, then FDI will be the best choice of market penetration. Economic models based on the first two hypotheses center on the decision to export or relocalize production given the factor prices. While the model based on the hypothesis "internalization" centers the decision between the licensing and the FDI. (Mello-Sampayo, 2013)
To capture the recent trends Grossman and Rossi-Hansberg (2006a,b) extend the traditional trade theory framework to allow for trade in tasks. Increasingly, international trade involves not only complete goods but also individual tasks. In the new global production processes, specialization can be achieved without geographic concentration. This allowed firms to take advantage of differences in factor costs and expertise across countries. As globalization has advanced, it has become easier to move intermediate level tasks offshore. (de Mello-Sampayo, de Sousa-Vale, & Camões, 2010) Grossman and Hansberg, (2012) propose a theory of trade in tasks between countries that have similar relative factor endowments and technological capabilities, but may differ in size. Tasks can be performed at home or abroad, but offshoring entails costs that vary by task, thus tasks with the highest offshoring costs may not be traded.
International outsourcing or offshoring and offshore outsourcing or international outsourcing are concepts linked to the relocation of the productive process to the foreigner by a company. The international outsourcing phenomenon according to Nguyen & Lee (2008) is one of the main forms of FDI and so it is important to mention the different definitions of the concepts described above. According to the UNCTAD (2004) definition, the concept of
9 offshoring is used when the production of a particular company is transferred abroad and carried out either by a subsidiary of the company itself or by another local company or subsidiary of another multinational company (offshore outsourcing). Offshore outsourcing or international outsourcing are cases where the production is carried out abroad by an entity external to the company is local or subsidiary of another multinational company. That is, there is a subcontracting of certain parts of production that allow the development of intermediate goods essential for the final product or service. So “offshoring” means the performance of tasks in a country different from where a firm's headquarters are located whereas “outsourcing” means the performance of tasks under some contractual arrangement by an unrelated party. Thus, offshoring can be conducted in-house or at arms-length, while outsourcing can be performed in a domestic or foreign location. (de Mello-Sampayo et al., 2010) The company chooses to perform offshoring only if such movement is considered beneficial in the medium and long term.
2.2 Empirical Studies in FDI
There are a large number of studies carried out to identify the determinants of FDI in the country of origin, and a large part of these determinants are considered essential for the attraction of foreign investment. The determinants are, factors or characteristics of a country that affect the decision of an MNE to invest in that country and the attractiveness of these factors depend on several aspects, such as the type of investment, the sector in which they want to invest, the reason for the investment and the size of the company, among others. The following studies analyze the determinants of FDI internationally and then the particular case of Portugal.
Rodríguez e Pallas (2008) carried out a study that analyzes a set of three factors, macroeconomic, regional and sectoral in Spain during the period from 1993 to 2002 in order to examine which were the ones that attracted the FDI most successfully. The results showed that the productivity and export potential of the production sectors positively influence the inflows of FDI. Regarding the macroeconomic factors used, which measured the situation in Spain compared to the EU average that had the most effect on the FDI, were the fiscal pressure and the differential of inflation.
Amal e Seabra (2007) elaborated a study on the determinants of FDI in Latin America, highlighting the institutional variables during the period from 1984 to 2001. The conclusions revealed that the institutional environment is an important factor to explain FDI, political risk and economic freedom were the most influential factors in the FDI decision. Dewit, Görg, &
10 Montagna (2009) in a study on the relationship between flexibility in the labor market and the decision to locate MNEs concluded that lack of flexibility in work in the country of origin tends to discourage external FDI. Therefore, the rigidity in the labor market reduces the IDE attracted. Nunnenkamp e Spatz (2002) analyzed the determinants of FDI in 28 developing countries since the late 1980s, in order to determine whether traditional factors continue to be considered more important than nontraditional factors in investment decisions. The authors concluded that the importance of nontraditional factors had a modest increase, however, traditional factors continued to be more relevant in determining FDI.
Carstensen e Toubal (2004) investigated through a dynamic panel model the determinants that attract FDI flows from OECD countries to seven transition countries in Central and Eastern Europe. The results showed that the comparative advantages of the CEECs, namely low labor costs and corporate tax rates, have a significant influence on the motivations that drive MNEs to invest in these countries. The risk of the country, more specifically the uncertainty associated with the legal, political and economic environment, represents an impediment to the realization of FDI.
Nonnenberg e Mendonça (2005) through a study elaborated with data from 33 developing countries during the period from 1975 to 2000, observed that the relation between GDP per capita and FDI flow was positive. Karmali (2013) carried out a similar study on the determinants of FDI in seventeen developing countries during the period 1994-2009, where he noted that GDP growth, trade openness positively influenced FDI flows. Meanwhile, the exchange rate had a negative effect on FDI inflows. It also found that as the external debt increased, the FDI also increased contrary to the expected since it is an important indicator that reflects the level of indebtedness, that is, the financial conditions of the economies. Another study, such as Chakrabarti (2001), also concluded that the variables related to economic growth are positive determinants of FDI.
Amarandei (2013) studied the impact of corruption on FDI inflows attracted by CEE countries, and concluded that there is a significant negative relationship between both. As one declines, there is a possibility that the other will increase, as investors make a prior analysis of the business environment of the country in which they want to invest. Egger & Winner (2005) concluded the opposite effect, that is, corruption positively affects FDI.
King (2003) through the analysis of economies in transition, concluded that the population of a country is one of the most important determinants of FDI, and a country with
11 more population is more likely to receive FDI. Nagano (2013) also concluded that the level of population of a country where a company could invest positively influences this decision making.
For Lokesha & Leelavathy (2012) the economic stability of countries was related to the attractiveness of FDI, as it strengthened the economy and thereby attracted FDI. Ranjan & Agrawal (2011) also concluded that GDP is an important determinant that increases the attractiveness of a country. Bhasin & Jain (2013) studied the Asian economies and the determinants of firms in these countries to invest abroad and concluded that economies with the highest GDP tend to invest more abroad.
2.3 Empirical Studies on the Determinants of FDI in Portugal
One of the first studies on the determinants of FDI in Portugal was developed by Matos (1973), who listed several factors that attract FDI in Portugal, such as political and monetary stability, the existence of natural resources, cheaper labor costs than other European countries, easy access to credit, lower corporate tax rates and privileged access to other European markets.
Leitão e Faustino (2010) analyzed the link between FDI inflows in Portugal from other European countries for the period 1996 to 2006. The results of the study using static and dynamic panel data showed that lower wage countries attract more FDI as well as, openness to international trade and market size are factors with a positive impact on FDI. Contrary to expectations, inflation has a positive influence on FDI, while the geographical distance has a negative effect. Another study on Portugal conducted by Tavares & Teixeira (2006) evidenced the influence of human capital on the attraction of FDI, concluding that it is a determinant with a positive and significant impact.
Leitão (2011) in the study on the reasons why foreign companies invest in Portugal during the period from 1995 to 2008, concluded that factors such as cheap labor costs and macroeconomic stability have a positive impact on the attraction of FDI in Portugal. Regarding corruption, the results showed that it is a factor that negatively influences FDI and also concluded that the globalization index promotes the attraction of FDI.
Botelho, Silva, & Sousa (2014) concluded, through a study on the main determinants of FDI in Portugal from 2002 to 2010, that FDI is attracted by determinants, size of market, rate of tax applied to companies, volume of credit, exports and external indebtedness.
12 In summary, the empirical works on FDI in Portugal suggest that determinants such as lower wages, the influence of human capital and the size of the market are the ones that have the most positive impact on the FDI. As for the factors that showed a negative impact on FDI in Portugal, corruption and geographic distance were the ones that stood out.
13 3. Foreign direct investment in Portugal
Foreign Direct Investment plays an increasingly important and influential role in the most diverse countries. Portugal, is no exception, foreign capital inflows have taken a leading position in the national economy. Recognized as an internationally rich country because of its climate, the extension of the Atlantic coast, a lower average cost of living compared to others in the European Union, has become a destination not only for living but for investing. However, the evolution of FDI has not always been constant, several factors have influenced this progress such as the economic situation of the country, market trends and the global economic situation.
3.1 Historical Perspective
The beginning of FDI in Portugal essentially took place in the 1960s with the entry of Portugal into European Free Trade Association (EFTA), resulting in an opening of the economy to foreign trade, focusing mainly on labor intensive activities directed towards exports (OECD, 1994). Several MNCs from EFTA member countries have invested in Portugal since then, which has seen a significant increase in FDI received in comparison with previous periods, thus allowing the development of new industries in Portugal. After this period the revolution of 1974 occurred, a time of great tension for the Portuguese economy with consequences to the level of the political and social instability that caused a decrease of the investments. In the following years, in the 1980s there were several measures to promote foreign investment and thus make Portugal an attractive place again. Portugal's accession to the European Economic Community (EEC) in 1986 allowed the country to assume a more liberal role in relation to FDI. However, since 1990, Portugal suffered a period of slowdown which coincided with Portugal's actual entry into the European Union and the phenomenon of globalization, which has gained a worldwide position. In the second half of the century, the expansion of investments in Portugal was evident with emphasis on a particular project that helped to boost the automotive industry, the case of Autoeuropa.
FDI in Portugal to this day has been experienced some oscillations, particularly in the type of investments it has received from foreign MNCs. The majority of FDI in Portugal is industrial, although in the last ten years there has been a growth in projects related to sales and marketing. Since 1997, there has been a slight and progressive decline in manufacturing projects from 67% to 56% in 2008. In 2008, Portugal was one of the countries with the least
14 investment projects received, only 59% compared to the European average of 74% creating an average of 157 jobs from the projects invested.
The crisis of 2008 has deteriorated the image of Portugal consequently the investments raised decreased in 2009-2010 due to the international financial instability, making very vulnerable the permanence of the investors already established in the country. According to a study conducted by Ernst & Young (EY) in 2009, investor interest in Portugal decreased from 15% in 2008 to 9% in 2009. In the world context, FDI in 2010 grew by about 5%, representing 2% of world GDP, but still below the values registered in 2007.
According to the survey of EY 2011, most investors consider that successive decreases in the rating of Portugal penalized the attractiveness of the economy in attracting investment. Between 2005 and 2011, Europe lost 38% of world FDI inflows, the market share of investment capture fell from 32% to 27% and the contribution to GDP declined from 3.5% to 1.8%.
However, over the last 4 years a growth relative to the investments raised as a result of investors' positive reaction to government stabilization efforts. FDI inflows in 2016 reached 6 billion dollars, considered the European country with the highest positive rate of investment intention, capturing in the same year a record of 59 new projects. As regards the creation of jobs, in 2015, 3500 jobs were created, while in 2016 only 2,500 jobs were created. The European Union continues to be the main supplier of FDI in Portugal, with Spain and the Netherlands contributes most, according to Santander Trade Portal data.
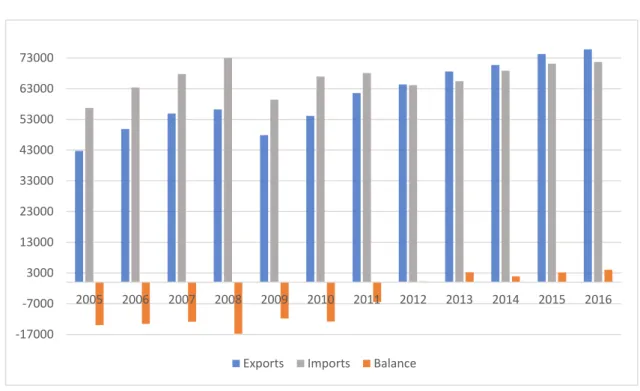
The Portuguese economy showed a capacity for adaptation and restructuring due to the internationalization of national companies, as we can see in Figure 1, the level of exports with an increase in 2016 compared to 2015. This increase in 2016 represents 2.2% of the national GDP. Figure 1 represents the trade balance, that is, the levels of imports and exports from Portugal. Through Figure 1 we can see that from 2012 onwards the trade balance registered positive values, ie, Portugal exported more than imported, registering the highest value in 2016.
15 Due to the improvement that Portugal presented, it comes in 25th place (among 190 countries) in the World Bank's "Doing Business of 2017" classification. For the main countries in the exports of goods, Spain continues in the lead following France and Germany, which together represent about 50.2% of the total exported by Portugal. Figure 2 also shows that the UK comes in 4th place with approximately 7.1% of the total exported.
Source: Adapted from PORDATA
-17000 -7000 3000 13000 23000 33000 43000 53000 63000 73000 2005 2006 2007 2008 2009 2010 2011 2012 2013 2014 2015 2016
Exports Imports Balance
Source: Adapted from PORDATA, INE
25,9% 12,6% 11,7% 4,9% 1,4% 7,1% 0,3% 3,0% 1,1% 3,5%3,7% 24,9%
Spain France Germany U.S
China United Kingdom Japan Angola
Brazil Italy Netherlands Others
Figure 1-Trade balance (millions €)
16 3.2 Why invest in Portugal?
According to studies and reports prepared by several companies, namely AICEP Portugal, the Global Competitiveness Report published by the World Economic Forum (WEF) and WhyPortugal 2017 published by a law firm, several reasons justify the reasons for the investment in Portugal.
Considered the 12th most attractive place to do business in Europe and the 25th in the world, Portugal has improved its competitiveness and is currently the 46th most competitive country among 137 countries, according to the WEF ranking. The ease of doing business in Portugal, makes it very attractive to foreign investors, and in average to start a business takes 4.5 days. Positioning itself in 1st place, of the top 5 of EU countries, where it is easier to create a company and in 32º place worldwide.
As regards the economic recovery, Portugal has once again recorded economic growth and the unemployment rate has been declining, encouraging signs that have sustained exports. The number of exporting companies has increased, leading to greater diversification as more exports originate in non-EU countries and resulting in a larger international market share.
As far as location is concerned, Portugal has a privileged location to access relevant markets. Located on the West Coast of Europe, with more than 940km of coastline, it is the closest European country to the African Continent as well as the United States and Canada constituting an important gateway to the EU market and a focal point for international routes. It has 15 airports, of which Lisbon, Porto and Faro are the three international airports of the country, and Lisbon is the most dynamic, accounting for about 49.2% of flights scheduled.
Portugal is the 18th country in the world with the best infrastructure, the quality of the Portuguese roads makes it one of the best in the world, placing it in 8th place, possessing one of the most developed, extensive and qualified highway networks. Leader in the execution of operations through the ATM network and pioneer worldwide in the management of tolls, Portugal is a top country with regard to the provision of technological services, providing the latest technologies created in the market.
The Portuguese workforce is of high quality coming from a modern and fully developed educational system, and the schooling rate follows this evolution. It registers a high level of education in business-oriented areas, accounting for about 30% of the total number of graduates in 2016, with about 60% of the population speaking at least one foreign language.
17 With regard to support and incentives, Portugal through the 2020 program in partnership with the European Commission, for the period 2014-2020, has been implementing several measures aimed at improving the competitive factors that focus on the quality of production, innovation, technological development and entrepreneurship. As well as improving quality of life, efficient and sustainable use of resources, promotion of employment and social inclusion, among others. Other incentives such as the internship program, job creation incentives and R & D investments have been created to assist businesses and investors.
The European Commission has nominated Portugal as a moderate innovator in the European Innovation Scoreboard 2016 which shows a positive evolution in the development of the startups ecosystem, with Lisbon being considered one of the largest startup hubs in Europe with successful projects such as Startup Lisbon and the Fab Lab Lisboa. Several programs have already been implemented by the Government in order to support technological development and innovation such as the Portugal 4.0 initiative, whose main objective is to increase the capacity to create resources for new technologies.
Portugal is a modern country, so keeping up with the trends made innovation a priority in many sectors. The tourism sector has been gaining more and more importance in the development of the economy and therefore the interest of the investors in this area is increasing, attracting new investments.
However, there are still factors that in the eyes of investors become less attractive for future investments. According to the EY European Attractiveness Survey 2017, factors such as tax rates, the Portuguese domestic market, the stability and transparency of the political, legal and regulatory environment as well as the flexibility of labor regulation were considered the least attractive. The most attractive were the stability of the social context, the labor costs and the levels of qualification of the local workforce.
18 Through the analysis of Figure 3 we can see that 76% of the respondents recognize the potential of productivity growth as a very attractive factor, being visible the increase of this factor in comparison with the previous year. Conversely, the factor of qualification of local labor along with telecommunications infrastructures decreases in the ranking of factors of attractiveness in Portugal.
Another study, developed by the World Economic Forum (WEF), highlights a set of factors classified as the most problematic for conducting business in Portugal. First place in the ranking is government bureaucracy and inefficiency (19.1%) followed by tax rates (18.7%), restrictive labor laws (13.8%), political instability (13.1%) and access to finance (10.2%).
In summary, Portugal has gone through difficult periods over the years that have resulted in negative consequences for a number of sectors, including the decrease in investments raised. However, due to the efforts and perseverance of the Portuguese in recent years this effect has been reversed and FDI into Portugal has increased. Portugal registered in 2016, 6 billion dollars of FDI inflows and a record of 59 new projects, ranking Portugal 25th place in the World Bank's "Doing Business" report of 2017. Portugal registered an improvement in 2017 in some attraction factors such as domestic markets, flexibility of labor legislation, potential of productivity increase and the stability of social climate. However, there are still factors
Source: Adapted from EY Portugal Attractiveness Survey 2017
0% 10% 20% 30% 40% 50% 60% 70% 80% 90% 100% Stability of social climate
Labor cost Local labor skills level Telecommunication infrastructure Potential of productivity increase Transport and logistic infrastructure Flexibility of labor legislation Incentives offered by government Corporate taxation Stability and transparency of political, legal and…
Domestic market
2017 2016
19 considered problematic for investors such as government bureaucracy and inefficiency, tax rates, restrictive labor laws, political instability and access to finance.
4. Methodology
In this Chapter it will be presented the empirical analysis of the factors attracting FDI into Portugal. The empirical study aims to analyze the attraction factors of FDI in Portugal in the time period delimited between 2000 and 2016. The countries under analysis are Netherlands, Spain, Luxembourg, Belgium, Switzerland, Italy, France, the United States, Germany and United Kingdom.
First, the data used in this empirical application is analyzed graphically. The expected effects for each factor affecting the location of FDI in Portugal is discussed. Then the time series properties of the data are ascertain using panel data unit root tests, in order to choose the appropriate econometric panel data method. Given the time series properties of the data, the generalized method of moments (GMM) is used.
The model2 to analyze the main determinants attracting FDI into Portugal is as follows:
LFDIit= αLFDIit-1+ β1LrGDPit +β2LrLCit + β3LrLQit + β4LrCORit + β5LGLit +
𝜀
itWhere, i = 1,2,…,10 denotes countries
t = 2000,…,2016 denotes time periods (years). (1)
Where LFDIit is the log of the stock level of FDI of country i in the panel, at time t. The
explanatory variables include the following: LGLit is the log of the distance, as a proxy for
transport costs, between Portugal and the country i, at time t. LrGDPit is the log of Portuguese
GDP relative to country i’s at time t. LrLCit is the log of Portuguese average annual wages
relative to the country i and LrLQit is the log of the Portuguese qualified labor relative to country
2 The model used in this empirical study depended largely on the data available on the determinants of FDI into Portugal. We intended to include more factors explaining the location of FDI in Portugal, such as political stability, economic stability, trade openness, natural resources, economic freedom and starting a business. However, due to Data limitations we had to simplify the empirical model.
20
i’s at time t. LrCORit is the log of the Portuguese corruption index relative to country i’s at time
t, and 𝜀 is an idd error term. 4.1 Data
In this dissertation, it is intended to analyze the relationship between the dependent variable, in this case FDI into Portugal, and the factors attracting investment to Portugal.
There are several indicators that can be used as proxy for the FDI, however I chose to use as a dependent variable the stock of the FDI, since the stock variable is less volatile than the volume of inflows according to several empirical works such as of Cheng & Kwan (2000) and Stein & Daude (2007). Data were collected from the Bank of Portugal platform, it is in real terms and in millions of US dollars.
Figure 4 analyzes the evolution of FDI in Portugal from the countries under study. Spain was the country that invested the most in Portugal in recent years, and it is possible to observe investment growth in most countries. Netherlands is the second most invested country, exceeding Spain's investment between 2012 to 2014. The country that invested least was Switzerland. Independent variables 0 5000 10000 15000 20000 25000 30000
FDI
Netherlands Spain Lux UK
France BL Germany USA
Sw Italy
21 The independent variables are the potential locational determinants of FDI. The expected effects for each determinant are presented in the following paragraphs.
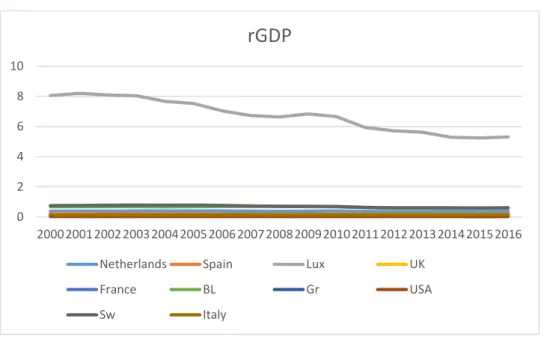
The rGDP proxies the Portuguese market size relative to the market size of the investors. The studies of Nonnenberg & Mendonça (2005) and Karmali (2013) used GDP as an explanatory variable in their models revealing a positive influence on FDI. In this study, it is expected a positive effect, since the larger the Portuguese market relative to the investor, the more FDI one expects to observe. The factor also attempts to capture the economies of scale effect, since the larger the market, the more the firm gains in concentrating the production in one location. The GDP is in real terms and in millions of dollars, from the OCDE.
Figure 5 shows the evolution of the Portuguese market that is measured by the relative GDP variable. We can observe a decrease of the Portuguese market in relation to Luxembourg, as the other countries maintain relatively stable with values lower than 1 over the years, since the Portuguese market is smaller than the others, with the exception of Luxembourg.
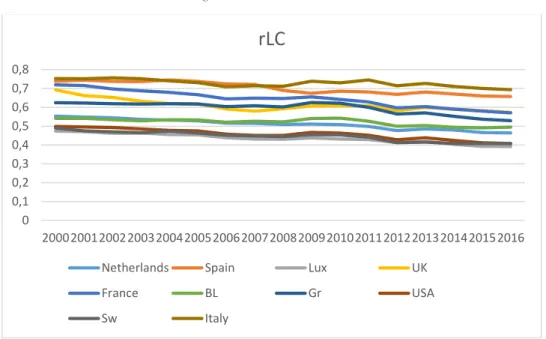
The labor cost variable, denominated LC in the model, is measured through the country's average annual wages and according to studies, they have positive and negative effects on FDI. According to Carstensen & Toubal (2004) low labor costs have a significant effect on FDI, while Cheng & Kwan (2000) revealed in their studies a negative correlation between the 2 variables. LC were collected from the OECD in dollars.
0 2 4 6 8 10 20002001200220032004200520062007200820092010201120122013201420152016
rGDP
Netherlands Spain Lux UK
France BL Gr USA
Sw Italy
22 Figure 6, shows Portugal's relative labor cost (rLC), and we find that there is a slight decrease in labor cost in relation to all countries under study over the years. The LC variable is measured through annual average of real wages and therefore a decrease in this means that wages have decreased, meaning that labor costs have decreased.
Labor quality, a variable denominated LQ, can be analyzed by the percentage of the working age population with an advanced level of education who are in the labor force, which allows to determine the competitiveness of the population of a country. According to studies by Nonnenberg & Mendonça (2005) and Sun, Tong, & Yu (2002), this determinant is significant for FDI, so a positive effect of labor quality on FDI is expected. LQ was extracted from the World Bank platform.
0 0,1 0,2 0,3 0,4 0,5 0,6 0,7 0,8 20002001200220032004200520062007200820092010201120122013201420152016
rLC
Netherlands Spain Lux UK
France BL Gr USA
Sw Italy
23 Figure 7 analyzes the evolution of Portugal's relative Labor Qualification variable over the years. We can observe that the qualification of the Portuguese population remained constant with respect to the other countries under study. The qualification of the Portuguese population is measured by the educational level of the active population, and the constant values of this mean that the population maintained the same level of education over time.
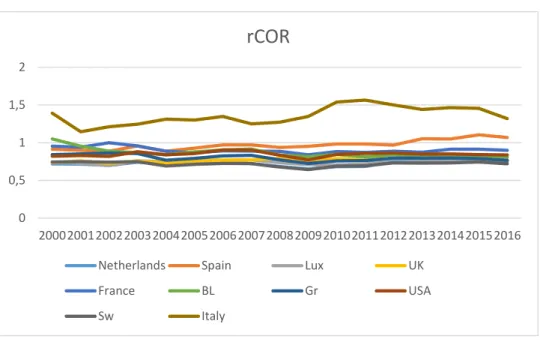
Corruption is measured through the Corruption perception index, which will be treated under the name COR in the model, of the organization Transparency International. The index assigns a score of 0 to 100 to the countries and according to several authors the effect of corruption in the FDI can be negative as positive. The higher the score the lower the level of corruption in the country. Amarandei (2013) and Habib & Zurawicki (2009) have shown through their studies that this determinant is an obstacle to FDI while Egger & Winner (2005) concluded the opposite effect, corruption has a positive effect on FDI.
0 0,2 0,4 0,6 0,8 1 1,2 1,4 20002001200220032004200520062007200820092010201120122013201420152016
rLQ
Netherlands Spain Lux UK
France BL Gr USA
Sw Italy
24 Figure 8, which corresponds to the level of corruption in Portugal, is measured by Transparency International's perception of corruption index. We verified that the transparency of Portugal's economy relatively to Italy, is above the transparency of the other countries which may mean an improvement in the rights of the free economic activity of the population. The remaining countries remain with relative values below the unit indicating that their economies are more transparent than in Portugal.
Through the coordinates of the main investor countries in Portugal, it was allowed to calculate distances as a proxy for transport costs. According to Brainard (1997) and the proximity-concentration hypothesis, higher transport costs lead to cross-border production expansion and thus encourage FDI. So the relationship between the two variables is positive.
Table 1- Correlation Matrix
LFDI LrGDP LrLC LrLQ LrCOR LGL LFDI 1.000 LrGDP 0.1553 1.000 LrLC 0.2286 -0.3809 1.000 LrLQ -0.3101 0.1081 0.1764 1.000 LrCOR -0.0475 -0.3129 0.6620 0.3088 1.000 LGL -0.4882 -0.2755 0.5378 0.2006 -0.1753 1.000 0 0,5 1 1,5 2 20002001200220032004200520062007200820092010201120122013201420152016
rCOR
Netherlands Spain Lux UK
France BL Gr USA
Sw Italy
25 In Table 1 we observed a high positive correlation between the COR and LC variables (66.20%) and not so high between the GL and LC variables (53.78%). We also verified that there is a negative correlation between some variables, such as GL and FDI (48.82%).
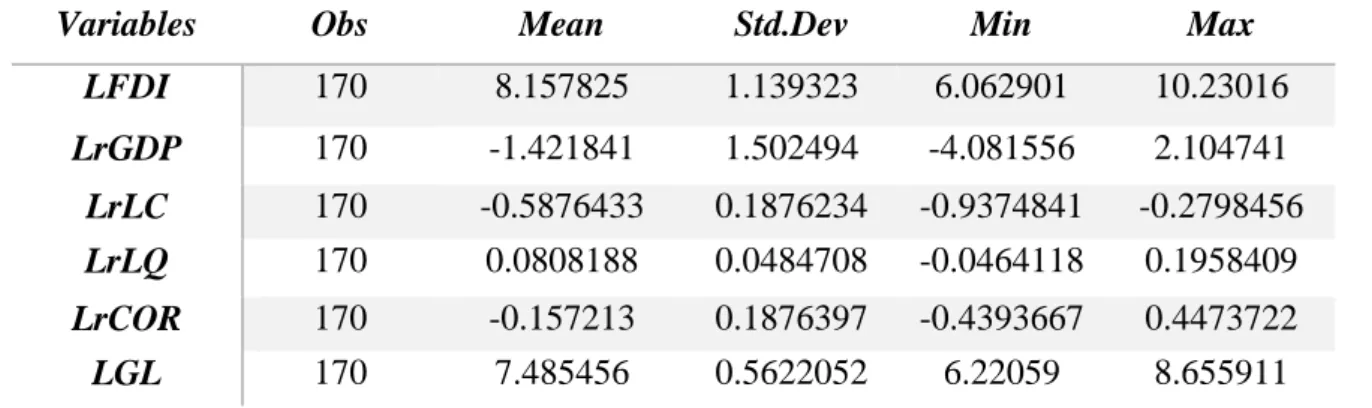
Table 2- Descriptive Statistics
Table 2 presents the descriptive statistics calculated for the variables used in the empirical application.
4.2 UNIT ROOTS TESTS
The tables below show the results found after the estimation of the unit root tests. These tests allow the analysis of the stationarity of the series. The condition of stationarity is applied when | ρ | <1. If | ρ | = 1 we are facing a non-stationary series in which the variance increases with time and tends towards infinity. Different types of tests were used given the characteristics of the data, such as Levin-Lin-Chu (LLC), Im-Pesaran Shin (IPS) and Fisher type-ADF.
The first table (Table 3) shows the different tests done to the dependent variable FDI to ascertain its stationarity. We verified that in all the tests the null hypothesis is not rejected, that is, the variable contains unit roots. Next, we test again the stationarity but now to the variable in first difference where we can observe through the table 4 that are stationary and integrated of order one I (1).
Table 3- FDI1 Unit Root tests
Tests LFDI
p-value
LLC 0.5269
IPS 0.9877
ADF-Fisher 0.9567
Note: ***, **,* statistically significant at 1%, 5% and 10% respectively.
Variables Obs Mean Std.Dev Min Max
LFDI 170 8.157825 1.139323 6.062901 10.23016 LrGDP 170 -1.421841 1.502494 -4.081556 2.104741 LrLC 170 -0.5876433 0.1876234 -0.9374841 -0.2798456 LrLQ 170 0.0808188 0.0484708 -0.0464118 0.1958409 LrCOR 170 -0.157213 0.1876397 -0.4393667 0.4473722 LGL 170 7.485456 0.5622052 6.22059 8.655911
26 Table 4- First Difference test
Tests D.LFDI
p-value
LLC 0.0012
IPS 0.0000
ADF-Fisher 0.0000
Note: ***, **,* statistically significant at 1%, 5% and 10% respectively.
Table 5 shows that the variables LrGDP, LrLC and LrCOR are stationary since they reject the null hypothesis, whereas the variable LrLQ is non-stationary. Then, in the table 6, the test was done again to the variables in first difference where the stationarity of all variables was concluded.
Table 5 – LLC unit root test
Variables LLC test p-value LrGDP 0.0000*** LrLC 0.0058*** LrLQ LrCOR 0.5776 0.0028*** LGL ---
Note: ***, **,* statistically significant at 1%, 5% and 10% respectively.
Table 6- First difference LLC test
Variables LLC test p-value D.LrGDP 0.000*** D.LrLC 0.000*** D.LrLQ D.LrCOR 0.0022*** 0.000*** D.LGL ----
Note: ***, **, * statistically significant at 1%, 5% and 10% respectively.
Table 7 shows the results of the IPS test performed on the variables in relative terms, where we can verify that the variables do not reject the null hypothesis, ie, contain unit roots. We test the first differences of the variables and conclude that they are stationary and integrated of order one, I (1) as shown in table 8.
27 Table 7- IPS unit root test
Variables IPS test
p-value LrGDP 0.1568 LrLC 0.6372 LrLQ LrCOR 0.9220 0.3599 LGL ----
Note: ***, **, * statistically significant at 1%, 5% and 10% respectively.
Table 8 – First Difference IPS test
Variables IPS test
p-value D.LrGDP 0.000*** D.LrLC 0.000*** D.LrLQ D.LrCOR 0.000*** 0.000*** D.LGL ----
Note: ***, **, * statistically significant at 1%, 5% and 10% respectively.
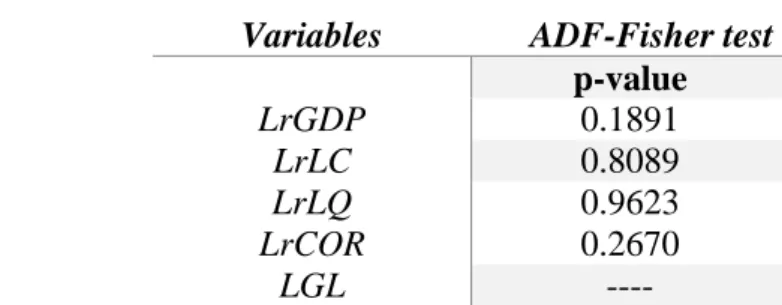
According to the ADF-Fisher test shown in Table 9, the variables in relative terms contain unit roots, since they did not reject the null hypothesis. We again tested the stationarity of the variables now around the first differences and concluded that they are stationary and integrated of order I (1) as can be seen in Table 10.
Table 9 – ADF-Fisher unit root test
Variables ADF-Fisher test
p-value LrGDP 0.1891 LrLC 0.8089 LrLQ LrCOR 0.9623 0.2670 LGL ----
Note: ***, **, * statistically significant at 1%, 5% and 10% respectively.
Table 10- First Difference ADF-Fisher test
Variables ADF-Fisher test
With trend
D.LrGDP 0.03***
D.LrLC 0.000***
28
D.LrCOR 0.000***
D.LGL ---
Note: ***, **, * statistically significant at 1%, 5% and 10% respectively.
4.3. Econometric method
After analyzing the data, through the Unit Roots tests to the variables under study, it is important to reflect on the econometric method applied to the empirical model. In this case, since the variables at the first differences are all stationary, the econometric method chosen will be the generalized method of moments (GMM) in order to include all variables in the analysis, since this method uses the variables at the first differences. There are several problems that can arise in estimating equation (1) such as the correlation between the regressors and the term error; the fixed effects, contained in the term error, may be correlated with the explanatory variables; the presence of the lagged dependent variable can give rise to autocorrelation and lastly a small database with a limited number of years.
Under these conditions or when estimating dynamic models under panel data, Arellano and Bond (1991) difference GMM estimator proposes a wider set of instruments, which include all past values of the dependent variable, solving these problems. This method uses the lags of the endogenous regressors making the variables predetermined and therefore uncorrelated with the term error. The fixed effects disappear as it turns the regressors into the first difference and these do not vary over time. The first-differenced lagged dependent variable is also instrumented with its past levels and lastly this estimator was created for short periods of time which is our case.
4.5 Results
The results of the estimation of Equation (1) are presented in Table 11. Equation (1) attempts to test the proximity-concentration hypothesis, firms are more likely to expand production the greater the transport costs and the smaller the investment barriers and the size of economies of scale. Whenever the advantages of access to the target market outweigh the advantages of economies of scale, the theory holds that firms must expand across borders. The transport costs are proxied by the geographical location (rGL), the economies of scale by rGDP, the barriers to investment by the transparency of the Economy (rCOR). Other variables included in our analysis LC and LQ attempt to test the factor-proportion explanation of FDI location.
29 Table 11- Arellano-Bond dynamic panel-data estimation of equation (1)
Coef. Std.Err p-value
LFDI Lag1 0.6357 0.4491 0.157 LrGDP -1.2584** 0.6923 0.069*** LrLC -0.0924 1.6449 0.955 LrLQ 0.4535 1.9550 0.817 LrCOR -0.0489 0.6030 0.935 LGL 0.1709 0.4897 0.727 Number of instruments = 34 Wald chi2(6)= 926.68
Note: ***, **, * statistically significant at 1%, 5% and 10% respectively.
After the estimation of the model, the coefficient of determination R-Square was calculated, which approximated 0.57, i.e. the variation of the factors included in the model explains around 57% the variation of FDI into Portugal. This suggest that this simple model explains fairly FDI into Portugal.
Analyzing Table 11, we find that the variables LFDI_Lag1, LLC, LLQ, LLCOR and LGL though not statistically significant have the expected signal. Since the coefficient of FDI_Lag1 is 0.64, as expected FDI into Portugal is persistent, depending on past values. The low relative labor costs, as well as high labor qualifications attract FDI into Portugal from other European Countries and US. As for the variable LGDP is significant but does not have the expected signal, what can be explained by the relative small size of Portuguese economy. As expected, transport costs affect positively FDI in Portugal. Since Portuguese economic transparency is lower than other countries (with exception to Italy and Spain), COR has affected negatively FDI into Portugal.
The rGDP variable that proxies the relative size of the Portuguese economy has a negative effect, contrary to what was expected. An explanation for this relationship may be related to the fact that Portugal is a small country and therefore FDI into Portugal will be used for export and not for domestic consumption. Botelho, Silva, & Sousa, (2014) had the same conclusion in their study on Portugal, that is, the size of the market influences positively FDI.
30 Relative Labor Cost (rLC) shows the expected negative sign for Portugal, ie the cheap labor cost measured through the average wage level is more favorable to the attraction of FDI. Leitão & Faustino, (2010) concluded the same in their study on Portugal, that is, countries where wages are lower attract more FDI. The factor-proportions hypothesis explains this result in that it predicts that firms exploit locations where low production factor costs predominate and therefore, countries where wages are lower are consecutively more attractive to investors.
The variable rLQ showed the expected positive effect, so the higher the qualification of the Portuguese population the greater the investment by the foreign investors. This way, the workforce with the highest qualification is a positive and attractive aspect for investors.
Since Portuguese economic transparency has been lower than other countries, i.e. Portugal has had more corruption, COR has affected negatively FDI into Portugal. High level of corruption in Portugal is negatively related to low levels of FDI following Leitao (2011), who concluded the same in his study about the reasons to invest in Portugal.
Concluding, the results suggest that FDI into Portugal is better explained by the factor proportion hypothesis, since what attracts FDI into Portugal is the low labor costs and high labor qualification. The lack of economy of scales effect combined with the positive effects of LC and LQ may also indicate that FDI into Portugal is more directed to the exporting sector rather than to the local market.