PERFORMANCE AND QUANTITATIVE AND QUALITATIVE CARCASS TRAITS
IN PIGS FED ON CANOLA MEAL
1LINA MARÍA PEÑUELA SIERRA2, IVAN MOREIRA3, PAULO LEVI DE OLIVEIRA CARVALHO4*, ADRIANA
GOMEZ GALLEGO3, LAURA MARCELA DIAZ HUEPA3, CLODOALDO DE LIMA COSTA FILHO3
ABSTRACT - Two experiments were performed for the purpose of determining the nutritional value and
assess the performance and carcass traits in pigs fed on canola meal (Brassica napus). Experiment I consisted
of a total digestibility trial conducted with 14 castrated commercial crossbred male pigs with 60.69 ± 4.26 kg initial live weight. The treatments consisted of a control diet based on maize and soybean meal and another diet containing canola meal (control + 25% canola meal). Each pig was an experimental unit, totalling seven experimental units per diet. The digestible energy and the metabolizable energy of canola meal used was 2,999
and 2,730 kcal.kg-1, respectively. These values were used to formulate the diets of the performance experiment.
Experiment II included 50 crossbred pigs with an average initial live weight of 29.90 ± 1.16 kg and an average final live weight of 60.33 ± 3.38 kg during the growing phase, and an average initial live weight of 60.37 ± 1.6 kg and an average final live weight of 90.37 ± 3.19 kg during the finishing phase. The experimental design consisted of randomized blocks, with four treatments (6, 12, 18, and 24% canola meal), 10 repetitions, and one pig per experimental unit. The control diet was formulated with 0% canola meal. The data were assessed using ANOVA test and the averages of the treatments were compared using Dunnett's test and regression analysis at a 5% probability level. The results suggest that it is possible to use up to 24% canola meal in the diets for pigs during the growing and finishing phases without affecting the performance and carcass traits.
Keywords: Protein food. Canola meal. Pigs.
DESEMPENHO E CARACTERÍSTICAS QUANTITATIVAS E QUALITATIVAS DE CARCAÇA DE SUÍNOS ALIMENTADOS COM FARELO DE CANOLA
RESUMO - Foram conduzidos dois experimentos com o objetivo de determinar o valor nutricional e avaliar o
desempenho e características da carcaça de suínos alimentados com farelo de canola (Brassica napus). No
Experimento I, foi conduzido um ensaio de digestibilidade total com 14 suínos mestiços de linhagem comercial, machos castrados, com 60,69 ± 4,26 kg de PV inicial. O alimento teste farelo de canola (FC), substituiu em 25% a ração referência à base de milho e farelo de soja. Cada suíno constituiu uma unidade experimental, totalizando sete unidades experimentais por ração. Os valores de energia digestível (ED) e energia metabolizável (EM) na matéria natural para o FC foram de 2995 kcal/kg e 2796 kcal/kg, respectivamente. No Experimento II, foram utilizados 50 suínos mestiços, com peso vivo inicial de 29,90 ± 1,16 kg e final de 60,33 ± 3,38 kg, na fase de crescimento, e peso vivo inicial de 60,37 ± 1,6 kg e final de 90,37 ± 3,19 kg na fase de terminação. Foi utilizado o delineamento de blocos inteiramente casualizados, com quatro tratamentos, (6, 12, 18 e 24% de FC), com 10 repetições e um suíno por unidade experimental. Adicionalmente, foi formulada uma ração testemunha, contendo 0% de FC. Os dados foram submetidos à análise de variância e adicionalmente foi aplicado o Teste de Dunnett, e análise de regressão, a 5% de probabilidade. Os resultados sugerem que é possível incluir até 24% de FC nas dietas de suínos, em crescimento e terminação, sem prejudicar o desempenho e as características da carcaça.
Palavras-chave: Alimento protéico. Farelo de Canola. Suínos.
______________________________ *Corresponding author
1Received for publication in 02/18/2015; accepted in 02/18/2016.
Paper extracted from the doctoral thesis of the first author.
2Department of Veterinary and Animal Science, Universidad del Tolima, Ibagué, TOL, Colombia; [email protected].
3Departament of Animal Science, Universidade Estadual de Maringá, PR, Brazil; [email protected], [email protected], [email protected], [email protected].
Rev. Caatinga
INTRODUCTION
Brazil is the fourth world producer and exporter of pigs and, in 2010, per capita pig consumption was 14.8 kg (ABIPECS, 2011).
Soybean meal (Glycine max) is the most used protein
source to formulate diets for pigs (CROMWELL, 2010). However, due to its high cost, it is necessary to evaluate other protein sources, such as canola
(Brassica napus), cotton (Gossypium herbaceum),
sunflower (Helianthus annuus), and peanut (Arachis
hypogaea).
Canola is a rapeseed cultivar (Brassica napus)
that contains low levels of glucosinolates in the seed (<3 μg g-1) and erucic acid in the oil (<2%) (Bell, 1993). In Brazil, its cultivation has been increasing as an option for the winter harvest and the production of oil rich in unsaturated fatty acids (SANTOS; BASSO, 1990).
Canola meal (CM) is a by-product of oil
extraction and has a great content of sulphur amino acids, ether extract, fibres, calcium, phosphorus (Keith & Bell, 1991), and vitamins of the B complex (niacin, thiamine, riboflavin, folic acid, and biotin), compared with soybean meal (BELL, 1993). However, it has limiting factors, such as the production of metabolites of glucosinolates, trypsin inhibitors, phytic acid, phenolic compounds, and tannins (TESKEREDZIC et al., 1995).
The goal of the present study was to assess the nutritional value of CM in diets for growing-finishing pigs and its effects on performance and carcass traits.
MATERIAL AND METHODS
The experiments were carried out in the swine sector of Iguatemi Experimental Farm, Agricultural Sciences Centre of the State University of Maringá, State of Paraná, Brazil (23°21' S, 52°04' W; 564 m altitude).
Were conducted two experiments. The first assessed the total digestibility of CM and the second assessed the performance of growing-finishing pigs and carcass traits. The CM was acquired in an agroindustrial firm of the State of Paraná, Brazil. The experimental procedures and the use of animals were previously approved by the Ethics Committee of the State University of Maringá, Approval Certificate No. 136/2010.
The digestibility experiment was carried out from March to April 2010 assessing 14 castrated commercial crossbred male pigs with initial live weight of 60.69 ± 4.26 kg. The pigs were housed in individual metabolism crates under controlled environment. The digestibility trial lasted 15 days, ten for adaptation and five for collecting faeces and urine. The control diet consisted of maize (72.97%),
soybean meal (24.45%), salt (0.570%), calcium carbonate (0.635%), dicalcium phosphate (0.875%),
and mineral-vitamin supplement (0.50%). These
components were formulated according to the requirements proposed by Rostango et al. (2005). Were used two diets (treatments): control; and control (75%) with addition of CM (25%) performing seven repetitions per treatment.
Provision of diets and collection of faeces and urine were performed according to the method proposed by Sakomura and Rostagno (2007). During the collection period, feed intake was calculated
based on the metabolic weight (kg0.75) of each pig
and the average consumption recorded during the adaptation period (approximately seven days).
Feed was provided at 8 a.m. (55%) and 3 p.m. (45%). It was moistened with water (20%) to avoid waste, reduce exposure to dust, and improve consumption. After each meal, were provided 3 mL of water/g-1 feed.
To set the beginning and the end of the faeces collection procedure, were used 3% iron oxide (Fe3O2) as faecal marker (SAKOMURA; ROSTAGNO, 2007) and faeces were collected once a day, packed in plastic bags and stored in a freezer (-18 °C). Subsequently, each sample was homogenized and dried (approximately 350 g) in a forced-ventilation oven (55 °C) and ground in a blade mill (1 mm sieve). Urine was collected in plastic buckets with 20 mL of HCI solution (1:1) to avoid bacterial growth and nutrient losses by volatilization. The analyses of feed and faeces were performed according to the procedures described by Silva and Queiroz (2002). Total energy values were determined by adiabatic calorimetry (Parr Instrument Compant, Illinois, USA). The digestibility coefficients of dry matter (DMDC), energy (EDC), protein (PDC), and organic matter (OMDC) were calculated according to the method proposed by Moreira et al. (1994).
Experiment II assessed the performance
during the growing (30-60 kg) and finishing (60 to
90 kg) phases and was carried out from July 2010 to February 2011. During the experiment, the minimum average temperature was 18.8 ± 2.32 °C and the maximum 29.1 ± 4.11 °C. Were used 50 commercial crossbred pigs whose average initial live weight was 29.90 ± 1.16 kg and the average finishing live weight was 60.33 ± 3.38 kg during the growing phase. During the finishing phase, the average initial live weight was 60.37 ± 1.46 and the average final live weight was 90.37 ± 3.19 kg. The pigs were housed in brick sheds divided into two sectors, each with 10
pens (7.60 m2 each) separated by a central corridor.
Each pen had pacifier-type drinkers at the back and
single feeders at the front, which provided free access to feed and water. The diets and water were
provided ad libitum throughout the experiment. The
and 2) were formulated as recommended by
Rostagno et al. (2005) for growing-finishing pigs.
We assessed the ileal digestibility to determine the digestible amino acids of the CM and the results were used to formulate the diets. Were determined the levels of protein, phosphorus, and calcium in maize and soybean meal samples at the Laboratory of Food and Animal Nutrition Analysis, State University of Maringa, Paraná, Brazil. The metabolizable energy values were those cited by Rostagno et al. (2005). The values of digestible
amino acids of maize and soybean meal were calculated using true amino acid digestibility coefficients reported by Rostagno et al. (2005).
The experimental design consisted of randomized blocks with four treatments (6, 12, 18, and 24% CM), 10 repetitions, and one pig per experimental unit. The pigs were weighed at the beginning and at the end of the experiment. Were determined the daily feed intake, the daily weight gain, and calculated the feed:gain ratio of each pig.
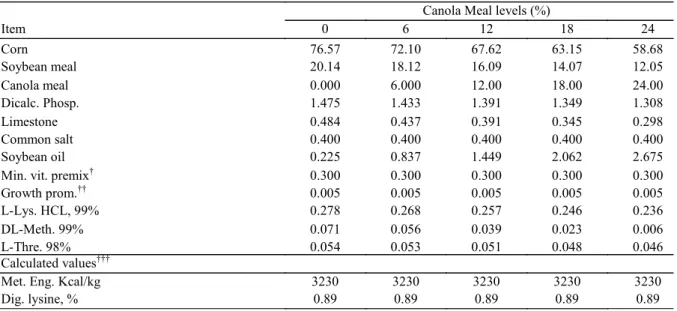
Table 1. Centesimal and chemical composition of diets containing different levels of canola meal (CM) for growing pigs feeding (30 a 60 kg).
Canola Meal levels (%)
Item 0 6 12 18 24
Corn 76.57 72.10 67.62 63.15 58.68
Soybean meal 20.14 18.12 16.09 14.07 12.05
Canola meal 0.000 6.000 12.00 18.00 24.00
Dicalc. Phosp. 1.475 1.433 1.391 1.349 1.308
Limestone 0.484 0.437 0.391 0.345 0.298
Common salt 0.400 0.400 0.400 0.400 0.400
Soybean oil 0.225 0.837 1.449 2.062 2.675
Min. vit. premix† 0.300 0.300 0.300 0.300 0.300
Growth prom.†† 0.005 0.005 0.005 0.005 0.005
L-Lys. HCL, 99% 0.278 0.268 0.257 0.246 0.236
DL-Meth. 99% 0.071 0.056 0.039 0.023 0.006
L-Thre. 98% 0.054 0.053 0.051 0.048 0.046
Calculated values†††
Met. Eng. Kcal/kg 3230 3230 3230 3230 3230
Dig. lysine, % 0.89 0.89 0.89 0.89 0.89
† 2 mg;
100 μg
†† †††
† Vitamin and mineral premix for growing pigs (kg of product): vitamin A, 50 000 UI; D3, 10 000 UI; E, 160 mg; K3, 12 mg; B1, 12 mg; B2, 20 mg; B6, 12 mg; B12, 100 μg; pholic acid, 2.4 mg; niacin, 140 mg; pantothenic acid, 88 mg; biotin, 0.4 mg; choline, 1248 g; iron, 800 mg; copper, 800 mg; cobalt, 3.2 mg; manganese, 220 mg; zinc,11.15 mg; selenium, 1.2 mg; Iodine, 7.2 mg. ††Leucomycin 30%. ††† Calculate based on Rostagno et al. (2005).
Table 2. Centesimal and chemical composition of diets containing different levels of canola meal (CM) for finishing pigs feeding (60-90 kg).
Canola Meal levels (%)
Item 0 6 12 18 24
Corn 81.58 77.59 75.35 73.11 70.88
Soybean meal 16.03 13.53 9.234 4.937 0.641
Canola meal 0.000 6.000 12.00 18.00 24.00
Dicalc. Phosp. 1.043 1.004 0.978 0.952 0.926
Limestone 0.445 0.398 0.355 0.312 0.269
Common salt 0.400 0.400 0.400 0.400 0.400
Soybean oil 0.105 0.700 1.222 1.745 2.268
Min. vit. premix† 0.150 0.150 0.150 0.150 0.150
Growth prom.†† 0.005 0.005 0.005 0.005 0.005
L-Lys. HCL, 99% 0.199 0.194 0.242 0.289 0.337
DL-Meth. 99% 0.015 0.000 0.000 0.000 0.000
L-Thre. 98% 0.029 0.028 0.050 0.073 0.096
L-Trytophan, 98% 0.004 0.005 0.014 0.024 0.034
Calculated values†††
Met. Eng. Kcal/kg 3250 3250 3250 3250 3250
Dig. lysine, % 0.68 0.68 0.68 0.68 0.68
† K3,
μ
†† †††
Rev. Caatinga
Table 3. Performance of growing (30-60 kg) and finishing (60-90 kg) pigs, fed on diets with canola meal. Canola Meal levels (%)
Growing
Item 0 6 12 18 24 Media±EP† CV†† Lin††† Qua††††
DFI, kg 2.01 1.95 2.02 2.01 2.02 2.00±0.21 10.66 NS NS
DWG, kg 0.89 0.90 0.89 0.97 0.92 0.92±0.11 11.87 NS NS
Feed:gain 2.25 2.18 2.28 2.08 2.19 2.20±0.19 9.05 NS NS
NUP, mg/dl 14.04 14.91 15.35 13.87 16.15 14.84±3.87 26.45 NS NS
BT, mm 8.10 8.80 9.10 8.30 9.11 8.82±1.85 19.13 NS NS
LD, mm 42.20 45.80 45.50 45.90 44.56 45.46±5.19 10.10 NS NS
Finishing
DFI, kg 2.67 2.60 2.65 2.53 2.68 2.63±0.14 10.88 NS NS
DWG, kg 0.99 0.95 0.94 0.87 0.93 0.94±0.14 16.08 NS NS
Feed:gain 2.69 2.76 2.84 2.93 2.90 2.82±0.31 12.19 NS NS
NUP, mg/dl 13.96 13.72 13.96 12.18 12.82 13.33±2.71 12.34 NS NS
BT, mm 12.10 13.20 12.10 12.40 13.10 12.58±2.86 17.82 NS NS
LD, mm 44.40 46.40 46.40 47.40 48.50 46.62±9.59 13.82 NS NS
†Standard Error; ††CV = Coefficient of variation; †††Linear Effect of Levels Canola Meal;; †††† Quadratic Effect of Levels
Canola Meal; NS = non-significat; DFI = Daily feed intake; DWG = Daily weight gain; BT = Backfat thickness; LD = Loin
depht.
However, Moreira et al. (1996) worked with growing-finishing pigs and concluded that there was a reduction in the performance of the pigs according to increased CM levels in the diets. These authors linked this behaviour to the fact that CM contains high levels of crude fibre that can impair the performance. Thacker and Newkirk (2005) worked
with growing-finishing pigs (28.7 to 107.4 kg of live
weight) and observed that there was a reduction in daily weight gain and feed:gain ratio during the growing phase when they completely replaced soybean meal with CM as a protein source. In the finishing phase, total replacement did not affect daily feed intake, daily weight gain, and feed:gain ratio.
On the other hand, Roth-Maier et al. (2004) observed an improvement trend in the yield variables of growing animals with increased levels of CM inclusion (0-26%). However, there was a linear decrease in daily gain weight as the CM level
increased (0-17%). Gomes et al. (1998) observed
that it was possible to include 15% of CM in the diet of finishing pigs, whereas Brand et al. (2001) concluded that the inclusion of 24% for pigs with 25 to 84 kg live weight did not affect the performance. The experiment carried out by Zanotto et al. (2009) showed a detrimental effect on the feed:gain ratio during the growing phase and a limitation in the daily feed intake during the finishing phase when high levels of CD (replacement level above 40% of soybean meal) were included to replace soybean meal.
Results obtained by Seneviratne et al. (2010) were similar to those of the present study. They assessed pigs fed on diets containing a maximum of 23% CD during the growing phase and found no differences. However, these authors reported that,
when they increased the level of CM inclusion in finishing pigs, the daily weight gain decreased linearly and feed:gain ratio worsened. With regard to the quantitative carcass traits (Table 4), none of the variables was influenced by the addition of CD (p ≥0.05).
Dunnett's test indicated that there was no
difference (p ≥0.05) between the levels of CM
inclusion and the control diet (0% CM) for most variables. However, for the variables 'hot carcass weight' and 'cold carcass weight', the values were
lower (p ≤0.05) between inclusion levels of 12, 18,
and 24% for hot carcass weight and between 18 and 24% for cold carcass weight compared with the control diet. This result is due to the lower weight of these animals at sacrifice. However, special attention should be given to these variables. Losses during cooling represent an important value related to the percentage of carcass water loss in the refrigerator (BRIDI; SILVA, 2009). Therefore, these results indicate that up to 24% of CM inclusion in the diets does not affect the quantitative carcass traits in pigs.
The results obtained in the present study are similar to those obtained by Gomes et al. (1998), Roth-Maier et al. (2004), and Thacker and Newkirk (2005), which did not show any effect of the CM level replacing soybean meal on the carcass traits
assessed in growing-finishing pigs. Rojo et al. (2001)
reduction in backfat thickness, increase in the percentage of carcass meat, and reduction in the carcass performance.
In addition, Zanotto et al. (2009) reported that the inclusion of CM in the diet resulted in carcasses
with lower meat yield. With the exception of colour (a*), lightness (L*), and tonality (b*) of the longissimus muscle, none of the other qualitative meat traits (Table 5) were influenced by the
inclusion of CM (p ≥0.05).
Table 4. Effect of diets with different levels of canola meal inclusion (CM) on quantitative carcass traits of pigs in finishing (60 to 90 kg).
† Standard Error; ††CV = Coefficient of variation; § Linear Effect of Levels Canola Meal; ¶ Quadratic Effect of Levels
Canola Meal; NS = non-significant; * Significant (p ≤ 0.05) the Dunnett tests.
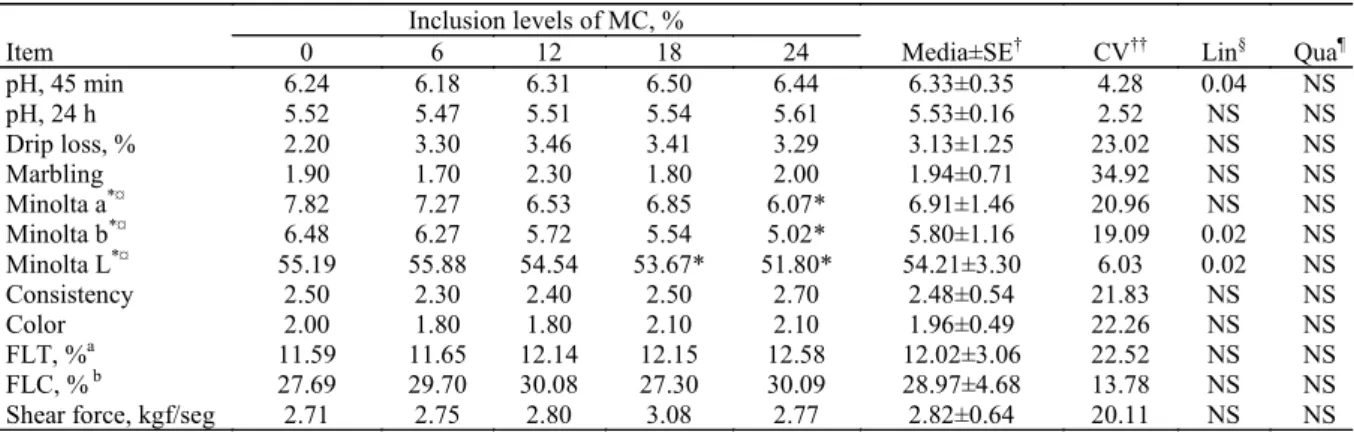
Table 5. Effect of diets with different levels of canola meal inclusion (CM) on qualitative traits of Longissimus dorsi muscle in pigs (60 to 90 kg).
†- Standard error; ††-CV = Coeficiente de variación; §- Linear Effect of Levels CM (Minolta b: Y=6.6145–0.0652583x;
Minolta L: Y=57.253–0.218756x); ¶- Quadratic Effect of Levels CM; aFLT =Fluid loss from thawing; bFLC = Fluid loss
from cooking; ¤- a*: indicates the color of the flesh varies from red to green (green red high color indicates red, low color
indicates green); b*: indicates the flesh color varying from yellow to blue (b* high indicates yellow color, b* low indicates
blue color); L*: indicates the degree of brightness of the flesh (L* = 0 dark meat, L = 100 white meat); NS = non-significant; *Significant (p ≤ 0.05) the Dunnett tests.
Inclusion levels of MC (%)
Variables 0 6 12 18 24 Mean±SE† CV†† Lin§ Qua¶
Fasting losses, % 3.98 3.66 4.06 4.08 4.02 3.96±1.37 29.46 NS NS
Hot carcass weight, kg 72.93 71.89 71.30* 69.47* 70.65* 71.25±3.23 1.48 NS NS
Hot carcass yield, % 81.81 82.47 82.20 81.80 82.27 82.11±1.57 1.51 NS NS
Cold carcass weight, kg 70.03 69.41 68.76 67.11* 68.21* 68.70±2.99 1.78 NS NS
Cold carcass yield, % 78.58 79.62 79.27 79.02 79.43 79.18±1.65 1.79 NS NS
Loss yield, % 3.94 3.45 3.56 3.39 3.45 3.56±1.08 29.15 NS NS
Loin depth, kg 32.23 30.51 31.36 31.43 31.29 31.36±1.74 5.40 NS NS
Ham weight, kg 11.18 10.59 10.78 10.55 10.67 10.75±0.76 5.37 NS NS
Backfat thickness, mm 11.80 13.10 11.60 12.80 12.40 12.34±3.20 22.14 NS NS
Carcass length, cm 89.08 89.60 87.34 89.99 87.79 88.76±3.83 3.85 NS NS
Longissimus area, cm2 38.75 39.83 37.95 37.75 38.70 38.60±4.28 11.13 NS NS
Fat area, cm2 21.50 22.15 19.70 20.09 20.18 20.72±5.34 21.74 NS NS
Lean meat in the carcass, kg 56.65 56.52 54.36 55.25 54.90 55.54±4.53 8.17 NS NS Lean meat in the carcass, % 77.76 78.60 76.51 79.52 77.71 78.02±6.23 7.98 NS NS
Lean:fat ratio 0.57 0.56 0.54 0.43 0.54 0.53±0.18 33.32 NS NS
Inclusion levels of MC, %
Item 0 6 12 18 24 Media±SE† CV†† Lin§ Qua¶
pH, 45 min 6.24 6.18 6.31 6.50 6.44 6.33±0.35 4.28 0.04 NS
pH, 24 h 5.52 5.47 5.51 5.54 5.61 5.53±0.16 2.52 NS NS
Drip loss, % 2.20 3.30 3.46 3.41 3.29 3.13±1.25 23.02 NS NS
Marbling 1.90 1.70 2.30 1.80 2.00 1.94±0.71 34.92 NS NS
Minolta a*¤ 7.82 7.27 6.53 6.85 6.07* 6.91±1.46 20.96 NS NS
Minolta b*¤ 6.48 6.27 5.72 5.54 5.02* 5.80±1.16 19.09 0.02 NS
Minolta L*¤ 55.19 55.88 54.54 53.67* 51.80* 54.21±3.30 6.03 0.02 NS
Consistency 2.50 2.30 2.40 2.50 2.70 2.48±0.54 21.83 NS NS
Color 2.00 1.80 1.80 2.10 2.10 1.96±0.49 22.26 NS NS
FLT, %a 11.59 11.65 12.14 12.15 12.58 12.02±3.06 22.52 NS NS
FLC, % b 27.69 29.70 30.08 27.30 30.09 28.97±4.68 13.78 NS NS
Shear force, kgf/seg 2.71 2.75 2.80 3.08 2.77 2.82±0.64 20.11 NS NS
There was a linear decrease (p≤0.05) in
lightness (L*) and tonality (b*) of the longissimus muscle as the CM level increased in the diet.
Dunnett's test indicated differences (p ≤0.05)
between the levels of CM inclusion and the control diet (0% CM) with respect to muscle colour.
With respect to lightness (L*), the inclusion
of 18 and 24% of CM exhibited difference (p ≤0.05)
with respect to 0% CM. For the variables saturation
(a*) and tonality (b*), the inclusion of 24% CM
showed differences (p ≤0.05) compared to 0%.
Dunnett's test did not show difference (p ≥0.05) in
the other qualitative muscle traits.
Rev. Caatinga
and rich in erucic acid. As a result, the possibilities of generating dark meat with CM would be less.
CONCLUSION
The addition of up to 24% CM did not interfere in the performance and quantitative and
qualitative carcass traits in growing-finishing pigs.
CM can be used as alternative protein source in the balancing of diets for pigs. However, it is important to conduct further studies to determine whether the
cost-benefit ratio is adequate.
REFERENCES
ABIPECS - Associação brasileira da indústria
produtora e exportadora de carne suína. Estatística
de produção. Disponível em: <http:// www.abipecs.org.br/news/263/135/Produtores-de-suinos-apostam-no-mercado interno-em-2011.html. Acesso em: 26 jul. 2011.
BELL, J. M. Nutrients and toxicants in rapeseed
meal: A review. Journal of Animal Science,
Madison, v. 58, n. 4, p. 996-1010, 1984.
BELL, J. M. Factors affecting the nutritional value
of canola meal: a review. Canadian Journal of
Animal Science, Saskatoon, v. 73, n .4, p. 326-333, 1993.
BELL, J. M.; KEITH, M. O.; HUTCHESON, D. S. Nutritional evaluation of very low glucosinolate
canola meal. Canadian Journal of Animal Science,
Saskatoon, v. 71, n. 2, p. 497-506, 1991.
BRAND, T. S.; BRANDT, D. A.; CRUYWAGEN, C. W. Utilisation of growing-finishing pig diets containing high levels of solvent or expeller oil
extracted canola meal. New Zealand Journal of
Agricultural Research, Lahore, v. 44, n. 1, p. 31 -35. 2001.
BRIDI, A. M.; SILVA. C. A. Avaliação da Carne
Suína., 2. ed. Londrina, PR: Midigraft, 2009. 120 p.
Canola Council of Canada. Canola Meal Feed
Industry Guide. 4. ed. Manitoba,Winnipeg: Canada
Canola Counc, 2009. 48 p.
CAI, Y.; ZIMMERMAN, D. R.; EWAN, R. C. Diurnal variation in concentrations of plasma urea nitrogen and amino acids in pigs given free access to
feed or fed twice daily. Journal of Nutrition, Ames,
v. 124, n. 7, p. 1088-1093, 1994.
COMA, J.; CARRION, D.; ZIMMERMAN, D. R.
Use of plasma urea nitrogen as a rapid response criterion to determine the lysine requirement of pigs. Journal of Animal Science, Champaign, v. 73, n. 2,
p. 472-481, 1995.
CROMWELL, G. L. Feeding swine. In: KELLEMS,
R. O.; CHURCH, D. C. Livestock Feeds and
Feeding. Prentice- Hall, 6. ed. Englewood Cliffs,
NJ: Prentice Hall, Inc. 2010, p. 244-284
GOMES, P. C. et al. Uso do farelo de canola para
suínos na fase de terminação. Revista Brasileira de
Zootecnia, Viçosa, v. 27, n. 4, p. 749-753, 1998.
HERTZMANN, C. L.; GORANSSON, R. H. Influence of fishmeal, rapeseed and rapeseed meal in the feed on the fatty acid composition and storage
stability of porcine adipose tissue. Meat Science,
Illinois, v. 23, n. 1, p. 53-64, 1988.
KEITH, M. O.; BELL, J. M. Composition and digestibility of canola press cake as a feedstuff for
use in swine diets. Canadian Journal of Animal
Science, Saskatoon, v. 71, n. 3, p. 879-885, 1991.
MOREIRA, I. et al. Utilização do farelo de canola na
alimentação de suínos na fase total de crescimento e
terminação (61 a 141 dias). Revista Brasileira de
Zootecnia, Viçosa, v. 25, n. 4, p. 697-712, 1996.
MOREIRA, I. et al. Determinação dos coeficientes de digestibilidade, valores energéticos e índices de controle de qualidade do milho e da soja integral
processados pelo calor. Revista Brasileira de
Zootecnia, Viçosa, v. 23, n. 4, p. 916-929, 1994.
NARENDRAN, R. et al. Effect of diferent levels of tower rapessead meal in corn – soybean meal based
diets on growing - finishing pig performance.
Canadian Journal of Animal Science, Saskatoon,
v. 61, n. 1, p. 213-216, 1981.
NATIONAL RESEARCH COUNCIL - NRC.
Nutrient Requirements of Swine. 10 ed. Washington, DC. 1998.
ROJO, G. A. et al. Canola meal as a protein
supplement in diets for finishing pigs. Revista
Mexicana de Ciencias Pecuarias, Tulancingo, v. 39, n. 2, p. 179-192, 2001.
ROSTAGNO, H. S. et al. Tabelas brasileiras para
aves e suínos: composição de alimentos e exigências nutricionais. 2. ed. Viçosa, MG: UFV, 2005. 186 p.
ROSTAGNO, H. S. et al. Tabelas brasileiras para
ROTH-MAIER, D. A.; BÖHMER, B. M.; ROTH, F. X. Effects of feeding canola meal and sweet lupin
(L. luteus, L. angustifolius) in amino acid balanced
diets on growth performance and carcass
characteristics of growing-finishing pigs. Animal
Research, Munich, v. 54, n.1, p. 21-34, 2004.
SAKOMURA, N. K.; ROSTAGNO, H. S. Métodos
de pesquisa em nutrição de monogástricos. Jaboticabal: Funep. 2007. 283 p.
SAMPAIO, I.B.M. Estatística aplicada à
experimentação animal. Fundação de Ensino e Pesquisa em Medicina Veterinária e Zootecnia, Belo Horizonte, MG: UFMG, 1998. 221 p.
SANTOS, A. C.; BASSO, L. C. Composição química e qualidade nutricional do concentrado
protéico de colza. Arquivos de Biologia e
Tecnologia, Curitiba, v. 33, n. 4, p. 879-893, 1990.
SENEVIRATNE, R. W. et al. The nutritional value of expeller-pressed canola meal for grower-finisher
pigs. Journal Animal Science, Champaign, v. 88, n.
6, p. 2073-2083, 2010.
SILVA, D. J.; QUEIROZ, A. C. Análise de
alimentos - métodos químicos e biológicos. 3. ed. Viçosa, MG: UFV, 2002. 235 p.
SMITHARD, R. Full fat rapeseed for pig and
poultry diets. Feed Compounder, Whitland, v., n. 1,
p. 35-38,1993.
SPRAGG, J. C.; MAILER, R. J. Canola Meal
Value Chain Quality Improvement. Berwick, Victoria: AOF and Pork CRC 2007. 31 p.
TESKEREDZIC, Z. et al. Assessment of undephytinized and dephytinized rapeseed protein concentrate as souces of dietary protein for juvenile
rainbow trout (Oncorhynchus mykiss). Aquaculture,
Amsterdan, v. 132, n. 2, p. 261-277, 1995.
THACKER, P. A.; NEWKIRK, R. W. Performance
of growing-finishing pigs fed barley-based diets
containing toasted or non-toasted canola meal. Canadian Journal of Animal Science, Saskatoon, v. 85, n. 1, p. 53-59, 2005.
ZANOTTO, D. et al. Utilização do farelo de canola na alimentação de suínos em crescimento e
terminação. Archivos de Zootecnia, Córdoba, v. 58,