www.ccarevista.ufc.br ISSN 1806-6690
Biological soil attributes in oilseed crops irrigated with oilfield
produced water in the semi-arid region
1Atributos biológicos do solo cultivado com oleaginosas irrigadas com água produzida
do petróleo em região semiárida
Ana Clarice Melo Azevedo de Meneses2*, Olmar Baller Weber3, Lindbergue Araujo Crisóstomo3 and Denis
Juvenço Andrade2
ABSTRACT - Wastewater from oil is the main residue of the oil industry. Studies have shown that wastewater, or produced
water, can be treated and used as an alternative source for the irrigation of oilseed crops. The aim of this work was to evaluate the effect of treated produced water on the biological properties of soil cultivated with the castor bean cv. BRS Energy and the sunflower cv. BRS 321 respectively, for two and three successive cycles of grain production. The first cycle in the sunflower and castor bean corresponds to the dry season and the second cycle to the rainy season. The third crop cycle in the sunflower relates to the dry season. The research was carried out from August 2012 to October 2013, in the town of Aracati, in the State of Ceará (Brazil), where both crops were submitted to irrigation with filtered produced water (FPW), produced water treated by reverse osmosis (OPW), or groundwater water from the Açu aquifer (ACW), and to no irrigation (RFD). The treatments, with three replications, were evaluated during the periods of pre-cultivation and plant reproduction for soil respiration (Rs), total organic carbon (TOC) and the population density of bacteria (Bact) and filamentous fungi (Fung) in the soil. In the sunflower crop, these soil attributes are sensitive to the irrigation water used. Irrigation of the castor bean affects soil respiration. Under the conditions of this study, irrigation with FPW may be a short-term alternative in the castor bean and sunflower crops.
Key words: Wastewater from the oil industry. Microbiological properties of the soil. Soil basal respiration.
RESUMO -A água residual do petróleo é o principal resíduo na indústria petrolífera. Estudos indicaram que água residuária ou água produzida pode ser tratada e usada como fonte alternativa na irrigação de culturas de oleaginosas. Este trabalho objetivou avaliar o efeito da água produzida tratada sobre atributos biológicos do solo cultivado com mamona cv. BRS Energia, e girassol cv. BRS 321, respectivamente, por dois e três ciclos sucessivos de produção de grãos. O primeiro ciclo de girassol e mamona corresponde à época seca e o segundo, à época chuvosa. O terceiro ciclo de cultivo de girassol se refere à época seca. A pesquisa foi conduzida durante o período de agosto de 2012 a outubro de 2013, no município de Aracati, Ceará (Brasil), onde ambas as culturas foram submetidas à irrigação com água produzida filtrada (APF), água produzida tratada por osmose reversa (APO), água do aquífero Açu (ACA) e sem irrigação (SEQ). Os tratamentos com três repetições foram avaliados em períodos de pré-cultivo, de reprodução das plantas, pela respiração edáfica (Re), carbono orgânico total (COT) e densidade populacional de bactérias (Bact) e fungos filamentosos (Fung) do solo. Esses atributos do solo são sensíveis às águas de irrigação usadas na cultura do girassol. A irrigação das mamoneiras afeta a respiração edáfica. Para as condições deste estudo, a irrigação com APF pode ser alternativa de curto prazo nas culturas de mamona e girassol.
Palavras-chave: Água residuária da indústria petrolífera. Atributos microbiológicos do solo. Respiração basal do solo.
DOI: 10.5935/1806-6690.20170027 *Autor para correspondência
Recebido para publicação em 24/02/2015; aprovado em 11/08/2016
1Parte da Dissertação de Mestrado da primeira autora apresentada ao Mestrado Acadêmico em Recursos Naturais da Universidade Estadual do
Ceará/UECE
2Departamento de Ciência do Solo, Universidade Estadual do Ceará, Avenida Dr. Silas Muguba, 1700, Campus do Itaperi, Fortaleza-CE, Brasil,
60.740-000, ana16clarice@hotmail.com, denisandradej@hotmail.com
3Embrapa Agroindústria Tropical, Rua, Doutora Sara Mesquita, 2270, Pici, Fortaleza-CE, Brasil, 60.511-110, olmar.weber@embrapa.br,
INTRODUCTION
The oil industry generates various waste products; one of the most important among these is wastewater
from the exploitation of oil and gas (MOTTA et al.,
2013). Water that is trapped in cracks in the rock and in subterranean holes together with the fossil fuels (AMINI
et al., 2012), when extracted from the wells and separated
from the oil at the industrial plant, is known as produced water (PW). This represents the greatest fraction of the liquid extracted from the rock, and can exceed 90% of the
volume of oil obtained by the oil industry (MELOet al.,
2010). Considering this proportion of oil to PW, the Fazenda
Belém alone obtained more than 640,000 m3 of this water in
2014. The Fazenda Belém is inserted in the Potiguar basin, in the northeast of Brazil, where there are several fields that
generate more than 30 million m3 of PW annually (ANP,
2015). The significant volume of PW justifies its being treated for the water to be reused.
Treatment of PW by nanofiltration (MOTTAet al.,
2013), and treatment by reverse osmosis (MELOet al.,
2010), have both been proposed for use in in irrigated agrosystems. The appropriate treatment of PW offers opportunities for the irrigated production of such oilseeds
as the sunflower (Helianthus annuus L.) (SOUSAet al.,
2016) and castor bean (Ricinus communis L.), whose
products can be used to produce biodiesel. However, PW is usually rich in salts, which might compromise soil fertility. To maintain the quality of the soil, monitoring of the total organic carbon has been recommended (SILVA
et al., 2012), together with soil respiration (SANTOS et al., 2011) and microorganisms (LOPESet al., 2014),
as these indicators have a sensitive response to the management practices of the cropping system.
The impact of PW on the biological activity of
the soil is little known. Lopeset al. (2014) evaluated the
biological and biochemical attributes of soil irrigated with PW during one production cycle of the sunflower and castor bean. Those authors noted changes in the proliferation of microorganisms and in nitrogenase activity after irrigation with wastewater from oil. Ferreira, Weber and Crisóstomo (2015) also noted changes in the structure of the soil mesofauna during two production cycles of the same crops irrigated with produced water. It is known that poor quality water affects the way the soil functions, leading to the suggestion that the biological parameters of an agrosystem irrigated with PW should be monitored.
The aim of this study was to evaluate the effect of PW on the biological attributes of the rhizosphere of the sunflower cv. BRS 321 during three production cycles, and of the castor bean cv. BRS Energy for two two successive crop production cycles. Furthermore, the study aims to propose the use of biological quality indicators of the
irrigated soil, including soil respiration (Rs), total organic carbon (TOC), and the population density of cultivable bacteria (Bact) and of cultivable filamentous fungi in the soil (Fung).
MATERIAL AND METHODS
Study of the sunflower cv. BRS 321 and castor bean cv. BRS Energy was carried out (2011 to 2013) in an area of an orthic Quartzarenic Neossol in the town of Aracati, at 4º44’45.6” S and 37º32’18.4” W. Based on
the soil characteristics (SOUSA et al ., 2016) and the
rainfall observed during the study (450 mm), which was concentrated from March to May (FERREIRA; WEBER; CRISÓSTOMO, 2015), a drip irrigation system was set up. Both the sunflower and castor bean crops were irrigated with filtered produced water (FPW), produced water treated by reverse osmosis (OPW) and groundwater water from the Açu aquifer (ACW) captured in wells at the Fazenda Belém (250 m deep), as well as one rainfed
treatment (RFD), with three replications of 200 m2for
each treatment. The irrigation water was characterised by
Sousaet al. (2016).
In preparing the areas, conservation practices with the minimum of soil movement were adopted. Basic
fertilisation consisted of the application of 75 Mg ha-1
for the first cycle and 25 Mg ha-1 for the second and third
cycles. During cultivation of the crops under evaluation, the castor bean plants also received one supplementary
fertilisation with urea (20 kg ha-1 N applied as base and
30 kg ha-1 N as topdressing), single superphosphate (80
kg ha-1 P
2O5 applied as base) and potassium chloride
(25 kg ha-1 K
2O applied as base). The sunflower plants
received urea (50 kg ha-1 N applied as topdressing), single
superphosphate (80 kg ha-1 P
2O5 applied as base) and
potassium chloride (40 kg ha-1 K
2O applied as base). The
doses of fertiliser for the sunflower and castor bean were
based on suggestions made in Raijet al. (1996) and Dinis
Netoet al. (2009), respectively.
Immediately prior to fertilisation and planting, and in the final stages of each oilseed, composite soil samples were collected from twelve experimental units for each crop. The soil was taken from the surface layer (up to 10 cm deep), always from areas close to the plants, along the eighteen central rows of each working plot (out of 20 rows). After collection, the soil samples were passed through a 2-mm mesh sieve for the removal of fragments of organic matter and roots, placed in labelled plastic bags and kept in a refrigerator at a temperature of approximately 5 °C until subjected to laboratory analysis.
field capacity, and incubated for up to 240 hours at room
temperature (22 ± 5 °C); in calculating the C-CO2
evolved from the soil, the procedures of Silva, Azevedo and De-Polli (2007) were followed. The TOC (total organic carbon) was measured using the method of wet oxidation, based on oxidation of the soil carbon by potassium dichromate in a heated acid medium, followed by titration with ferrous ammonium sulphate (SILVA, 2009). The populations of cultivable soil microorganisms were determined by the method of seeding onto solid media in Petri dishes; colony forming units (CFU) of the filamentous fungi were quantified in a Martin solid medium, and of the bacteria in a nutrient agar medium, as per APHA (2005).
The data were analysed separately for each crop, using a completely randomised design, with four main treatments (FPW, OPW, ACW and RFD) and the different periods of soil sampling. Those times corresponded to the periods of pre-cultivation and harvesting of the capitula in the first, second and third production cycles of the sunflower, and to the periods of pre-cultivation and harvesting of primary inflorescences in the first and second production cycles of the castor bean. In both experiments, those periods comprised measurements repeated over time;
the MIXED procedure of the SAS® statistical software
version 9.2 (ALISSON, 2010) was therefore adopted in the analysis. The populations of microorganisms were transformed in log(x) for normalisation. When noting a normal data distribution (FREITAS; FERREIRA; MOREIRA, 2011), the effects of the irrigation treatments and sampling times were evaluated, together with the interaction of these factors. Finally, nominal significances between treatments were estimated for the variables Rs, TOC, Bact and Fung in both oilseed crops.
RESULTS AND DISCUSSION
Values for evolved C-CO2 from the soil samples
tended to a gradual increase over the periods and cycles for both oilseed crops. Higher values were detected during Period 3 (May and June 2013) and Period 4 (October 2013) in the rhizosphere of the sunflower rows (Table 1), and during Period 3 (July 2013) in the rhizosphere of the castor bean (Table 2). This result was expected after the application of fertiliser and the irrigated cultivation of the oilseeds.
Organic and mineral fertilisers favour metabolic activity of the microbiota in a process of soil carbon mineralisation. The accumulation of organic matter in the soil generates more biological activity, with the consequent
release of C-CO2 (SILVAet al., 2012). Crop fertilisation
also benefits growth of the microorganism communities
in the rhizosphere by increasing the availability of nutrients and/or sources of labile carbon (MOREIRA; SIQUEIRA, 2006). The researchers Qiu, Huang and Lin (2014) investigated the effects of fertiliser application on communities of bacteria and fungi in an area cultivated
with medicinal plants (Camellia sinensis [L.] Kuntze).
They found high levels of soil nutrients, including organic matter (30.03%), as a function of the application of organic fertiliser, with an increase in the diversity of the soil bacterial communities, as well as significant changes in the structure of the soil fungal communities. Furthermore,
Bonilla et al. (2012) investigated the effects of organic
additives and soil management on the population-size of microorganisms in soil cultivated with avocado trees (Persea americana Mill.), and reported an increase in the
population of certain microbial groups in the soil, due to the addition of fertiliser.
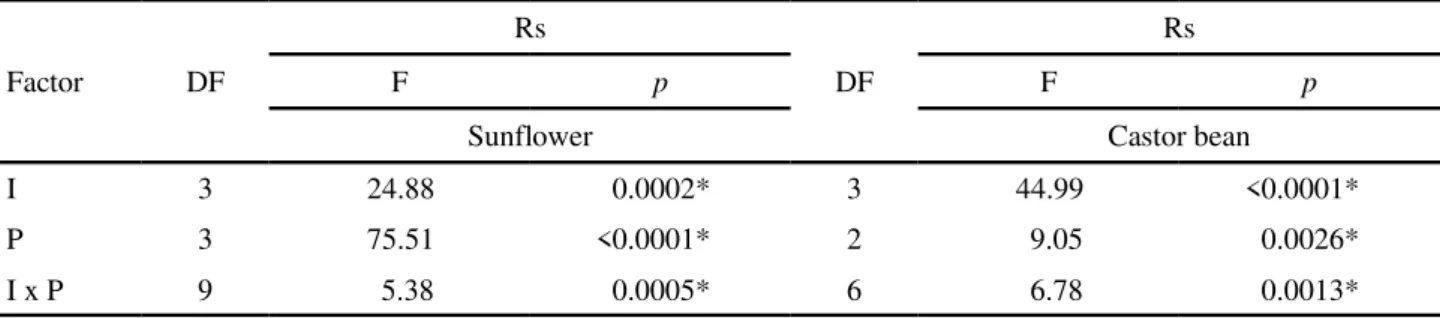
In the present work, a significant effect was seen on Rs from the irrigation treatments, the periods representing the cycles, and the interaction of these factors in the two oilseed crops (Table 3). The respiration resulting from the overall activity of the microbiota in soil cultivated with the sunflower plants (Table 4) revealed differences between treatments that received PW (FPW and OPW) and the
control with no irrigation (p<0.0001) during periods 2
and 4 (pre-harvest period of the first and third cycles); the highest value for Rs however, was detected in non-irrigated experimental plots.
There was little change in the organic fertiliser from soil moisture (<5%) under rainfed conditions due to the low rainfall intensity in the area (FERREIRA; WEBER; CRISÓSTOMO, 2015). It is worth noting that oilseed production was only seen during the second cycle (April to July 2013), when a total of 448 mm of rain was registered. With the soil samples moistened during incubation and analysis in the laboratory, the labile fractions of organic compounds may have stimulated microbial activity and
the consequent evolution of soil C-CO2. The effect of soil
moisture on soil respiration in the field has been reported by Geisseler, Horwath and Scow (2011) in California. Those authors found a positive correlation between soil
respiration and soil moisture (p<0.001), i.e. respiration
decreased with a reduction in water potential. Similar
behaviour was reported by Araujo et al. (2008), who
evaluated microbial activity through the production of
C-CO2 during the dry and rainy seasons in the semi-arid
region of the State of Paraíba.
Pascualet al. (2007) evaluated the potential impact
1Filtered produced water (FPW) and water treated by reverse osmosis (OPW), water captured from the Açu aquifer (ACW) and the control with no
irrigation (RFD);2P1 (pre-planting); P2 (cycle 1 pre-harvest); P3 (cycle 2 pre-harvest); P4 (cycle 3 pre-harvest)
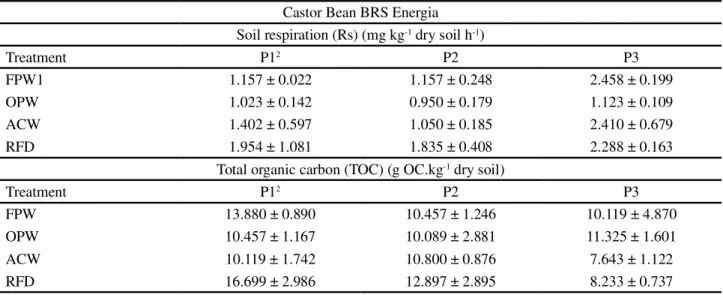
Castor Bean BRS Energia
Soil respiration (Rs) (mg kg-1 dry soil h-1)
Treatment P12 P2 P3
FPW1 1.157 ± 0.022 1.157 ± 0.248 2.458 ± 0.199
OPW 1.023 ± 0.142 0.950 ± 0.179 1.123 ± 0.109
ACW 1.402 ± 0.597 1.050 ± 0.185 2.410 ± 0.679
RFD 1.954 ± 1.081 1.835 ± 0.408 2.288 ± 0.163
Total organic carbon (TOC) (g OC.kg-1 dry soil)
Treatment P12 P2 P3
FPW 13.880 ± 0.890 10.457 ± 1.246 10.119 ± 4.870
OPW 10.457 ± 1.167 10.089 ± 2.881 11.325 ± 1.601
ACW 10.119 ± 1.742 10.800 ± 0.876 7.643 ± 1.122
RFD 16.699 ± 2.986 12.897 ± 2.895 8.233 ± 0.737
Table 2 - Mean values and standard deviations for respiration activity, organic carbon, and populations of cultivable microorganisms
in the rhizosphere of castor bean plants cv. BRS Energy, for irrigation treatment and time of soil sampling
Table 1 - Mean values and standard deviations for respiration activity, organic carbon, and populations of cultivable microorganisms in the rhizosphere of sunflower plants cv. BRS 321, for irrigation treatment and time of soil sampling
Girassol BRS 321
Soil respiration (Rs) (mg kg-1 dry soil h-1)
Treatment P12 P2 P3 P4
FPW1 1.188 ± 0.275 1.052 ± 0.704 2.103 ± 0.208 2.336 ± 0.235
OPW 1.338 ± 0.169 1.606 ± 0.666 2.597 ± 0.211 2.373 ± 0.309
ACW 1.098 ± 0.184 1.138 ± 0.012 2.634 ± 0.199 2.191 ± 0.068
RFD 1.218 ± 0.127 2.448 ± 0.152 2.922 ± 0.402 3.240 ± 0.152
Total organic carbon (TOC) (g OC.kg-1 dry soil)
Treatment P12 P2 P3 P4
FPW 12.848 ± 1.260 9.311 ± 0.507 11.056 ± 4.507 5.211 ± 0.555
OPW 12.541 ± 1.884 7.802 ± 1.621 14.216 ± 4.097 10.069 ± 3.999
ACW 13.098 ± 3.826 7.817 ± 0.847 14.245 ± 3.596 5.860 ± 1.375
RFD 15.760 ± 2.563 15.317 ± 5.369 7.695 ± 1.810 7.459 ± 2.006
Population density of cultivable bacteria (log CFUg-1 dry soil)
Treatment P13 P2 P3 P4
FPW 5.726 ± 0.245 6.060 ± 0.505 5.221 ± 0.267
-OPW 5.816 ± 0.150 6.646 ± 0.073 5.600 ± 0.253
-ACW 5.658 ± 0.150 6.588 ± 0.297 5.876 ± 0.221
-RFD 5.941 ± 0.139 5.813 ± 0.107 5.520 ± 0.412
-Population density of cultivable filamentous fungi (log CFU g-1 dry soil)
Treatment P13 P2 P3 P4
FPW 3.638 ± 0.174 3.610 ± 0.100 2.988 ± 0.080
-OPW 3.607 ± 0.083 3.645 ± 0.020 2.781 ± 0.677
-ACW 3.825 ± 0.278 3.664 ± 0.141 3.017 ± 0.195
-Continuation Table 2
1Filtered produced water (FPW) and water treated by reverse osmosis (OPW), water captured from the Açu aquifer (ACW) and the control with no
irrigation (RFD);2P1 (pre-planting); P2 (cycle 1 pre-harvest); P3 (cycle 2 pre-harvest)
Table 3 -p-values associated with the F-test for soil respiration (Rs) in the rhizosphere of sunflower and castor bean plants, for
irrigation factor (I) and period of soil sampling (P)
*Significant by t-test at less than 5% probability
Factor DF
Rs
DF
Rs
F p F p
Sunflower Castor bean
I 3 24.88 0.0002* 3 44.99 <0.0001*
P 3 75.51 <0.0001* 2 9.05 0.0026*
I x P 9 5.38 0.0005* 6 6.78 0.0013*
Table 4 - Difference estimation (D) andp-values associated with the t-test between mean values for soil respiration (Rs) in the
rhizosphere of sunflower plants during the first, second and third production cycle, for irrigation treatment and period of soil sampling
1Filtered produced water (FPW) and water treated by reverse osmosis (OPW), water captured from the Açu aquifer (ACW) and the control with no
irrigation (RFD);2P1 (pre-planting); P2 (cycle 1 pre-harvest); P3 (cycle 2 pre-harvest) * Significant by t-test at less than 5% probability
Treatment
Contrast P1
2 P2 P3 P4
D p D p D p D p
FPW1 x OPW -0.1830 0.5807 -0.5543 0.1028 -0.4940 0.8765 -0.0363 0.9124
FPW x ACW 0.0903 0.7206 -0.0863 0.7325 -0.5317 0.1314 0.1453 0.5658
OPW x ACW 0.2733 0.2657 0.4680 0.0628 -0.0376 0.0125* 0.1817 0.4562
PW x ACW 0.1818 0.3284 0.1908 0.3055 -0.2847 0.9124 0.1635 0.3786
PW x RFD 0.0012 0.9945 -1.1828 <0.0001* -0.4774 0.5658 -0.9397 <0.0001*
Contrast FPW OPW ACW RFD
D p D p D p D p
E1 x E4 -1.1480 0.0012* -1.0013 0.0002* -1.0930 <0.0001* -2.0217 <0.0001*
Population density of cultivable bacteria (log CFUg-1 dry soil)
Treatment P13 P2 P3
FPW 5.910 ± 0.178 6.660 ± 0.051 5.441 ± 0.180
OPW 5.693 ± 0.081 6.232 ± 0.181 5.421 ± 1.267
ACW 5.670 ± 0.121 6.660 ± 0.044 5.587 ± 0.188
RFD 5.747 ± 0.500 5.873 ± 0.233 5.207 ± 0.191
Population density of cultivable filamentous fungi (log CFUg-1 dry soil)
Treatment P13 P2 P3
FPW 3.767 ± 0.097 3.837 ± 0.252 2.733 ± 0.364
OPW 3.717 ± 0.114 3.641 ± 0.067 3.119 ± 0.092
ACW 3.657 ± 0.050 3.667 ± 0.058 2.855 ± 0.352
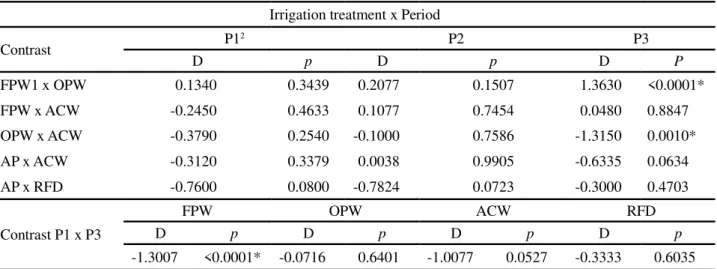
Table 5 - Difference estimation (D) andp-values associated with the t-test between mean values for Rs in the rhizosphere of castor bean
plants during the first and second production cycles, for irrigation treatment and period of soil sampling
1Filtered produced water (FPW) and water treated by reverse osmosis (OPW), water captured from the Açu aquifer (ACW) and the control with no
irrigation (RFD);2P1 (pre-planting); P2 (cycle 1 pre-harvest); P3 (cycle 2 pre-harvest), *Significant by t-test at less than 5% probability
Irrigation treatment x Period
Contrast P1
2 P2 P3
D p D p D P
FPW1 x OPW 0.1340 0.3439 0.2077 0.1507 1.3630 <0.0001*
FPW x ACW -0.2450 0.4633 0.1077 0.7454 0.0480 0.8847
OPW x ACW -0.3790 0.2540 -0.1000 0.7586 -1.3150 0.0010*
AP x ACW -0.3120 0.3379 0.0038 0.9905 -0.6335 0.0634
AP x RFD -0.7600 0.0800 -0.7824 0.0723 -0.3000 0.4703
Contrast P1 x P3
FPW OPW ACW RFD
D p D p D p D p
-1.3007 <0.0001* -0.0716 0.6401 -1.0077 0.0527 -0.3333 0.6035
differently in soil that received organic or mineral fertiliser. In the soil with sewage sludge, soil respiration was lower when compared to that of the soil that received the application of mineral fertiliser. This result was attributed to the persistence of inactive organisms. The greater value for soil respiration with the application of mineral fertiliser was attributed to an increase in energy consumption due to the stress conditions.
In the castor bean crop (Table 5), the data for soil respiration revealed differences at the end of the second cycle (P3) between the treatments with FPW and OPW
(p<0.0001) and those with OPW and ACW (p= 0.0010).
As noted above, during this production cycle of the sunflower crop (Table 4), the lowest respiration occurred in soil that received OPW.
Soil respiration activity may have been inhibited due to the presence of the biocide glutaraldehyde, a product added to the water during the process of reverse osmosis to avoid the formation of bacterial film on filter
membranes used at the industrial plant. Pereiraet al. (2014)
investigated the toxicity of glutaraldehyde at different organisation levels of aquatic organisms. Those authors observed a moderate toxic effect on different groups of organisms regardless of trophic level, with toxicity values
that ranged from 3.6 mg/L (24 h EC50 T. platyurus) to
31.3 mg L-1 (72h EC
50 C. vulgaris). Moreover, Ferreira
et al. (2015) found a reduction in the reproduction rate
ofFalsonia candida in soil irrigated with glutaraldehyde
(44.4 mg L-1). It is important to note that faunal organisms,
mainly mesofauna, feed on cellular structures and microorganisms, and could have their activities inhibited by glutaraldehyde.
During the crop cycles of the castor bean (Table 6), a reduction was also seen in the respiration activity of the soil irrigated with FPW for the pre-cultivation period and
the second cycle (p<0.0001), these periods coinciding with
the dry season and rainy season in the region.
The effect of the period of soil sampling on soil
respiration was also seen by Diniz et al. (2014) when
evaluating changes in microbiological attributes, including soil respiration, due to seasonal variation, in a forest area
of native macauba palm trees (Acrocomia aculeata) in
the Brazilian Cerrado. Those authors demonstrated that soil respiration was sensitive to seasonal variation, being higher during the rainy season.
The TOC content of soil cultivated with sunflower (Table 1) and castor bean (Table 2) demonstrated a certain trend towards a reduction in the values of this attribute of soil quality; that reduction is related to the mineralisation of organic fertiliser and the consequent availability of nutrients in the soil throughout the oilseed crop cycle. In the sunflower crop, the interaction of the factors irrigation and period significantly affected the organic carbon content of the soil (Table 6), with the most significant differences occurring between irrigated plots and those under rainfed conditions.
For the sunflower crop (Table 7), significant differences were detected in the TOC content of the soil that received PW (OPW and FPW) and the rainfed
treatment during period 2 (p= 0.0027) and Period 3 (p
= 0.0154); differences between the other contrasts were not considered. In soil irrigated with FPW, differences
Table 6 -p-values associated with the F-test for total organic carbon (TOC) in the rhizosphere of sunflower and castor bean plants, for irrigation factor (I) and period of soil sampling (P)
*Significant by t-test at less than 5% probability
Factor DF
TOC
DF
TOC
F p F p
Sunflower Castor bean
I 3 1.01 0.4375 3 1.97 0.1978
P 3 13.86 <0.0001* 2 17.19 0.0001*
I x P 9 3.46 0.0072* 6 1.71 0.1872
Irrigation treatment x Period
Contrast P1
2 P2 P3 P4
D p D p D p D p
FPW1 x OPW 0.3063 0.8934 1.5087 0.5112 -3.1600 0.1753 -4.8577 0.0421*
FPW x ACW -0.2507 0.9057 1.4940 0.4825 -3.1887 0.1410 -0.6490 0.7593
OPW x ACW -0.5570 0.8185 -0.0146 0.9952 -0.0286 0.9906 4.2087 0.0923
AP x ACW -0.4038 0.8375 0.7397 0.7075 -1.6087 0.4170 1.7798 0.3700
AP x RFD -2.9312 0.1754 -7.0066 0.0027* 5.4772 0.0154* -0.4118 0.8461
Contrast FPW OPW ACW RFD
D p D p D p D p
P1 x P4 70.6363 0.0004* 2.4723 0.1348 7.2380 0.0012* 8.3017 0.0056*
Table 7 - Difference estimation (D) andp-values associated with the t-test between mean values for TOC in the rhizosphere of oilseed
sunflower plants during the first, second and third production cycle, for irrigation treatment and period of soil sampling
1Filtered produced water (FPW) and water treated by reverse osmosis (OPW), water captured from the Açu aquifer (ACW) and the control with no irrigation (RFD); 2P1 (cycle 1 pre-planting); P2 (cycle 1 pre-harvest); P3 (cycle 2 pre-harvest) and P4 (cycle 3 pre-harvest); *Significant by t-test at less than 5% probability
0.0004). Differences between periods were also detected in lots that received ACW and those that were not irrigated, suggesting that the period of the year and the sunflower cycle affect the soil carbon content.
In the castor bean crop a significant effect for sampling period was only detected with TOC content (Table 8), with significant differences in this
variable detected between periods 1 and 3 (p<0.0001).
Furthermore, Diniz et al. (2014), when evaluating
variations in the organic carbon content of the soil in a forest of macauba palm trees, noted seasonal variations, with values for organic carbon content higher during the period of greatest rainfall.
The increases in TOC contents between periods 1 and 3 may be due to applied fertilisers and the cycling of the cultural remains of the castor bean. This is consistent
with the data obtained by Silva et al. (2012), who
evaluated the TOC content of agricultural land and pasture in the ‘Paraíba do Sul’ valley (state of Rio de Janeiro), during the wet and dry seasons. The authors found higher
levels of soil carbon in areas of forest and pasture, and associated them with the greater amount of crop residue produced by the various species, as well as the cycling of soil nutrients.
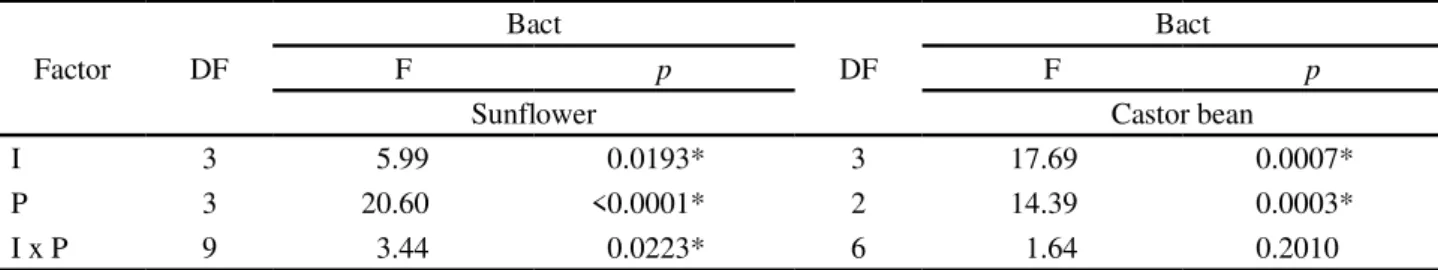
The Bact populations in the soil cultivated with sunflower and castor bean were influenced by irrigation treatment and sampling periods (Table 9), represented by the oilseed production cycles. The interaction of these factors was significant for Bact populations in the soil cultivated with sunflower; in the castor bean, only the effects of isolated factors were detected.
From Tables 1 and 2 it can be seen that in general the Bact populations was higher in the second crop cycle, coinciding with with rainy periods in the region (FERREIRA; WEBER; CRISÓSTOMO, 2015), and during vegetative growth, as a result of the ground cover.
Lopeset al. (2014), studying the effect of produced water
Table 8 - Difference estimation (D) andp-values associated with the t-test between mean values for TOC in the rhizosphere of castor bean plants during the first and second production cycles, for irrigation treatment and period of soil sampling
1Filtered produced water (FPW) and water treated by reverse osmosis (OPW), water captured from the Açu aquifer (ACW) and the control with no
irrigation (RFD);2P1 (cycle 1 pre-planting); P2 (cycle 1 pre-harvest); P3 (cycle 2 pre-harvest); *Significant by t-test at less than 5% probability
Contrast Period Contrast Irrigation treatment
D p D p
FPW1 x OPW -0.3051 0.7913
P12 x P3 5.4815 <0.0001*
FPW x ACW 0.6246 0.6200
OPW x ACW 0.9297 0.2341
AP x ACW 0.7771 0.3747
AP x RFD -1.2310 0.0750
Factor DF
Bact
DF
Bact
F p F p
Sunflower Castor bean
I 3 5.99 0.0193* 3 17.69 0.0007*
P 3 20.60 <0.0001* 2 14.39 0.0003*
I x P 9 3.44 0.0223* 6 1.64 0.2010
Table 9 -p-values associated with the F-test for the population density of cultivable bacteria (Bact) in soil of the sunflower and castor
bean, for irrigation factor (I) and period of soil sampling (P)
*Significant by t-test at less than 5% probability
bean cv. Energy BRS. The positive influence of the roots on the activity of microorganisms was also reported
by Santos et al. (2011) when studying the effect of the
presence and absence of halophytes on microbial activity in saline soil. Those authors found greater microbial activity in soil close to the plant roots.
For soil cultivated with the sunflower (Table 10), the Bact populations in the soil collected during period 2 differed between the treatments receiving FPW and OPW
(p = 0.0218), FPW and ACW (p= 0.0478), and PW against
the rainfed treatment (p= 0.0026), and during period 3
between the treatments with FPW and ACW (p= 0.0171)
and PW against the rainfed treatment (p = 0.0177). No
changes in Bact populations were detected between periods 1 and 4, considering the irrigation treatments and the control with no irrigation. It is believed that the differences between FPW, OPW and ACW are due to the physical and chemical characteristics of the water used, as well as to changes in the soil properties that may influence bacteria and other soil microorganisms.
Yet, in the castor bean crop (Table 11) there were no significant differences between irrigation treatments for Bact populations in the soil, except between PW and the
rainfed treatment (p= 0.0179). There was significance by
t-test between periods 1 and 3 at a level of 6.8%. The low
level of significance may be due to the reduced number of cycles (first and second cycles), but interference from the castor bean plants in maintaining the populations of cultivable bacteria should also not be ruled out. In future studies, the relationship between plants and groups of functional microorganisms in an irrigated agrosystem should be explored using molecular metagenomic techniques.
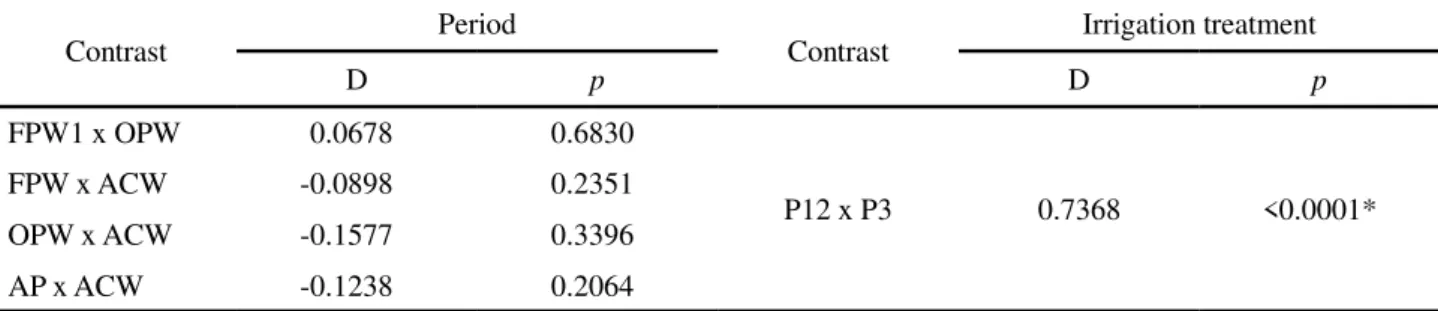
In relation to the castor bean (Table 12), the sampling period had a significant effect on the Fung populations ; however, the irrigation treatments did not
differ by t-test (p= 0.1891).
Fungal populations ranged from 102 to 104 CFU
per gram of soil (Tables 1 and 2), reducing over the crop cycles; this reduction may be associated with moisture and the flow rates for energy and soil heat. The greater amount of Fung populations in period 1 and 2 (dry season) for most of the irrigation treatments can be explained by the lower level of water content in the soil and the consequent increase in heat flow rate, which favours soil filamentous fungi. This result confirms observations made
by Rodrigues et al. (2011), who evaluated microclimate
Table 10 - Difference estimation (D) andp-values associated with the t-test between mean values for Bact in the rhizosphere of oilseed sunflower plants during the first and second production cycles, for irrigation treatment and period of soil sampling
1Filtered produced water (FPW) and water treated by reverse osmosis (OPW), water captured from the Açu aquifer (ACW) and the control with no
irrigation (RFD);2P1 (cycle 1 pre-planting); P2 (cycle 1 pre-harvest); P3 (cycle 2 pre-harvest); *Significant by t-test at less than 5% probability
Treatment
Contrast P12 P2 P3
D p D p D p
FPW1 x OPW -0.0900 0.7012 -0.5853 0.0218* -03793 0.1192
FPW x ACW 0.0680 0.7860 -0.5280 0.0478* 0.6553 0.0171*
OPW x ACW 0.1580 0.3585 0.0573 0.7360 0.2760 0.1181
AP x ACW 0.1130 0.5302 -0.2353 0.2002 0.4657 0.0177*
APs x RFD -0.2073 0.2498 0.6181 0.0026* 0.0462 0.7935
Contrast FPW OPW ACW RFD
D p D p D p D p
P1 x P3 0.5053 0.1105 0.2160 0.2317 -0.2180 0.3513 0.4213 0.0523
Contrast Period Contrast Irrigation treatment
D p D p
FPW1 x OPW 0.2416 0.3763
P12 x P3 0.3411 0.0688
FPW x ACW 0.0313 0.1699
OPW x ACW -0.2102 0.4397
AP x ACW -0.0894 0.5122
AP x RFD 0.3035 0.0179*
Table 11 - Difference estimation (D) andp-values associated with the t-test between mean values for Bact in the rhizosphere of castor
bean plants during the first and second production cycles, for irrigation treatment and period of soil sampling
1Filtered produced water (FPW) and water treated by reverse osmosis (OPW), water captured from the Açu aquifer (ACW) and the control with no
irrigation (RFD);2P1 (cycle 1 pre-planting); P2 (cycle 1 pre-harvest); P3 (cycle 2 pre-harvest); *Significant by t-test at less than 5% probability
Table 12 -p-values associated with the F-test for the population density of cultivable filamentous fungi (Fung) in soil cultivated with
sunflower and castor bean plants, for irrigation factor (I) and period of soil sampling (P)
Factor DF
Fung
DF
Fung
F p F p
Sunflower Castor bean
I 3 8.04 0.0085* 3 2.02 0.1891
P 3 29.69 <0.0001* 2 57.92 <0.0001*
I x P 9 1.81 0.1596 6 1.94 0.1363
*Significant by t-test at less than 5% probability
the rainy season in the region. Such climate conditions may have hindered development of the cultivable soil
filamentous fungi. Souto et al. (2008) evaluated the
populations of microorganisms and soil mesofauna in the semi-arid region of the state of Paraíba during periods with different rates of rainfall, and observed greater fungal
growth and lower bacterial growth in the season with less rainfall. Those authors attributed the result to a reduction
in O2 due to the rainfall. In the present work no differences
Contrast Period Contrast Irrigation treatment
D p D p
FPW1 x OPW 0.0678 0.6830
P12 x P3 0.7368 <0.0001*
FPW x ACW -0.0898 0.2351
OPW x ACW -0.1577 0.3396
AP x ACW -0.1238 0.2064
Table 13 - Difference estimation (D) andp-values associated with the t-test between mean values for Fung in the rhizosphere of sunflower plants during the first, second and third production cycle, for irrigation treatment and period of soil sampling
1Produced water (AP), filtered (FPW) and water treated by reverse osmosis (OPW), and water captured from the Açu aquifer (ACW);2P1 (cycle 1 pre-planting);
P2 (cycle 1 pre-harvest); P3 (cycle 2 pre-harvest); * Significant by t-test at less than 0.01% probability
Contrast Period Contrast Irrigation treatment
D p D p
FPW1 x OPW -0.0464 0.6523
P12 x P3 0.8077 <0.0001*
FPW x ACW 0.0495 0.6750
OPW x ACW 0.0960 0.2278
AP x ACW 0.0728 0.4007
AP x RFD 0.1350 0.1377
Table 14 - Difference estimation (D) andp-values associated with the t-test between mean values for Fung in the rhizosphere of castor
bean plants during the first and second production cycles, for irrigation treatment and period of soil sampling
1Produced water (AP), filtered (FPW) and water treated by reverse osmosis (OPW), and water captured from the Açu aquifer (ACW);2P1 (cycle 1 pre-planting);
P2 (cycle 1 pre-harvest); P3 (cycle 2 pre-harvest); * Significant by t-test at less than 0.01% probability
CONCLUSIONS
1. Microbiological activity and soil organic carbon are sensitive to the irrigation of sunflower plants with oilfield produced water. In the castor bean crop, that irrigation affects soil basal respiration;
2. Irrigation with oilfield produced water and water treated by filtration may be a short-term alternative for the production of the castor bean and sunflower to obtain biodiesel. In future work, biological properties of the soil should be evaluated in the medium and long term, in order to make oilseed production more sustainable and viable in the semi-arid region.
ACKNOWLEDGEMENT
This study was a part of the project on the reuse of produced water for irrigation, and it was supported partially by Petrobras. The authors thanks Petrobras for financial support, and the Embrapa Tropical Agroindustry for logistics and laboratory facilities.
REFERENCES
ALISSON, P. D. Survival analysis using SAS®: a practical guide. 2nd ed. Cary, (N C.): SAS Institute Inc., 2010. 327 p. AMERICAN PUBLIC HEALTH ASSOCIATION. Standard methods for the examination of water and wastewater. 21. ed. Washington: APHA: AWWA: WEF, 2005. 1368 p.
AMINI, S. et al. Mathematical modelling of a hydrocyclone for the down-hole oil-water separation (DOWS). Chemical Engineering Research and Design, v. 90, n. 12, p. 2186-2195,
2012.
AGÊNCIA NACIONAL DO PETRÓLEO, GÁS NATURAL E BIOCOMBUSTÍVEIS (BRASIL). Anuário estatístico brasileiro do petróleo, gás natural e biocombustíveis 2015. Disponível em: <http://www.anp.gov.br/?pg=76798 >. Acesso em: 09 fev. 2016.
ARAUJO, K. D. et al. Avaliação da atividade microbiana
DINIS NETO, M. A.et al. Adubação NPK e épocas de plantio para mamoneira. I - Componentes da produção e produtividade.
Revista Ciência Agronômica, v. 40, n. 4, p. 578-587, 2009. DINIZ, L. T.et al. Alterações microbianas e químicas de um
Gleissolo sob macaubeiras nativas em função da variação sazonal e espacial.Bioscience Journal, v. 30, n. 3, p. 750-762, 2014. FERREIRA, R. N. C. et al. Effects of wastewater from oil
exploration on soil mesofauna. Bulletin of Environmental Contamination and Toxicology, v. 95, n. 6, p. 777-783. 2015. FERREIRA, R. N. C.; WEBER, O. B.; CRISÓSTOMO, L. A. Produced water Irrigation changes the soil mesofauna community in a semiarid agroecosystem. Environmental Monitoring Assessment, v. 187, n. 8, p. 1-9, 2015.
FREITAS, A. R.; FERREIRA, R. P.; MOREIRA, A. Análise de dados de medidas repetidas por meio do modelo linear geral e do modelo misto. Revista de Ciências Agrárias, v. 54, n. 3,
p. 214-224, 2011.
GEISSELER, D.; HORWATH, W.; SCOW, K. Soil moisture and plant residue addition interact in their effect on extracellular enzyme activity.Pedobiologia, v. 54, p. 71-78, 2011.
LOPES, E. D. O. R. et al. Short-term effects of produced
water on microbial activity in semiarid soil. International Journal of Current Microbiology and Applied Sciences, v. 3, n. 2, p. 395-403, 2014.
MELO, M. V. et al. Advanced performance evaluation of a reverse osmosis treatment for oilfield produced water aiming reuse.Desalination, v. 250, n. 3, p. 1016-1018, 2010.
MOREIRA, F. M. S.; SIQUEIRA, J. O. Microbiologia e Bioquímica do Solo. 2. ed. Lavras: UFLA, 2006. 729 p. MOTTA, A. R. P.ET AL. Tratamento de água produzida de petróleo para remoção de óleo por processos de separação por membranas: revisão.Engenharia Sanitária e Ambiental,
v. 18, n. 1, p. 15-26, 2013.
PASCUAL, I. et al. Effect of water deficit on microbial
characteristics in soil amended with sewage sludge or inorganic fertilizer under laboratory conditions.Bioresource Technology, v. 98, p. 29-37, 2007.
PEREIRA, S. P. P. ET AL. From sub cellular to community level: toxicity of glutaraldehyde to several aquatic organisms.
Science of The Total Environment, v. 470/471, p. 147-158, 2014.
QIU, S.; HUANG, D.; LIN, X. Effects of fertilization regimes on tea yields, soil fertility, and soil microbial diversity.Chilean Journal of Agricultural Research, v. 74, n. 3, p. 333-339,
2014.
RAIJ, B. Vanet al.Recomendações de adubação e calagem para o Estado de São Paulo. Campinas: Instituto Agronômico
e Fundação, 1996. 285 p. (Boletim Técnico, 100).
RODRIGUES, H. J. B. et al. Variabilidade quantitativa de
população microbiana associada às condições microclimáticas observadas em solo de floresta tropical úmida.Revista Brasileira de Meteorologia, v. 26, n . 4, p. 629-638, 2011.
SANTOS, K. C. F. et al. Atividade biológica em solo salino
sódico saturado por água sob cultivo de Atriplex numulária.
Revista Ciência Agronômica, v. 42, n. 3, p. 619-627, 2011.
SILVA, C. F.et al. Carbono orgânico total, biomassa microbiana e atividade enzimática do solo de áreas agrícolas, florestais e pastagem no Médio Vale do Paraíba do Sul (RJ). Revista Brasileira de Ciência do Solo, v. 36, n. 6, p. 1680-1689, 2012.
SILVA, E. E.; AZEVEDO, P. H. S.; DE-POLLI, H.Determinação da respiração basal (RBS) e quociente metabólico do solo (qCO2). Seropédica: Embrapa Agrobiologia, 2007. 4 p. (Embrapa Agrobiologia. Comunicado Técnico 99).
SILVA, F. C. Manual de análises químicas de solo, plantas e fertilizantes. 2. ed. Brasília, DF : Embrapa Informação
Tecnológica, 2009. 627 p.
SOUSA, A. F.et al. Nutrient content in sunflowers irrigated with
oil exploration water.Revista Caatinga, v. 29, n. 1, p. 94-100, 2016.
SOUTO, P. C. et al. Comunidade microbiana e mesofauna edáficas em solo sob Caatinga no semi-árido da Paraíba.