Campina Grande, PB, UAEA/UFCG – http://www.agriambi.com.br
Temporal stability of soil moisture in an experimental watershed
in the Pernambuco semi-arid region
Valdemir P. Silva Junior
1, Abelardo A. A. Montenegro
1& Rogério O. de Melo
2DOI: http://dx.doi.org/10.1590/1807-1929/agriambi.v20n10p880-885
A B S T R A C T
Soil moisture estimation is very important in decision making regarding agricultural practices and investigations in hydrology. The aim of the study was to evaluate surface soil moisture temporal stability under two cover crop conditions in an experimental watershed in the Brazilian semi-arid region, aiming to identify stable points, thus reducing monitoring costs and highlighting the importance of temporal stability in a watershed. Fourty five soil moisture monitoring campaigns in the layers of 0-0.10 and 0.10-0.20 m were conducted using a capacitance probe (Diviner – 2000®) during the period from 10/07/2010 to 03/25/2014, with soil cover under native bushy vegetation and degraded pasture, predominantly
Brachiaria decumbens. Temporal stability was evaluated through the mean relative difference
technique. The point located at the middle of a slope under pasture and bushes was the most stable, with determination coefficient of 90 and 92% for both layers.
Estabilidade temporal da umidade do solo
em bacia experimental do semiárido pernambucano
R E S U M O
A estimativa da umidade no solo é de grande relevância na tomada de decisão de práticas agrícolas e pesquisas na área da hidrologia. Objetivou-se, neste estudo, avaliar a estabilidade temporal da umidade do solo nas camadas superficiais em duas condições de cobertura vegetal em uma bacia hidrográfica experimental, no semiárido brasileiro, buscando-se identificar pontos com maior estabilidade da umidade desonerando, assim, custos de monitoramento e ressaltando a importância da estabilidade temporal em uma bacia hidrográfica. Realizaram-se 45 campanhas de monitoramento de umidade do solo nas camadas de 0-0,10 e 0,10-0,20 m utilizando a sonda capacitiva/Diviner – 2000® no período de 07/10/2010 a 25/03/2014, com cobertura do solo e presença de vegetação arbustiva natural, além de pastagem degradada com predominância de capim Braquiária (Brachiaria decumbens). A estabilidade temporal foi avaliada por meio da diferença relativa média. O
ponto localizado em meia-encosta da bacia em presença de pastagem foi o mais estável, com coeficientes de determinação de 90 e 92% para ambas as camadas.
Key words:
soil types soil cover Caatinga
Palavras-chave:
tipos de solo cobertura do solo Caatinga
1 Universidade Federal Rural de Pernambuco/Departamento de Engenharia Agrícola/Pós-Graduação em Engenharia Agrícola. Recife, PE. E-mail:
[email protected] (Corresponding author); [email protected]
2 Instituto Federal de Pernambuco. Garanhuns, PE. E-mail: [email protected]
Introduction
Soil moisture is a key physical parameter for the understanding of a series of hydrological processes, such as the storage and partitioning of the water supplied by the rainfall in runoff or infiltration (Heathman et al., 2009; 2012).
Menezes et al. (2013) observed that soil moisture is not recovered when the first rains occur after a drought period and that, in the rainy period, soil moisture under natural cover condition is higher than that under uncovered soil condition.
Sinoga et al. (2011) and Montenegro et al. (2013a;b) point out that the biological recovery of the semi-arid vegetation is influenced not only by rainfall, but also by climatic, soil physical and topographic factors.
Zucco et al. (2014) evaluated the influence of land use on spatial and temporal variability of soil moisture in watershed with forest and pasture, and observed that it is possible to identify stable points of soil moisture even under different land use conditions. In addition, the pasture area was the most representative of the soil moisture dynamics in the watershed.
Baroni et al. (2013) concluded that, under drought conditions, the spatial distribution of soil moisture is mainly affected by the spatial variability of the vegetation.
Wang et al. (2015) highlighted that, in drier periods, the soil under vegetation tends to decrease its moisture levels due to transpiration, increasing its spatial variability.
With the objective of investigating soil moisture variability and supporting actions of hydrological monitoring in the semi-arid region, this study aimed to evaluate soil moisture dynamics in the superficial layers in an experimental watershed with different vegetal covers, in the period from 2010 to 2014, searching to identify stable and representative points of the mean behavior of the soil moisture.
Material and Methods
The study was carried out at the Experimental Watershed of Jatobá with a drainage area of 14 km2. The Jatobá Watershed has an area of 149 km2 and is located in the state of Pernambuco. The watershed has three predominant soils: Yellow Argisol, upstream of the watershed, and Litholic Neosols and Regolithic Neosols, in the downstream area. In the Jatobá Watershed, 17 moisture monitoring points were defined in such a way to represent the soils close to the main drainage networks of the watershed (Figure 1).
Due to the accessibility regarding topography and vegetal cover of the watershed, the moisture monitoring points were installed in two of the main soils of the watershed, i.e., Yellow Argisol and Regolithic Neosol, according to the soil classification of EMBRAPA (2000).
The climate of the region is BSsh, semi-arid, very hot, Steppe type, according to Köppen’s classification: the mean annual rainfall is approximately 600 mm, with mean temperature of 23 ºC and reference potential evapotranspiration (ET0) around 2,000 mm per year. The predominant vegetation is hyperxerophilic Caatinga (Montenegro & Montenegro, 2006), an exclusively Brazilian biome.
The monitoring of soil moisture dynamics was experimentally evaluated in intervals of approximately 15 days, during the period from October 7, 2010, to March 25, 2014.
The soil cover at the points P1 to P17 (Figure 1) is pasture with Brachiaria grass (Brachiaria decumbens), highly degraded,
with the presence of small bushes native to the region, common in the pastures of the region and of native vegetation (Caatinga), not very dense, due to the anthropic action.
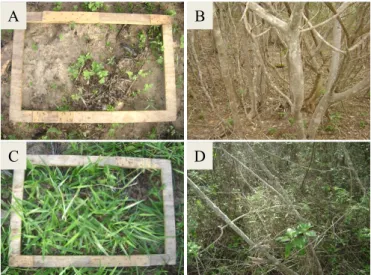
The vegetation showed strong seasonality along the monitoring time, characteristic of the Caatinga biome (Figures 2B and 2D). In the dry period, the native vegetation loses leaves (deciduous vegetation) and the pasture area has zones of exposed soil because of the low cover density, which is more accentuated for being under degradation through the absence of adequate management. However, soil cover conditions changes considerably in the rainy season, and it is one of the main characteristics of the vegetation in the semi-arid region (Figures 2A and 2C).
Soil moisture was monitored using a capacitance probe (Diviner – 2000®), Sentek Pty Ltd (2000), during the period from October 2010 to March 2014, totaling 45 readings in each one of the 17 access tubes installed along the watershed. Source: EMBRAPA (2000)
Figure 1. Map of the drainage network of the Jatobá River with representation of the location of the monitoring points and soil units in the Jatobá Watershed
Figure 2. Soil vegetal cover in the Jatobá Watershed: Dry period with pasture cover (Brachiaria decumbens) (A),
Dry period with Caatinga cover (B), Rainy period with pasture cover (Brachiaria decumbens) (C), Rainy period
with Caatinga cover (D)
A B
and were common to all points of the watershed. Although the probe allows to monitor greater depths, the analysis in this study focused on the region closest to the surface. Table 1 shows some soil physical characteristics for the 17 points of the watershed, determined according to the method of EMBRAPA (1997). Soil texture at the monitoring points showed values of sand ranging from 592.6 to 855.6 g g-1, and clay from 116.0 to 217.6 g g-1.
The data of rainfall were obtained using three automatic pluviometers (Campbell Scientific - TB4-L Rain Gauge), with resolution of 0.254 mm, distributed along the watershed. The meteorological data were recorded in a climatological station (Campbell Scientific), applying the equation of Penman-Monteith to obtain the reference evapotranspiration, on a daily scale.
Soil moisture temporal stability on a daily scale was analyzed using the technique proposed by Vachaud et al. (1985) and Souza et al. (2011), based on the calculation of the relative difference, which allows the analysis of the deviation between the values observed individually in space and their mean.
For each position i, the mean of the values of relative difference, δi (Eq. 1), was calculated, in which m is the number of analyzed observations.
The standard deviation around this mean, at each position i, was determined by Eq. 2.
*Soil Density (PS - Pasture-slope; CT - Caatinga-top; PT - Pasture-top; PA - Pasture; CA - Caatinga; CP - Caatinga-pasture)
Point/ Cover
Layer (m)
Ds.* kg dm-3
Sand Clay Silt g kg-1
P1/PS 0.00-0.10 1.50 738.4 177.6 84.0 0.10-0.20 1.55
P2/PS 0.00-0.10 1.47 686.8 217.6 95.6 0.10-0.20 1.51
P3/PS 0.00-0.10 1.44 774.6 177.6 47.8 0.10-0.20 1.51
P4/PS 0.00-0.10 1.34 725.8 197.6 76.6 0.10-0.20 1.51
P5/PS 0.00-0.10 1.53 814.6 177.6 7.8 0.10-0.20 1.57
P6/CT 0.00-0.10 1.45 853.8 137.6 8.6 0.10-0.20 1.43
P7/PT 0.00-0.10 1.47 855.6 137.6 6.8 0.10-0.20 1.52
P8/PA 0.00-0.10 1.35 843.4 137.6 19.0 0.10-0.20 1.40
P9/CA 0.00-0.10 1.57 724.0 116.0 160 0.10-0.20 1.65
P10/PS 0.00-0.10 1.60 681.8 217.6 100.6 0.10-0.20 1.63
P11/CP 0.00-0.10 1.49 710.0 157.6 132.4 0.10-0.20 1.51
P12/PA 0.00-0.10 1.66 740.2 197.6 62.2 0.10-0.20 1.65
P13/CA 0.00-0.10 1.62 592.6 317.6 89.8 0.10-0.20 1.60
P14/PA 0.00-0.10 1.35 724.0 116.0 160.0 0.10-0.20 1.32
P15/CA 0.00-0.10 1.47 713.0 132.0 155.0 0.10-0.20 1.48
P16/PA 0.00-0.10 1.55 841.0 137.6 21.4 0.10-0.20 1.56
P17/CA 0.00-0.10 1.55 772.2 137.6 90.2 0.10-0.20 1.60
Table 1. Type of cover, soil density (Ds) and granulometry for the 17 points studied in the Jatobá Watershed
The mean relative differences, expressed in percentage terms, associated with the respective standard deviation over time and ordered from the lowest to the highest one, allowed to identify the position at which the values become close to the mean in space with values close to zero, at any moment.
The lower the standard deviation, the higher the reliability of the measurement to estimate the overall mean. The measuring point of stable moisture was validated through the analysis of correlation between the mean of the response of the stable point and the mean of the other monitored points, as applied by Souza et al. (2011) and Fontes Júnior et al. (2012).
Results and Discussion
The total rainfalls in the years of 2010, 2011, 2012, 2013 and 2014 were 1,083, 854, 388, 921 and 884 mm, respectively, with total values of annual reference evapotranspiration of 1,822, 1,654, 2,109, 1,826 and 1,202 mm. There was a reduction of more than 35% in rainfall between the years of 2010 and 2012, and a reduction of 55% in relation to the mean of the region. In 2012, one of the longest droughts recorded in the last forty years in the Brazilian northeast region occurred.
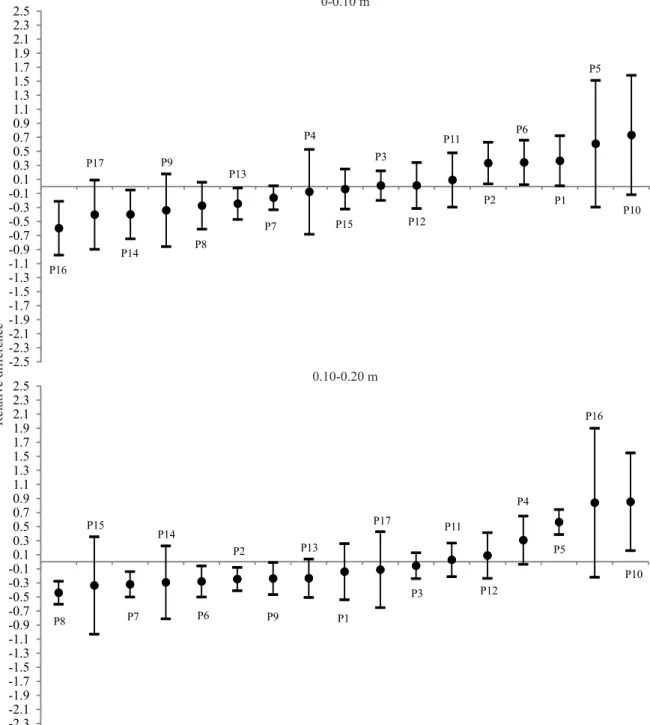
The mean relative differences and the respective standard deviations of soil moisture for the 17 points, in the layers of 0-0.10 and 0.10-0.20 m (Figure 3). According to Melo (2013) and Souza et al. (2011), the site with mean relative difference close to zero, with the lowest standard deviation, must be considered as representative.
For the studied period, in the layers of 0-0.10 and 0.10-0.20 m (Figure 3), the point P3 under pasture cover, located on a slope at altitude of 750 m in a Yellow Argisol, showed the value of difference relative to the other points closest to zero, with lower deviations in relation to the mean for both evaluated layers, i.e., this is the most stable point for both studied layers.
For the rest of the monitoring points, there was not a simultaneous condition of relative difference close to zero or reduced deviation in relation to the mean. Similar results were found by Ávila et al. (2010) in pasture area, who identified only one stable point for the entire period of the year.
The stable point found for the studied period is similar to the results reported by Melo (2013), who evaluated 18 moisture points in the same watershed of the present study in rainy and dry periods, for the years 2010 and 2012. The point P3, under degraded pasture cover, and the presence of short native bushes were identified, located close to the mean altitude of the watershed, 730 m.
The points located in areas under Caatinga cover showed, in their great majority, the highest mean relative differences, as well
i ij
j 1
δ =
∑
δ (1)(
)
m 2
i ij i
j 1 1 m 1 =
σ = δ − δ
Figure 3. Mean relative difference over time for soil moisture measured in the layers of 0-0.10 and 0.10-0.20 m and the respective standard deviations for the monitoring period
P16 P17
P14 P9
P8 P13
P7 P4
P15 P3
P12 P11
P2 P6
P1 P5
P10
-2.5 -2.3 -2.1 -1.9 -1.7 -1.5 -1.3 -1.1 -0.9 -0.7 -0.5 -0.3 -0.1 0.1 0.3 0.5 0.7 0.9 1.1 1.3 1.5 1.7 1.9 2.1 2.3 2.5
P8 P15
P7 P14
P6 P2
P9 P13
P1 P17
P3 P11
P12 P4
P5 P16
P10
-2.5 -2.3 -2.1 -1.9 -1.7 -1.5 -1.3 -1.1 -0.9 -0.7 -0.5 -0.3 -0.1 0.1 0.3 0.5 0.7 0.9 1.1 1.3 1.5 1.7 1.9 2.1 2.3 2.5
Relative dif
ference
0-0.10 m
0.10-0.20 m
as the highest standard deviations. Wang et al. (2015) observed the highest spatial variability of moisture in areas of vegetation with root zone predominantly in the layer of 0.0-0.3 m.
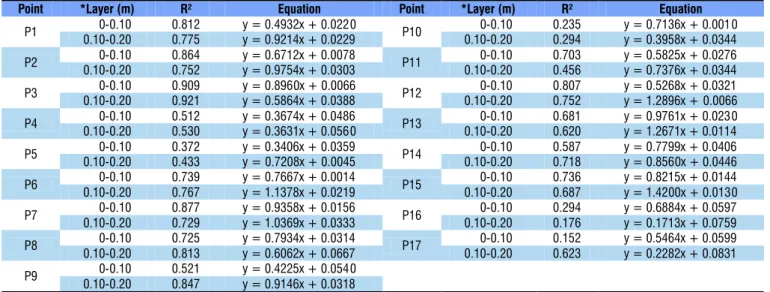
The representativeness of this point in relation to the mean of the others in the watershed can be evaluated through the correlation analysis. There was correlation between soil moisture data of the stable point in relation to the mean of the other points for both layers (Table 2). The point P3, under pasture cover, showed the highest correlation (R² = 0.90) in the layer of 0-0.10 m and R² = 0.92 in the layer of 0.10-0.20 m.
The lowest coefficients of determination were obtained for the points under Caatinga cover, with R² = 0.15 at the point P17 in the layer of 0-0.10 m.
The soil moisture dynamics for the point P3 in the layers of 0-0.10 and 0.10-0.20 m was compared with the moving average
of the 45 readings at the 17 remaining moisture points; for the monitoring period, they varied from 0.05 to 0.20 m3 m-3 and from 0.09 to 0.19 m3 m-3 (Figure 4).
The mean moisture calculated by the relative differences during the experimental period was representative in comparison to the point P3 for both studied layers. The good fit shown in Figure 4 is a relevant aspect for sampling planning, indicating an adjustment between the moisture dynamics of the point P3 and the other points.
0-0.10 and 0.10-0.20 m
*Layer - Layer of monitoring; y - Moisture of the stable point; x - Mean moisture of the other points
Point *Layer (m) R² Equation Point *Layer (m) R² Equation
P1 0.00-0.10 0.812 y = 0.4932x + 0.0220 P10 0.00-0.10 0.235 y = 0.7136x + 0.0010 0.10-0.20 0.775 y = 0.9214x + 0.0229 0.10-0.20 0.294 y = 0.3958x + 0.0344
P2 0.00-0.10 0.864 y = 0.6712x + 0.0078 P11 0.00-0.10 0.703 y = 0.5825x + 0.0276 0.10-0.20 0.752 y = 0.9754x + 0.0303 0.10-0.20 0.456 y = 0.7376x + 0.0344
P3 0.00-0.10 0.909 y = 0.8960x + 0.0066 P12 0.00-0.10 0.807 y = 0.5268x + 0.0321 0.10-0.20 0.921 y = 0.5864x + 0.0388 0.10-0.20 0.752 y = 1.2896x + 0.0066
P4 0.00-0.10 0.512 y = 0.3674x + 0.0486 P13 0.00-0.10 0.681 y = 0.9761x + 0.0230 0.10-0.20 0.530 y = 0.3631x + 0.0560 0.10-0.20 0.620 y = 1.2671x + 0.0114
P5 0.00-0.10 0.372 y = 0.3406x + 0.0359 P14 0.00-0.10 0.587 y = 0.7799x + 0.0406 0.10-0.20 0.433 y = 0.7208x + 0.0045 0.10-0.20 0.718 y = 0.8560x + 0.0446
P6 0.00-0.10 0.739 y = 0.7667x + 0.0014 P15 0.00-0.10 0.736 y = 0.8215x + 0.0144 0.10-0.20 0.767 y = 1.1378x + 0.0219 0.10-0.20 0.687 y = 1.4200x + 0.0130
P7 0.00-0.10 0.877 y = 0.9358x + 0.0156 P16 0.00-0.10 0.294 y = 0.6884x + 0.0597 0.10-0.20 0.729 y = 1.0369x + 0.0333 0.10-0.20 0.176 y = 0.1713x + 0.0759
P8 0.00-0.10 0.725 y = 0.7934x + 0.0314 P17 0.00-0.10 0.152 y = 0.5464x + 0.0599 0.10-0.20 0.813 y = 0.6062x + 0.0667 0.10-0.20 0.623 y = 0.2282x + 0.0831
P9 0.00-0.10 0.521 y = 0.4225x + 0.0540 0.10-0.20 0.847 y = 0.9146x + 0.0318
0
50
100
150
200
250 0
0.10 0.20 0.30 0.40 0.50 0.60
V
olumetric moisture (m
3 m -3)
Rainfall/Evapotranspiration (mm)
0
50
100
150
200
250
0 0.10 0.20 0.30 0.40 0.50 0.60
Rainfall Evapotranspiration P3 Moving average
9/29/10 2/19/11 7/12/11 2/12/11 4/23/12 9/13/12 2/3/13 6/26/13 16/11/13 4/8/14
Figure 4. Moisture dynamics at the point P3 for the layers of 0-0.10 and 0.10-0.20 m in relation to the moving average of the forty-five readings of the seventeen points of soil moisture, performed from 10/07/2010 to 03/25/2014
0-0.10 m
Conclusions
1. The point located at 750 m of altitude in a Yellow Argisol with degraded pasture as soil cover (Point P3) showed the most stable values for the entire studied period and for both analyzed soil layers, validating previous studies.
2. The stable point adequately represents the mean values of the others, indicating coefficient of determination of 90% for the layer of 0-0.10 m and 92% for the layer of 0.10-0.20 m.
Acknowledgments
To the Funding Authority for Studies and Projects (FINEP) (Project: Experimental and Representative Watersheds – Hydrology Network of the Semi-Arid Region - REHISA); to the National Council for Scientific and Technological Development (CNPq), for funding the project; to the Coordination for the Improvement of Higher Education Personnel (CAPES), for granting the graduate scholarship; and to the Federal Rural University of Pernambuco (UFRPE), for the institutional support.
Literature Cited
Ávila, L. F.; Mello, C. R.; Silva, A. M. Estabilidade temporal do conteúdo de água em três condições de uso do solo, em uma bacia hidrográfica da região da Serra da Mantiqueira, MG. Revista Brasileira de Ciência do Solo, v.34, p.2001-2009, 2010. http:// dx.doi.org/10.1590/S0100-06832010000600024
Baroni, G.; Ortuani, B.; Facchi, A.; Gandolfi, C. The role of vegetation and soil properties on the spatio-temporal variability of the surface soil moisture in a maize-cropped field. Journal of Hydrology, v.489, p.148-159, 2013. http://dx.doi.org/10.1016/j.jhydrol.2013.03.007 EMBRAPA - Empresa Brasileira de Pesquisa Agropecuária. Manual
de métodos de análises de solo. 2.ed. Rio de Janeiro: Ministério da Agricultura e do Abastecimento, 1997. 212p.
EMBRAPA - Empresa Brasileira de Pesquisa Agropecuária. Levantamento de reconhecimento de baixa e média intensidade dos solos do Estado de Pernambuco. Rio de Janeiro: Embrapa Solos. Escala: 1:100.000, 2000. 382p.
Fontes Júnior, R. V. P.; Montenegro, A. A. A.; Montenegro, S. M. G. L.; Santos, T. E. Estabilidade temporal da potenciometria e da salinidade em vale aluvial no semiárido de Pernambuco. Revista Brasileira de Engenharia Agrícola e Ambiental, v.16, p.1188-1197, 2012. http://dx.doi.org/10.1590/S1415-43662012001100007 Heathman, G. C.; Cosh, M. H.; Han, E.; Jackson, T. J.; Mckee, L.; Mcafee,
S. Field scale spatiotemporal analysis of surface soil moisture for evaluating point-scale in situ networks. Geoderma, v.170, p.195-205, 2012. http://dx.doi.org/10.1016/j.geoderma.2011.11.004
Heathman, G. C.; Larose, M.; Cosh, M. H.; Bindlish, R. Surface and profile soil moisture spatio-temporal analysis during an excessive rainfall period in the Southern Great Plains, USA. Catena, v.78, p.159-169, 2009. http://dx.doi.org/10.1016/j.catena.2009.04.002 Melo, R. O. Estabilidade temporal e variabilidade da umidade do solo
em uma bacia experimental no semiárido pernambucano. Recife: UFRPE, 2013. 91p. Tese Doutorado
Menezes, J. A. L.; Santos, T. E. M.; Montenegro, A. A. A.; Silva, J. R. L. Comportamento temporal da umidade do solo sob Caatinga e solo descoberto na Bacia Experimental do Jatobá, Pernambuco. Water Resources and Irrigation Management, v.2, p.45-51, 2013. Montenegro, A. A. A.; Abrantes, J. R. C. B. O.; Lima, J. L. M. P. de;
Singh, V.; Santos, T. E. M. Impact of mulching on soil and water dynamics under intermittent simulated rainfall. Catena, v.109, p.139-149, 2013a. http://dx.doi.org/10.1016/j.catena.2013.03.018 Montenegro, A. A. A.; Lima, J. L. M. P. de; Abrantes, J. R. C. B. O.;
Santos, T. E. M. Impact of mulching on soil and water conservation in semiarid catchment: Simulated rainfall in the field and in the laboratory. Die Bodenkultur: Journal for Land Management, Food and Environment, v.64, p.79-85, 2013b.
Montenegro, A. A. A.; Montenegro, S. M. G. L. Variabilidade espacial de classes de textura, salinidade e condutividade hidráulica de solos em planície aluvial. Revista Brasileira de Engenharia Agrícola e Ambiental, v.10, p.30-37, 2006. http://dx.doi. org/10.1590/S1415-43662006000100005
Sentek PTY Ltd. - Diviner 2000. Guia del usuario. Version 1.0. 2000 Sinoga, R. J. D.; Murillo, M. M. A.; Galeote, G. R.; Marín, R. G. The
effects of soil moisture variability on the vegetation pattern in Mediterranean abandoned fields (Southern Spain). Catena, v.85, p.1-11, 2011. http://dx.doi.org/10.1016/j.catena.2010.11.004 Souza, E. R.; Montenegro, A. A. A.; Montenegro, S. M. G.; Matos, J.
A. Temporal stability of soil moisture in irrigated carrot crops in Northeast Brazil. Agricultural Water Management, v.99, p.26-32, 2011. http://dx.doi.org/10.1016/j.agwat.2011.08.002
Vachaud, G.; Silans, A. P. de; Balabanis, P.; Vauclin, M. Temporal stability of spatially measured soil water probability density function. Soil Science Society of America Journal, v.49, p.822–827, 1985. http:// dx.doi.org/10.2136/sssaj1985.03615995004900040006x
Wang, T.; Wedin, D. A.; Franz, T. E.; Hiller, J. Effect of vegetation on the temporal stability of soil moisture in grass-stabilized semi-arid sand dunes. Journal of Hydrology, v.521, p.447-459, 2015. http:// dx.doi.org/10.1016/j.jhydrol.2014.12.037