* Corresponding author: E-mail: [email protected]
Received: August 12, 2015 Approved: December 22, 2015
How to cite: Soares BL, Ferreira
PAA, Rufini M, Martins FAD, Oliveira DP, Reis RP, Andrade MJB, Moreira FMS. Agronomic and Economic Efficiency of Common-Bean Inoculation with Rhizobia and Mineral Nitrogen Fertilization. Rev Bras Cienc Solo.
2016;40:e0150235.
Copyright: This is an open-access article distributed under the terms of the Creative Commons Attribution License, which permits unrestricted use, distribution, and reproduction in any medium, provided that the original author and source are credited.
Agronomic and Economic
Efficiency of Common-Bean
Inoculation with Rhizobia and
Mineral Nitrogen Fertilization
Bruno Lima Soares(1)
, Paulo Ademar Avelar Ferreira(2), Márcia Rufini(1)
, Fábio Aurélio Dias Martins(3)
, Dâmiany Pádua Oliveira(3)
, Ricardo Pereira Reis(4)
, Messias José Bastos de Andrade(3)
and Fatima Maria de Souza Moreira(1)*
(1) Universidade Federal de Lavras, Departamento da Ciência do Solo, Lavras, Minas Gerais, Brasil. (2) Universidade Federal de Santa Maria, Santa Maria, Rio Grande do Sul, Brasil.
(3) Universidade Federal de Lavras, Departamento de Agricultura, Lavras, Minas Gerais, Brasil.
(4) Universidade Federal de Lavras, Departamento de Administração e Economia, Lavras, Minas Gerais, Brasil.
ABSTRACT: Management of biological nitrogen fixation in common bean still requires
improvement. The objective of this study was to verify the compatibility of nitrogen fertilization with biological N2 fixation to increase common bean yield and profitability.
Four field experiments were performed in four municipalities of Minas Gerais, Brazil, during the 2009 and 2010 winter crop season. The 2009 crop experiments were set up under a no-till system and the 2010 crop was conducted using conventional tillage. A randomized block experimental design was used with four replications and seven treatments combining application rates of mineral N (at sowing and/or topdressing) and seed inoculation with Rhizobium tropici strain CIAT899. Inoculation with 20 kg ha-1
N-urea at sowing and seed inoculation does not interfere with nodule dry matter and promotes
yield comparable to that observed with 80 kg ha-1
N-urea with economic profitability in both no-till and conventional tillage systems. These results show the possibility of economic savings with respect to N fertilizers, but also a significant ecological contribution by avoiding problems associated with misuse of these fertilizers, such as eutrophication of waterways and denitrification.
Keywords:Phaseolus vulgaris, nitrogen fixation, no-till, conventional tillage.
INTRODUCTION
Dry/edible beans are among the crops most consumed throughout the world (Broughton et al., 2003). Brazil is the largest global producer and consumer of
common bean (Phaseolus vulgaris L.), which is the main source of protein and
an important source of carbohydrates for the population, especially farmers, who produce it as a subsistence crop. Small farmers are primarily responsible for the domestic supply of this crop so important to Brazil; however, because of advances in mechanization and irrigation, there are now large producers in the market, especially for the winter crop. However, the national average yield is still low,
approximately 1,058 kg ha-1
(Conab, 2015).
Common bean requires high levels of N, and the low availability of this nutrient in the soil, coupled with the short cycle and shallow roots of the plant, contribute to its low yield. One N source is decomposition of soil organic matter, originating either naturally or from previous cropping. However, organic matter storage in tropical soils is low and is not sufficient for crop requirements; thus, management practices are a more effective option. Arf et al. (1999) observed that treatments containing the crop residue of velvet
bean and lablab (2,407 and 2,149 kg ha-1
, respectively) showed higher grain yield values
compared to treatment with maize crop residue (1,189 kg ha-1
). Mineral fertilization (Andrade et al., 2001; Araújo et al., 2007) and biological N2 fixation (Raposeiras et al.,
2006; Soares et al., 2006; Ferreira et al., 2009) are solutions for N-deficiency in plants. However, inoculation is not always satisfactory, and the addition of mineral N may be required (Raposeiras et al., 2006; Pelegrin et al., 2009; Kaneko et al., 2010).
There are a few studies related to combined mineral N fertilization and inoculation with
N2-fixing bacteria in common bean, and most of them are in greenhouse conditions.
According to a study conducted by Tsai et al. (1993), small application rates of N (15 mg kg-1
)
at the beginning of the bean cycle, with average levels of fertility complementation in 3 kg pots of soil improve conditions for nodule formation. Brito et al. (2011), in experiments
using N15 in pots containing 5 kg of soil, showed that with a starting application rate
of 15 mg kg-1
of mineral N, biological N2 fixation was able to meet plant nutritional
requirements. According to Franco et al. (1979), topdressing with low application rates of mineral N fertilizer should be performed 25 to 30 days after sowing for improved biological nitrogen fixation (BNF). Therefore, technical and economic evaluation of research data are quite relevant in terms of maximization of fertilizer use efficiency, based on theoretical yield and cost (Freire et al., 2011).
Considering the diversity of climate and soil conditions, we hypothesized that variations commonly found in field results regarding the effects of inoculation can be reduced by joint application of inoculation and mineral N fertilization. The objective of this study was to verify the compatibility of nitrogen fertilization with biological N2 fixation to increase
common-bean yield, and to improve the economic viability of the common bean crop in Oxisols of different textures in the state of Minas Gerais, Brazil.
MATERIALS AND METHODS
Table 1. Sites, date, geographic coordinates, soil preparation, technological level and irrigation
system used in the experiments
Site(1)
Date Geographic coordinates,
altitude ST
(2)
TL(3)
IS(4)
Lavras (DBI) June/2009
winter/spring crop 21° 14’ S, 45° 00’ W, 920 m NTS NT4 Yes
Ijaci (Faepe) winter/spring cropJune/2009 21° 10’ S, 55° 30’ W, 832 m NTS NT4 Yes
Lavras (DAG) winter/spring cropJune/2010 18° 34’ S, 46° 31’ W, 833 m CTS NT3 Yes
Patos de Minas
(Epamig) winter/spring cropJune/2010 20° 00’ S, 45° 58’ W, 706 m CTS NT3 Yes
(1) DBI (Universidade Federal de Lavras, Departamento de Biologia); Faepe (Fundação de Apoio ao Ensino Pesquisa e Extensão de Ijaci); DAG (Universidade Federal de Lavras, Departamento de Agricultura); Epamig (Empresa de Pesquisa Agropecuária de Minas Gerais – Fazenda Sertãozinho). (2) ST: Soil Tillage: (NTS: No-till system; CTS: Conventional tillage system). (3) TL: Technological level (Ribeiro et al., 1999); NT1: liming, fertilization, seed collected, 220,000 to 240,000 plants ha-1, weeding up to 30 days after emergence; NT2: liming, fertilization, supervised seeds, 220,000 to 240,000 plants ha-1, phytosanitary control, seed treatment; NT3: NT2, herbicides, irrigation; NT4: NT3 with higher fertilizer application rates. (4) IS: Irrigation System.
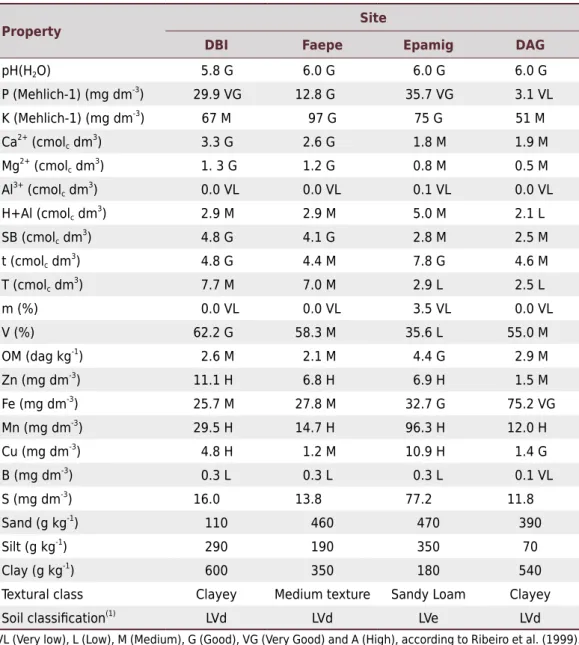
Table 2. Chemical and physical properties of soils samples (0.00-0.20 m layer), textural class,
and soil classification
Property Site
DBI Faepe Epamig DAG
pH(H2O) 5.8 G 6.0 G 6.0 G 6.0 G
P (Mehlich-1) (mg dm-3
) 29.9 VG 12.8 G 35.7 VG 3.1 VL
K (Mehlich-1) (mg dm-3
) 67 M 97 G 75 G 51 M
Ca2+ (cmolc dm
3
) 3.3 G 2.6 G 1.8 M 1.9 M
Mg2+ (cmol
c dm 3)
1. 3 G 1.2 G 0.8 M 0.5 M
Al3+ (cmol
c dm
3) 0.0 VL 0.0 VL 0.1 VL 0.0 VL
H+Al (cmolc dm
3) 2.9 M 2.9 M 5.0 M 2.1 L
SB (cmolc dm
3) 4.8 G 4.1 G 2.8 M 2.5 M
t (cmolc dm3) 4.8 G 4.4 M 7.8 G 4.6 M
T (cmolc dm
3
) 7.7 M 7.0 M 2.9 L 2.5 L
m (%) 0.0 VL 0.0 VL 3.5 VL 0.0 VL
V (%) 62.2 G 58.3 M 35.6 L 55.0 M
OM (dag kg-1) 2.6 M 2.1 M 4.4 G 2.9 M
Zn (mg dm-3) 11.1 H 6.8 H 6.9 H 1.5 M
Fe (mg dm-3) 25.7 M 27.8 M 32.7 G 75.2 VG
Mn (mg dm-3) 29.5 H 14.7 H 96.3 H 12.0 H
Cu (mg dm-3) 4.8 H 1.2 M 10.9 H 1.4 G
B (mg dm-3) 0.3 L 0.3 L 0.3 L 0.1 VL
S (mg dm-3) 16.0 13.8 77.2 11.8
Sand (g kg-1) 110 460 470 390
Silt (g kg-1) 290 190 350 70
Clay (g kg-1) 600 350 180 540
Textural class Clayey Medium texture Sandy Loam Clayey
Soil classification(1)
LVd LVd LVe LVd
conducted on the winter/spring 2010 crop: in Lavras (Universidade Federal de Lavras, Departamento de Agricultura/DAG) and Patos de Minas, in the Alto Paranaíba region on the Sertãozinho farm of the Empresa de Pesquisa Agropecuária de Minas Gerais (Agricultural Research Company – Minas Gerais/Epamig). The Patos de Minas climate, according to the Köppen classification system, is Cwa type with a humid high-altitude tropical climate with a hot dry summer and cold winter.
Rhizobia inoculation had not previously been used for the bean crop in any of the areas. Preceding crops were corn in DBI, common bean in DAG and Faepe, and wheat in Epamig. In DBI and Faepe, desiccation of the remaining foliage was performed with glyphosate
(Roundup®
) at a rate of 360 g L-1. The herbicide fluazifop-p-butyl + fomesafen (Robust®)
was then applied in post-emergence at 240 g L-1
ha-1
of a.i.
In Epamig and DAG, weed control was manually performed when necessary. In DAG, there was a moderate attack of Lagria villosa (Coleoptera), which was controlled with deltamethrin
(DECIS®
, 25 g L-1
ha-1
of a.i.), a pyrethroid insecticide, at 64 days post-emergence (DPE),
applied as a liquid mix at 222 L ha-1
. In the same location, bait was used to control leafcutter ants at 7 DPE. All experimental areas were irrigated; at Faepe, a center pivot was used, and in other areas, overhead irrigation was used.
Basic fertilization followed the recommendations of Ribeiro et al. (1999)for the common
bean crop. In DBI and Faepe, 400 kg ha-1
of the 0-28-10 formulation of N-P-K was applied.
In DAG and Epamig, 70 kg ha-1
of P2O5 and 20 kg ha -1
of K2O were applied as triple super
phosphate and potassium chloride, respectively.
The common bean cultivar BRSMG Majestoso was used, which has a carioca (beige
with brown stripes) grain type (30.6 g per 100 grains), a Type II/III growth habit, and an 87 days cycle; it is a cultivar officially recommended for the state of Minas Gerais
(Abreu et al., 2007).
The strain used for inoculation was Rhizobium tropici CIAT 899 (Graham et al., 1994),
approved by the Ministry of Agriculture, Livestock and Food Supply (MAPA) as an inoculant for the common bean crop. The inoculants were prepared at the soil microbiology laboratory of the Department of Soil Science – UFLA and were grown in sterilized liquid medium 79 (Fred and Waksman, 1928). After 48 h of growth, during the log phase, the material was transferred to an Erlenmeyer flask containing peat sterilized by autoclaving for 20 min. The resulting mixture (inoculant) had a 3:2 ratio (w:v) of peat: culture and was used as the base at 100 g per kg of seed. Inoculant quality was monitored through counting of colony-forming unit (CFU), given that the statutory minimum number of viable cells is
approximately 109
CFU of Rhizobium per gram of inoculant at sowing.
A randomized block experimental design was used with seven treatments and four replicates at DBI and Faepe and three replicates at DAG and Epamig. The treatments were: 1 – no mineral nitrogen (N) and no seed inoculation (Control); 2 – only seed inoculation (Inoc); 3 – only 20 kg ha-1
of N-urea at sowing (20S); 4 – Inoculation + 20 kg ha-1
of N-urea at sowing (Inoc + 20S); 5 –inoculation + 20 kg ha-1
of N-urea at sowing + 20 kg ha-1
of N-urea topdressing (Inoc + 20S + 20T); 6 – inoculation + 20 kg ha-1
of N-urea at sowing + 40 kg ha-1
of N-urea at topdressing (Inoc + 20S + 40T); and 7 – inoculation + 20 kg ha-1
of N-urea
at sowing + 60 kg ha-1
of N-urea at topdressing(Inoc + 20S + 60T). In the experiments
conducted at DBI and Faepe, topdressing was split two times in the case of treatment 6 (20 + 20 kg ha-1
of N-urea) and three times for treatment 7 (20 + 20 + 20 kg ha-1
of
N-urea), starting from the onset of the 1st trifoliate leaf pair and applied successively at intervals of 10 days. In the DAG experiment, the N topdressing in treatments 6 and 7 was split into two, and a single application was performed at Epamig.
Each experimental unit (12 m2
and 6 were considered borders, rows 2 and 3 were used for sampling at flowering, and rows 4 and 5 were used for harvest after maturation.
At full flowering (stage R6of the growth cycle), 10 plants were randomly collected from
each plot to assess the number of nodules (NN), nodule dry matter (NDM), shoot dry matter (SDM) and N accumulation per shoot (NAS). At harvest (stage R9), the grain yield (GY) and the primary components of production were determined, including pods per plant (PP), grains per pod (GPP), 100 grain weight (100 GW) and grain N accumulation (GNA). Grain yield (13 % moisture) was the result of the track pods of all plants in rows 4 and 5, and the components were determined at random in these 10 plants. The N content was determined by the Semimicro-Kjeldahl method, according to Sarruge and Haag (1979). Shoot N accumulation was calculated by multiplying the SDM by the N content and dividing by 100. The calculation of grain N accumulation (GNA) was performed in the same manner using grain yield and grain N content.
To meet the assumptions for analysis of variance, all data were tested for variance in normality and homogeneity using R software (R Development Core Team, 2012), and the
NN and GPP data were processed in (x+0.5)0.5
. The data were then subjected to analysis of variance for each crop using Sisvar software version 4.0 (Ferreira, 2011). The viability of combined analysis was measured by comparing the magnitude of the residual mean square of individual analysis as described in Banzatto and Kronka (2006). In cases of a significant treatment effect, grouping of means was conducted using the Scott-Knott test at 5 % probability.
Regression curves considering all treatments (except the Control and 20S treatment) allowed estimation of the N application rate to obtain the maximum yield expected at each site (Theory of Production). This evaluation did not consider a joint analysis of the 2009 crop experiments (DBI and Faepe) and was based on estimates of the following equations:
Y = a + b(N) + c(N)2
Eq. 1
Nmax = –b/2c Eq. 2
where Y is common bean commercial crop yield, kg ha-1
; N is total amount of mineral N applied; a, b, and c are parameters of the equation: c < 0; Nmax is N application rate corresponding to maximum yield.
In order to estimate the Rate of Return on Invested Capital (RR), cost theory was applied by calculating the difference between the monetary amount of production (MAP) and the costs of the N applied, inoculants, and tractor services. The cost (Cost) was calculated as the sum of fertilizer and inoculant expenditures and one tractor-hour for each treatment, which represents additional hours for topdressing applications at each experimental site. Thus, Rate of Return on Invested Capital can be calculated as follows:
RR = MAP – (COST) Eq. 3
MAP = Py × GY Eq. 4
COST = Pn × N + C Eq. 5
C = T + I Eq. 6
where RR is the Rate of Return on Invested Capital (R$); Py is the unit price of common bean
products according Agrolink (October 2009 = R$ 1.14 kg-1
; October 2010 = R$ 2.57 kg-1
),
Y is the bean production (kg); Pn is the unit price of N according "Instituto de Economia Agrícola" (October 2009 = R$ 2.75 kg-1
; October 2010 = R$ 2.71 kg-1
the mean rate of ‘Banco Central do Brasil’ in the period of the experiments, i.e., June
10th to September 10th, 2009 => 1 US$ = R$ 1.885 and June 10th to September 10th,
2010 => 1 US$ = R$ 1.77.
RESULTS
Winter/spring crop 2009
In analysis of variance of the data obtained at flowering, a significant treatment effect (T) was observed on SDM and NDM, and a site effect (S) was observed on SDM, NDM, and NAS. The T × S interaction was significant only for SDM.
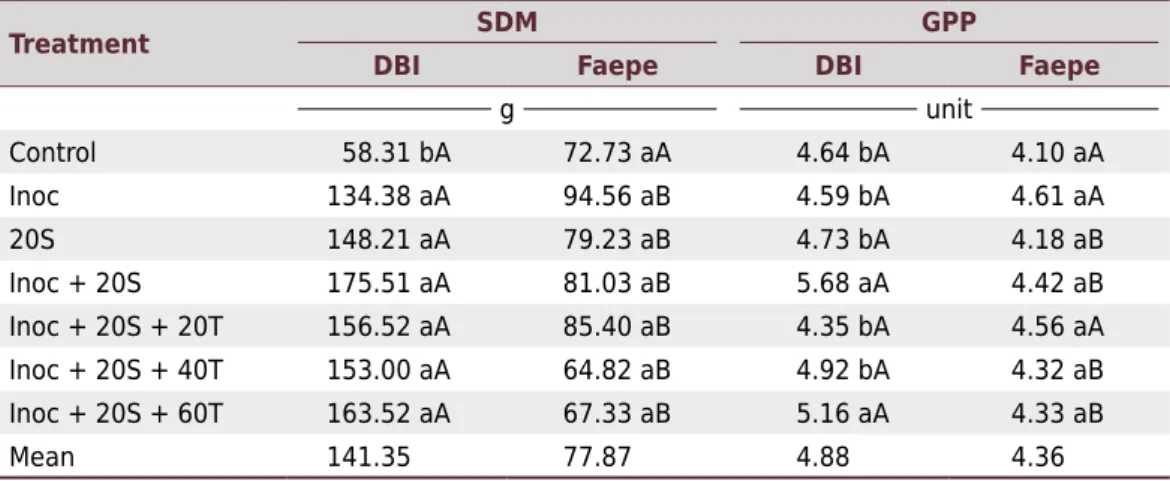
For the S × T interaction in relation to SDM, there was no difference among treatments at Faepe (Table 3), but at DBI, the SDM of the Control was inferior to the treatments that received N supplementation; the cultivation site did not interfere in the SDM of the Control, but among the other treatments, the highest values were obtained at DBI. Although the F-test was significant, there was no difference among treatments for NN (Table 4). With respect to NDM, the treatments that received mineral N topdressing (Inoc + 20S + 20T, Inoc + 20S + 40T and Inoc + 20S + 60T) showed the lowest means. In comparison of the sites, DBI exhibited higher average NDM and NAS (Table 4).
At maturity, the winter-spring 2009 crop all parameters were influenced by cultivation site (S), and only 100 GW was not affected by treatment (T). Only the S × T interaction, however, significantly influenced GPP.
In general, the highest PP, 100 GW, GPP, and GNA were observed at Faepe (Table 4). The 100 GW showed little variation and did not differ among the treatments. As for GY, the Control and Inoc treatments were statistically inferior to the others, followed by the 20S treatment, which represented an intermediate group. The highest yields occurred from treatments of the combined application of the inoculant and mineral N. Inoculation
followed by the application of 20 kg ha-1
of N-urea at sowing (Inoc + 20S) did not differ statistically from inoculation plus 20 kg ha-1
of N-urea at sowing and 60 kg ha-1
of N-urea in topdressing. Regarding the GNA variable, the treatments that received mineral N fertilization proved superior to the Control and Inoc.
The treatments differ in their levels of GPP, but this effect was influenced by the cultivation site (Table 3). The Inoc + 20S and Inoc + 20S + 60T treatments provided higher GPP at DBI, whereas no differences were observed at Faepe. The Control, Inoc,
Table 3. Mean values for shoot dry matter (SDM) and grains per pod (GPP) as a function of
cultivation site and treatments. DBI and Faepe, 2009
Means followed by the same letters, uppercase in the line and lowercase in the column, belong to the same group according to the Scott-Knott test at 5 % probability.
Treatment SDM GPP
DBI Faepe DBI Faepe
g unit
Control 58.31 bA 72.73 aA 4.64 bA 4.10 aA
Inoc 134.38 aA 94.56 aB 4.59 bA 4.61 aA
20S 148.21 aA 79.23 aB 4.73 bA 4.18 aB
Inoc + 20S 175.51 aA 81.03 aB 5.68 aA 4.42 aB
Inoc + 20S + 20T 156.52 aA 85.40 aB 4.35 bA 4.56 aA
Inoc + 20S + 40T 153.00 aA 64.82 aB 4.92 bA 4.32 aB
Inoc + 20S + 60T 163.52 aA 67.33 aB 5.16 aA 4.33 aB
and Inoc + 20S + 20T treatments resulted in similar means of GPP at both cultivation sites. In relation to other treatments (20S and Inoc + 20S + 40T), GPP in DBI had higher values.
Winter/spring crop 2010 at DAG
At DAG, there was a significant effect of the treatments on all flowering variables except the SDM. The Inoc and Inoc + 20S treatments showed higher NN and NDM, while the other treatments had averages that were equivalent to each other but lower than those for Inoc and Inoc + 20S (Table 4). With respect to NDM, the 20S treatment showed values
Table 4. Mean values for shoot dry matter (SDM), number of nodules (NN), nodule dry matter (NDM), nitrogen accumulation in shoots
(NAS), pods per plant (PP), grains per pod (GPP), hundred grain weight (100 GW), grain yield (GY), and grain nitrogen accumulation (GNA), with and without inoculation of common bean, with different nitrogen fertilization rates at DBI and Faepe in 2009, DAG in 2010, and Epamig in 2010 during the flowering period and harvest
Treatment SDM NN NDM NAS PP GPP 100 GW GY GNA
g g mg per plant g kg ha-1
DBI and Faepe (2009)
Control 65.52 295.25 1.05 a 419.07 9.06 b 4.37 20.75 1,587.42 c 51.51b
Inoc 114.47 327.37 1.12 a 661.70 10.00 b 4.60 21.13 1,564.82 c 52.92 b
20S 113.72 300.00 1.13 a 658.78 9.23 b 4.46 21.22 1,997.11 b 62.46 a
Inoc + 20S 128.27 174.75 1.00 a 667.75 11.01 b 5.05 21.73 2,220.60 a 68.30 a
Inoc + 20S + 20T 120.96 180.25 0.42 b 785.74 11.00 b 4.45 21.41 2,487.50 a 69.64 a
Inoc + 20S + 40T 108.91 203.00 0.70 b 704.23 14.15 a 4.62 21.14 2,463.50 a 69.14 a
Inoc + 20S + 60T 115.43 98.25 0.33 b 682.38 13.03 a 4.74 21.32 2,424.27 a 68.35 a
DBI 141.35 209.10 1.03 a 868.49 a 10.18 b 4.87 20.25 b 1,790.39 b 50.48 b
Faepe 77.87 245.68 0.61 b 439.98 b 11.95 a 4.36 22.23 a 2,422.53 a 75.90 a
Mean 109.61 227.39 0.82 654.24 11.07 2.36 21.24 2,106.46 63.19
CV (%) 23.54 36.94 17.52 34.81 22.23 3.67 5.31 15.05 24.18
DAG (2010)
Control 15.02 274.66 b 0.19 b 37.39 b 3.66 4.89 a 26.13 618.25 c 12.70
Inoc 23.22 649.00 a 0.66 a 48.45 b 5.96 3.20 b 25.40 603.78 c 8.57
20S 21.60 360.00 b 0.84 a 49.19 b 5.23 5.07 a 27.96 1,066.32 b 33.48
Inoc + 20S 28.00 432.33 a 0.87 a 49.50 b 5.00 3.99 b 25.16 1,543.21 a 37.45
Inoc + 20S + 20T 25.74 176.00 b 0.20 b 70.61 a 5.63 4.17 b 27.80 1,655.73 a 33.60
Inoc + 20S + 40T 20.14 157.00 b 0.17 b 63.62 a 5.80 4.65 a 24.03 1,697.27 a 29.09
Inoc + 20S + 60T 26.90 260.00 b 0.30 b 92.23 a 7.00 5.15 a 25.93 1,909.15 a 50.13
Mean 22.95 329.85 0.46 58.71 5.47 4.44 26.06 1,299.10 29.30
CV (%) 26.17 17.35 12.25 24.41 31.46 14.52 6.14 19.30 36.83
Epamig (2010)
Control 21.10 260.00 0.35 a 61.26 b 5.36 b 4.16 28.90 658.45 b 17.39 b
Inoc 20.89 122.00 0.36 a 59.57 b 6.46 b 4.10 26.43 873.16 b 27.00 b
20S 26.71 87.00 0.20 b 101.29 a 7.33 b 4.33 26.90 926.63 b 22.26 b
Inoc + 20S 29.25 103.33 0.12 b 91.20 a 9.03 a 4.36 27.83 1,567.98 a 44.74 a
Inoc + 20S + 20T 22.81 52.00 0.02 b 62.72 b 7.33 b 3.91 27.76 1,449.90 a 53.99 a
Inoc + 20S + 40T 29.29 151.00 0.07 b 107.81 a 7.13 b 3.73 28.53 1,490.54 a 56.39 a
Inoc + 20S + 60T 28.69 145.00 0.06 b 108.39 a 9.46 a 4.26 29.76 1,640.28 a 53.90 a
Mean 25.53 131.47 0.17 84.61 7.44 4.12 28.01 1,229.56 39.38
CV (%) 18.80 32.10 57.82 16.28 15.98 14.00 6.14 15.46 27.04
equivalent to Inoc and Inoc + 20S. When analyzing the NAS, the highest values were
observed for the Inoc + 20S + 20T, Inoc + 20S + 40T and Inoc + 20S + 60T treatments.
For the winter-spring 2010 crop at DAG at maturity, only GPP and GY were influenced by the treatments. The highest GPP values were found in the Control, 20S, Inoc + 20S + 40T, and Inoc + 20S + 60T treatments, which did not differ from each other. The inoculated treatments receiving N fertilizer at sowing and/or topdressing showed similar GY values that exceeded those of the Control and Inoc, which exhibited lower yield. The 20S treatment generated an intermediate GY (Table 4).
Winter/spring 2010 crop at Epamig
At the Epamig site at flowering, there was no treatment effect on SDM and NN. However, the treatments influenced NDM and NAS. With respect to NDM (Table 4) greater values were obtained in Control and Inoc. With respect to NAS, the 20S, Inoc + 20S, Inoc + 20S + 40T, and Inoc + 20S + 60T treatments showed higher values than the other treatments.
A treatment influence was observed on PP, GY, and GNA at maturity. The PP values showed that the Inoc + 20S and Inoc + 20S + 60T treatments had greater values than the other treatments. The GY and GNA variables showed the highest average for the treatments that received both inoculation and fertilization with N (Table 4).
Rates of return on invested capital
Winter/spring 2009 crop at DBI
At the DBI site in 2009, the regression model that best fit was ŷ = 1,259.06 + 37.88 x – 0.37 x2
;
R = 0.62. The maximum yield calculated by this equation was 2,228.58 kg ha-1
, which
was obtained with 51.18 kg ha-1
of N-urea. The treatment with the best rate of return on invested capital (US$ 4,371.16) was Inoc + 20S + 20T (Table 5). Therefore, this rate
of return was obtained with a lower N application rate (20S + 20 T = 40 kg N ha-1
) than
that where the maximum production was obtained by the equation: 51.18 kg ha-1
of
N-urea. This was influenced by cost increases due the application of higher amounts of N-urea (Table 5).
Winter/spring 2009 crop at Faepe
At the Faepe site in 2009, maximum production was 2,946.65 kg ha-1
and it was obtained
with the application rate of 67.63 kg ha-1
of N-urea calculated from the equation
ŷ = 1,940.23 + 29.76 x – 0.22 x2
; R = 0.63. However, the treatment representing highest rate of return on invested capital was Inoc + 20P + 40T, with the return of US$ 5,590.74 (Table 5), this return also came from a lower application rate than that where the maximum production obtained by the equation.
Winter/spring 2010 crop at DAG
At the DAG site in 2010, with the application rate of 66.03 kg ha-1
of N-urea,
maximum production was obtained (1,884.75 kg ha-1
), calculated by the equation:
ŷ = 710.00 + 35.62 x – 0.27 x2
; R = 0.66. Table 5 shows that treatment with the highest rate of return on invested capital – US$ 7,975.18 – was at the highest N application rate: Inoc + 20S + 60T.
Winter/spring 2010 crop at Epamig
Maximum production at Epamig in 2010 was 1,642.35 kg ha-1
, at an application rate of 64.34 kg ha-1
of N-urea. The equation representing this site was ŷ = 979.95 + 20.59 x – 0.16 x2
;
DISCUSSION
A significant effect on SDM from the treatments was only observed at DBI (Table 3). The Control in DBI was lower than in the other treatments, which shows that in the absence of N sources there is lower initial plant growth, with a reduction of more than 55 % in shoot matter compared to treatments that received only Inoc and/or mineral N. Studies of common bean related to inoculation with bacteria and mineral fertilizers have varied widely with respect to this parameter. Bassan et al. (2001), working with Pérola, and
Soares et al. (2006), with a Talismã cultivar in an Argissolo Vermelho Distrófico típico
Ultisol), found that inoculation treatments had higher SDM compared to treatments without inoculation and without mineral N. However, Pelegrin et al. (2009) studied a
Latossolo Vermelho Distroférrico (Oxisol) in Dourados, MS and Soratto et al. (2005) and
Table 5. Grain yield (GY), monetary amount of production (MAP), cost, and rate of return on
invested capital at DBI and Faepe in 2009, DAG in 2010, and Epamig in 2010 during the harvest
Treatment GY MAP Cost
Rate of return on invested
capital
kg ha-1 US$
Winter/spring 2009 crop at DBI
Control 1,433.17 3,079,74 113.10 2,966.64
Inoc 1,209.76 2,599,65 122.53 2,477.13
20S 1,725.65 3,708,25 216.70 3,491.55
Inoc + 20S 1,943.48 4,176,34 226.13 3,950.22
Inoc + 20S + 20T 2,240.21 4,813,99 442.83 4,371.16
Inoc + 20S + 40T 2,018.42 4,337,38 659.53 3,677.86
Inoc + 20S + 60T 1,962.06 4,216,27 876.23 3,340.05
Winter/spring 2009 crop at Faepe
Control 1,741.67 3,742.67 113.10 3,629.57
Inoc 2,268.59 4,874.97 122.53 4,752.45
20S 1,919.89 4,125.65 216.70 3,908.95
Inoc + 20S 2,497.74 5,367.39 226.13 5,141.27
Inoc + 20S + 20T 2,734.80 5,876.81 442.83 5,433.99
Inoc + 20S + 40T 2,908.59 6,250.27 659.53 5,590.74
Inoc + 20S + 60T 2,886.48 6,202.76 876.23 5,326.53
Winter/spring 2010 crop at DAG
Control 618.25 2,813.04 106.20 2,706.84
Inoc 1,066.32 4,851.76 115.05 4,736.71
20S 603.78 2,747.20 202.20 2,545.00
Inoc + 20S 1,543.21 7,021.61 211.05 6,810.56
Inoc + 20S + 20T 1,655.73 7,533.57 413.25 7,120.32
Inoc + 20S + 40T 1,697.27 7,722.58 509.25 7,213.33
Inoc + 20S + 60T 1,909.15 8,686.63 711.45 7,975.18
Winter/spring 2010 crop at Epamig
Control 658.45 2,995.95 106.20 2,889.75
Inoc 789.24 3,591.04 115.05 3,475.99
20S 873.16 3,972.88 202.20 3,770.68
Inoc + 20S 1,567.98 7,134.31 211.05 6,923.26
Inoc + 20S + 20T 1,449.90 6,597.05 413.25 6,183.80
Inoc + 20S + 40T 1,490.54 6,781.96 509.25 6,272.71
Farinelli et al. (2006) studied a Nitossolo Vermelho Distrófico in Botucatu, SP, all with the cv. Pérola, and they found no differences in SDM.
Excess mineral N in the soil reduces nodulation in plants due to a lack of stimulation related to a deficiency of this nutrient (Moreira, 2006). The present study shows that NN was not affected by the treatments studied at the DBI, Faepe, and Epamig sites (Table 4). At DAG, the Inoc and Inoc + 20S treatments showed higher nodulation, indicating that
inoculation was effective in forming nodules and that 20 kg ha-1
of N-urea at sowing favored root growth, probably increasing the points of infection in the roots (Table 4). The inhibitory effect of mineral N on the nodule is visible in NDM (Table 4) because this variable had reduced mean values with increased N-supply in topdressing. As observed in the experiments at the DBI and Faepe sites, the treatments that received topdressing showed decreased NDM in comparison with the other treatments, and this effect was more pronounced at Faepe. Similar results were observed at the other sites, although at DAG, the Control did not differ from the treatments with N-addition in topdressing; however, at Epamig, all treatments that received mineral fertilizer showed lower values. Nodulation inhibition by high N levels is well reported in the literature (Mostasso et al.,
2001; Soares et al., 2006; Ferreira et al., 2009).
Greater NAS was observed at the DBI site compared to Faepe (Table 4). N accumulation in this site may have been favored by the high organic matter content in the soil, which certainly provided N to the plants. At the DAG site, higher NAS values were achieved in the treatments that received mineral N in topdressing. However, at Epamig, the lowest N application rate in topdressing resulted in an NAS similar to what was obtained from the Control and Inoc treatments, which showed the lowest average values among those evaluated. At Epamig, the unexpected result may have come from the lower SDM value compared to the other treatments that received N because NAS is the result of multiplying SDM by the N content in the SDM. In general, the DBI site was superior at flowering for all variables (Table 4) compared to the Faepe site (Table 5), which was not maintained at grain maturity. The results for the DBI site may also be attributed to the effect of organic matter, where the greatest N amounts were available in the vegetative phase. These N levels allowed the plant to remain in the vegetative stage for a longer period, which is not always favorable for grain productions. For the primary yield components, there are differences among the treatments for some variables in some sites. Araújo et al. (2007) assert that these characteristics have high genetic heritability, but in some situations, no differences occur with various management types. However, improved nutritional status can increase these values. Andrade et al. (2001) assert that the mineral fertilization in topdressing resulted in a larger number of pods per plant, showing that N application at sowing additionally to topdressing, as well as inoculation additionally to N applied at topdressing resulted in higher values for PP compared to the treatments: inoculation only (Inoc) and the control (Control).
The treatments affected GY at all of the sites, and similar results were observed in GNA, except at DAG. The GY at the four sites under all treatments were higher than the national
average of 1,312 kg ha-1
in the winter crop (Conab, 2015), except in the Control and Inoc treatments at the DAG and Epamig sites. The highest grain production occurred at the DBI and Faepe sites, which adopted a technological level of 4 (Ribeiro et al., 1999). In general, all of the treatments that received mineral N and inoculation were in the
highest group and showed a savings of 60 kg ha-1
of N-urea. In the 2009 experimental
crop (DBI and Faepe), the Inoc + 20S treatment produced 2,220.60 kg ha-1
of grain,
similar to the Inoc + 20S + 60T treatment, which had a yield close to 2,424.27 kg ha-1
(Table 4). The same treatments produced 1,543.21 and 1,909.15 kg ha-1
at the DAG
site and 1,567.98 and 1,640.28 kg ha-1
Brito et al. (2011) found a beneficial effect when applying N at small application rates at sowing of common bean, observing higher values (for N content in plants at a rate of 15 mg kg-1
of soil). According to Franco and Döbereiner (1968) and Tsai et al. (1993), small application rates of N at the beginning of root growth increased the infection sites and, therefore promoted greater nodule formation. Such a benefit was evident in this study, as the treatments that received Inoc + 20S had higher NDM, except at the Epamig site, where the value for the Inoc + 20S treatment was also lower than Inoc and Control. Regarding GNA, the treatments differed at DBI, Faepe, and Epamig. At these sites, the inoculated treatments were superior to the others, and at DBI and Faepe, the 20S treatment was also superior to the Control and Inoc treatments, with greater GNA accumulation at the Faepe site. The GNA results show again that joint inoculation with 20 kg ha-1
of N-urea was beneficial to plants, and that increasing mineral N application by topdressing did not increase GNA. Thus, this showed the benefits of small N application rates as well as BNF. Brito et al. (2011) showed that the N supply to the plant is greater through BNF than through organic or mineral N. According to economic analysis of production, in the winter/spring 2009 crop at DBI, winter/spring 2009 crop at Faepe, and winter/spring 2010 crop at DAG, the highest rates of return on invested capital were obtained in the treatments with the highest yields. However, in the winter/spring 2010 crop at Epamig, the highest rate of return on invested capital was obtained in the Inoc + 20S treatment, which did not have the highest yield (Table 5). When maximum yield is compared to the rate of return on invested capital, N economy
was 11.18 kg ha-1
of N-urea in the winter/spring 2009 crop at DBI, 7.63 kg ha-1
of N-urea
in the winter/spring 2009 crop at Faepe, and 44.33 kg ha-1
of N-urea in the winter/spring 2010 crop at Epamig. A similar result was found by Pelegrin et al. (2009) at Dourados, MS, Brazil, in a Latossolo Vermelho Distroférrico (Oxisol), as net income from a treatment
of inoculation plus 20 kg ha-1
of N-urea did not differ from the treatment that received 160 kg ha-1
of N-urea. However, these authors only performed a joint inoculation with
mineral N application of 20 kg ha-1
of N-urea in this field experiment. They did not test
joint inoculation with application of N-urea above 20 kg ha-1
.
Our results showed that the combined inoculation with application of N-urea can contribute to greater profitability in common bean crops at all sites and that the optimal application rate of mineral N depends on the site. However, it was not possible to relate these effects to edaphic and climatic characteristics as well as to management. This can be explained because the profitability does not consider the statistical difference among treatments. The profitability just considers the absolute values of the treatments. On the other hand, treatments showed the same tendency when comparing statistically the grain yields.
CONCLUSIONS
The BRSMG Majestoso cultivar inoculated with the strain CIAT 899 and application of 20 kg ha-1
of N-urea at sowing shows grain yields that do not differ from treatments receiving up to 80 kg ha-1
of N-urea.
An increase in N application rates increases common bean vegetative growth but reduces nodulation.
Combining inoculation with application of N-urea can contribute to greater profitability in common bean crops at all sites. However, the optimal application rate depends on the site.
ACKNOWLEDGMENTS
REFERENCES
Abreu AFB, Ramalho MAP, Carneiro JES, Del Peloso MJ, Paula Júnior TJ, Faria LC, Melo LC, Barros EG, Moreira MA, Pereira Filho IA, Martins M, Santos JB, Rava CA, Costa JGC, Sartorat A. BRSMG Majestoso: another common bean cultivar of carioca grain type for the state of Minas Gerais. Crop Breed Appl Biotechnol. 2007;74:403-5. doi:10.12702/1984-7033.v07n04a13
Andrade MJB, Alvarenga PE, Silva R, Carvalho JG, Junqueira ADA. Resposta do feijoeiro às
adubações nitrogenada e molíbdica e à inoculação com Rhizobium tropici. Cienc Agrotec.
2001;25:934-40.
Araújo FF, Carmona FG, Tiritan CS, Creste JE. Fixação biológica de N2 no feijoeiro submetido a
dosagens de inoculante e tratamento químico na semente comparado à adubação nitrogenada. Acta Sci Agron. 2007;29:535-40.
Arf O, Silva LS, Buzetti S, Alves MC, Sá MA, Rodrigues RAF, Hernandez FBT. Efeito da rotação de culturas, adubação verde e nitrogenada sobre o rendimento do feijão. Pesq Agropec Bras. 1999;34:2029-36. doi:10.1590/S0100-204X1999001100008
Banzatto DA, Kronka SN. Experimentação agrícola. 4ª ed. Jaboticabal: FUNEP; 2006.
Bassan DAZ, Arf O, Buzetti S, Carvalho MAC, Santos NCBE, Sá ME. Seed inoculation, nitrogen and molybdenum application on a winter bean crop: production and physiological seed quality. Rev Bras Sementes. 2001;23;76-83.
Brito MMP, Muraoka T, Silva E. Contribution of nitrogen from biological nitrogen fixation, nitrogen fertilizer and soil nitrogen on the growth of the common bean and cowpea. Bragantia. 2011;70:206-15. doi:10.1590/S0006-87052011000100027
Broughton WJ, Hernandez G, Blair M, Beebe S, Gepts P, Vanderleyden J. Beans (Phaseolus
spp.) – model food legumes. Plant Soil. 2003;252:55-128. doi:10.1023/A:1024146710611 Companhia Nacional de Abastecimento – Conab. Acompanhamento da Safra Brasileira. Grãos. Safra 2014/2015. [internet]. Brasília, DF: 2015. Disponível em: http://www.conab.gov.br/ OlalaCMS/uploads/arquivos/15_07_09_08_59_32_boletim_graos_julho_2015.pdf.
Farinelli R, Lemos LB, Penario, FG, Egéa MM, Gasparoto MG. Nitrogen topdressing in common bean in no tillage and conventional tillage system. Pesq Agropec Bras. 2006;41:307-12. doi:10.1590/S0100-204X2006000200016
Ferreira DF. SISVAR: a program for statistical analysis and teaching. Cienc Agrotec. 2011;35:1039-42. doi:10.1590/S1413-70542011000600001
Ferreira PAA, Silva MAP, Cassetari A, Rufini M, Moreira FMS, Andrade MJB. Inoculation with rhizobium strains in beans crop. Cienc Rural. 2009;39:2210-2. doi:10.1590/S0103-84782009000700041
Franco AA, Döbereiner J. Interference of calcium and nitrogen in simbiotic nitrogen fixation of
two bean varieties (Phaseolus vulgaris L.). Pesq Agropec Bras. 1968;3:223-7.
Franco AA, Pereira JC, Neyra CA. Seasonal patterns of nitrate reductase and nitrogenase
activities in Phaseolus vulgaris L. Plant Physiol. 1979;63:421-4. doi:10.1104/pp.63.3.421
Fred EB, Waksman SA. Laboratory manual of general microbiology: with special reference to the microorganisms of the soil. New York: McGraw-Hill; 1928.
Freire AH, Reis RP, Fontes RE, Veiga RD. Economic efficiency of coffee in the south of Minas Gerais: one application of production frontier. Coffee Sci. 2011;6:172-83.
Graham PH, Draeger K, Ferrey ML, Conroy MJ, Hammer BE, Martinez E, Naarons SR, Quinto
C. Acid pH tolerance in strains of Rhizobium and Bradyrhizobium, and initial studies on the
basis for acid tolerance of Rhizobium tropici UMR1899. Can J Microbiol. 1994;40:198-207.
doi:10.1139/m94-033
Moreira FMS. Nitrogen-fixing Leguminosae-nodulating bacteria. In: Moreira, FMS, Siqueira JO,
Brussaard L, editors. Soil biodiversity in Amazonian and other Brazilian ecosystems. 3rd ed.
Wallingford: CAB International; 2006. p.237-70.
Mostasso L, Mostasso FL, Dias BG, Vargas MAT, Hungria M. Selection of bean (Phaseolus
vulgaris L.) rhizobial strains for the Brazilian Cerrados. Field Crops Res. 2001;73:121-32.
doi:10.1016/S0378-4290(01)00186-1
Pelegrin R, Mercante FM, Otsubo IMN, Otsubo AA. Response of common bean crop to nitrogen fertilization and rhizobium inoculation. Rev Bras Cienc Solo. 2009;33:219-26. doi:10.1590/S0100-06832009000100023
R Development Core Team. R: A language and environment for statistical computing. R Foundation for Statistical Computing. Vienna: 2012. [Accessed on: 11 Aug. 2015]. Available at: http://www.R-project.org/.
Raposeiras R, Marriel IE, Muzzi MRS, Paiva E, Pereira FIA, Carvalhais LC, Passos RVM, Pinto PP, Sá NMH. Rhizobium strains competitiveness on bean nodulation in Cerrado soils. Pesq Agropec Bras. 2006;41:439-47. doi:10.1590/S0100-204X2006000300010
Ribeiro AC, Guimarães PTG, Alvarez V HV, editores. Recomendações para uso de corretivos e fertilizantes em Minas Gerais. 5ª Aproximação. Viçosa, MG: Comissão de Fertilidade do Solo do Estado de Minas Gerais; 1999.
Sarruge JR, Haag HP. Análises químicas em plantas. Piracicaba: Escola Superior Agricultura Luiz de Queiroz; 1979.
Soares ALL, Pereira JPAR, Ferreira PAA, Vale HMM, Lima AS, Andrade MJB, Moreira FMS. Agronomic efficiency of selected rhizobia strains and diversity of native nodulating populations in Perdões (MG – Brazil). II – Beans. Rev Bras Cienc Solo. 2006;30:803-11. doi:10.1590/S0100-06832006000500006
Soratto RP, Crusciol CAC, Silva LM, Lemos LB. Late nitrogen application on common bean in no-tillage system. Bragantia. 2005;64:211-8. doi:10.1590/S0006-87052005000200007