NITROGEN FIXATION AND GROWTH RESPONSE OF
Alnus Rubra
FOLLOWING FERTILIZATION WITH
UREA OR BIOSOLIDS
Linda S. Gaulke1*; Charles L. Henry2; Sally L. Brown3
1
Civil and Environmental Engineering, University of Washington 333 More Hall/Box 352700 Seattle, WA 98195-2700 - USA.
2
Interdisciplinary Arts and Sciences, University of Washington, Bothell Campus - USA.
3
College of Forest Resources, University of Washington - Box 352100 - Seattle, WA - 98195 - USA. *Corresponding author < [email protected]>
ABSTRACT: Nitrogen fertilization of forests using biosolids offers a potentially environmentally friendly means to accelerate tree growth. This field study was designed to analyze the effects of nitrogen fertilization on the symbiotic, nitrogen (N)-fixing relationship between Alnus rubra Bong. (red alder) and
Frankia. Anaerobically digested, class B biosolids and synthetic urea (46% N) were applied at rates of
140, 280 and 560 kg ha-1
available N to a well-drained, sandy, glacial outwash soil in the Indianola series (mixed, mesic Dystric Xeropsamments). Plots were planted with A. rubra seedlings. At the end of each of two growing seasons trees were harvested and analyzed for the rate of N fixation (as acetylene reduction activity), biomass and foliar N. At year 1, there was no N fixation for trees grown with urea amendments, but control (17 µmol C2H4 g-1 hr-1) and biosolids (26-45 µmol C2H4 g-1 hr-1) trees were fixing
N. At the end of year 2, all trees in all treatments were fixing N (7 µmol C2H4 g-1 hr-1, 4-16 µmol C2H4 g-1
hr-1
, and 20-29 µmol C2H4 g-1 hr-1 for control, urea and biosolids respectively). Trees grown with
biosolids amendments were larger overall (year 1 shoot biomass 10 g, 5 g, and 23 g for control, urea, and biosolids respectively, year 2 shoot biomass 50 g, 51 g, and 190 g for control, urea, and biosolids respectively) with higher concentrations of foliar N for both years of the study (year 1 foliar N 26 g kg-1,
27 g kg-1, and 40 g kg-1 for control, urea, and biosolids respectively, year 2 foliar N 17 g kg-1, 19 g kg-1, and
23 g kg-1
for control, urea, and biosolids respectively). Trees grown with urea amendments appeared to use the urea N over Frankia supplied N, whereas the biosolids trees appeared to be able to use both N
in biosolids and N from Frankia. The results from this study indicated that the greater growth of A.
rubra may have been responsible for the observed higher N demand. Biosolids may have supplied other
nutrients to the trees to support this accelerated growth. Key words: Frankia, acetylene reduction activity (ARA)
FIXAÇÃO DE NITROGÊNIO E CRESCIMENTO DE
Alnus Rubra
FERTILIZADO COM URÉIA OU BIOSÓLIDOS
RESUMO: A fertilização nitrogenada de florestas com biosólidos constitui um meio de aceleração do crescimento das plantas potencialmente não impactante ao meio. Os efeitos de fertilização de nitrogênio atmosférico na relação simbiôntica e de fixação de nitrogênio Alnus rubra Bong. (amieiro vermelho) e
Frankia foram avaliados em um estudo de campo. Biosólidos classe B digeridos anaerobicamente e
uréia sintética (46% N) foram aplicados a taxas de 140, 280 e 560 kg ha-1 de N disponível em um solo tipo
Areia Quartzosa. Ao contrário das plantas do grupo controle (17 µmol C2H4 g-1 hr-1) ou fertilizadas com
biosólidos (26-45 µmol C2H4 g-1 hr-1), plantas fertilizadas com uréia não apresentavam fixação de nitrogênio
após um ano de cultivo. Ao final do segundo ano, todas as árvores em todos os tratamentos fixavam N (7 µmol C2H4 g-1 hr-1; 4-16 µmol C2H4 g-1 hr-1; e 20-29 µmol C2H4 g-1 hr-1 para controle, uréia e biosólidos,
respectivamente). Plantas cultivadas sob remediação com biosólidos apresentaram maior biomassa na parte aérea ao final do ano 2 (50 g; 51 g; e 190 g para controle, uréia, e biosólidos, respectivamente), e também maiores concentrações de nitrogênio foliar em ambos os períodos analisados (N foliar no ano 1 – 26 g kg-1, 27 g kg-1, e 40 g kg-1; N foliar no ano 2 – 17 g kg-1, 19 g kg-1, and 23 g kg-1, respectivamente
para controle, uréia e biosólidos). A maior taxa de crescimento de A. rubra pode ter resultado em maior exigência em N e os biosólidos supriram quantidades adicionais de nutrientes capazes de sustentar o crescimento acelerado.
INTRODUCTION
Traditionally, commercial forestry has been managed without consideration of potential impacts on forest ecosystems. One example of this is the im-pact of forest nitrogen (N) fertilization, with synthetic fertilizers or municipal biosolids, on the atmospheric N fixation in forests. Alnus rubra is an important
hardwood in forests on the Pacific Coast of North America and is frequently found in Pseudotsuga menziesii (Douglas fir) plantations. A. rubra forms a
symbiotic N fixing relationship with Frankia which
complicates the determination of appropriate rates of synthetic N or biosolids N to maximize growth while simultaneously preventing environmental contamina-tion (Henry et al., 2000).
It is difficult to predict how A. rubra will
re-act to the addition of N from biosolids, as there has been scant research on fertilization of Alnus sp. with
N. For other plant species that form symbiotic N fix-ing relationships, the addition of N fertilizer has been shown to slow or stop N fixation rates (Voison et al., 2002), which then increase upon the subsequent re-moval of the N source (Fujikake et al., 2002). Avail-able N can also reduce nodule frequency and size (Daimon & Yoshioka, 2001). There have been stud-ies illustrating similar effects with Alnus (Côté &
Dawson, 1989; Martin et al., 2003). However, there is also the potential that Alnus would utilize both
sym-biotic and added sources of N if plant demand for N was sufficiently strong (Troelstra et al., 1992). Biosolids soil amendments have increased growth and nodulation of Vicia sativa (Vetch) (Sidiras et al.,
1999), and Glycine max (soybeans) (Vieira, 2001).In
studies looking at Alnus, N additions as NO3-, NH4+,
and NH4NO3 increased biomass of A. glutinosa
(Troelstra et al., 1992), and N additions did not re-duce N fixation in A. incana unless the system N
de-mand was exceeded (Rytter et al., 1991).
This study was conducted to evaluate what the effect of N from urea and biosolids would be on the symbiotic N fixing relationship of Alnus-Frankia, and if increased growth yields would result from these N additions.
MATERIALS AND METHODS
Study Site Description
This study was conducted at a research for-est in Eatonville, Washington, US (47º37’N, 122º19’W) at the base of the Cascade Mountain foothills. Aver-age annual rainfall is 1200 mm, with the rainfall from July and August typically being less than 120 mm (Pack Forest precipitation records). The study site is 317 m
above sea level. The soil is a well-drained, sandy, gla-cial outwash soil in the Indianola series (mixed, mesic Dystric Xeropsamments) (NRCS, 2004).
Study Installation
Prior to installation in February 2002 the site was densely vegetated with Cytisus scoparius (Scotch
Broom) and A. rubra. The area was cleared of
veg-etation and the soil was disked to break up any remain-ing roots for removal. Nitrogen was provided in two forms; synthetic urea [46% N (CO(NH2)2)] (urea), and class B, anaerobically digested biosolids with available and total N content of 14 g NH3 kg-1 and 63 g N kg-1,
respectively (King County Environmental Laboratory, March 2002). A control treatment was also included in the experimental design.
Biosolids application rates were calculated based on the method used by King County for their biosolids forest application sites (Henry et al., 1999). This method considers N uptake by trees and under-story, soil immobilization and potential for volatiliza-tion. For this site consideration of these factors resulted in a biosolids application of 13.4 Mg ha-1 which
pro-vided 140 kg ha-1 available N. In comparison,
recom-mended available N rates for the first two years growth of hybrid cottonwood (Populus L.; do not fix N) are
195 kg ha-1 (Henry et al., 1999). In addition to the rate
calculated to meet the N needs of the stand, biosolids and urea were added at 2x and 4x this amount. The study was designed as a randomized complete block with three replicates. Plots were each 2 m × 2 m.
There was a 1 m space between adjoining plots as well as a 3 m work row between each block. The closest distance between trees in adjoining plots was 2 m.
Amendments were applied evenly to the sur-face of each plot and then rototilled to a depth of 15-20 cm. Nine bare-root A. rubra Bong. seedlings,
40-50 cm in height, were planted in each plot evenly spaced in a square grid pattern, with a 0.5 m buffer between the outermost trees and the edge of the plot. There were 27 trees planted for each treatment (9 per plot× 3 plots per treatment). The seedlings were
ob-tained from a local nursery and had been grown from seed stock from lowlands in Whatcom and Skagit counties. At the time of planting, the whips had sparse and small nodules and no leaves.
Maintenance
To eliminate any additional competition for soil available N weeds within each plot area were killed by direct application of glyphosate herbicide to foliage with a wick applicator. The area surrounding plots was mowed to discourage additional weeds. Deer brows-ing of A. rubra foliage was initially controlled by
link fence was built surrounding the entire study and this eliminated access for deer. After the first grow-ing season, plots were thinned so that a maximum of 4 trees remained in each plot. This was done to re-duce competition between trees as they grew.
Soil/Biosolids Sampling
Soil samples were collected prior to amend-ment application, as well as during tree harvest in Sep-tember 2002 and August 2003. Soil samples were col-lected with a stainless steel probe (2.5 cm diameter) in the 0-15 cm depth range. Three samples were taken from each plot and homogenized. Samples were kept on ice or refrigerated until return to the laboratory when the available N analysis was performed using field moist samples that were sieved to <2 mm; all other analyses were conducted using air-dried samples that had been sieved to <2 mm. Prior to installation total carbon (C) and N were determined by combustion and total phosphorus (P) was determined by soil acid–per-oxide digestion method for sediments, sludges, and soils (USEPA, 1986) on a per plot basis. Average C content of soils prior to amendment addition was 2 ± 0.3 g kg-1. Total N content was 0.1± 0.001 g kg-1 with
total P equal to 428 ± 25 mg kg-1.
Available Nitrogen and phosphorus
Potassium chloride (KCl) extraction was used to determine available N (NO2-, NO
3
- and NH 4
+)
(Keeney & Nelson, 1982; Robertson et al., 1999). Five grams of soil were placed in a glass flask with 50 mL 2 M KCl. The flasks were placed on a shaker for one hour, left to settle, and then filtered through Whatman No. 41 filter paper. The solution was analyzed with a Lachat flow injection analyzer using QuickChem method 107-04-1-B for NO3-/NO
2
-, and
10-107-06-1-F for NH4+. Ammonium nitrate (NH
4NO3) solution
stan-dards were used to calibrate for solution concentra-tions of NO3- and NH
4
+ from 0 to 1000
µg L-1
(cali-bration curve coefficient = 0.99). Soil water content data were used to correct for percent moisture of field moist samples.
Available P was determined using the Bray method (Kuo, 1996). Twenty mLs of dilute acid solu-tion were added to 1 g of air dried soil. The mixture was shaken for 2 minutes and then filtered through Whatman No. 40 filter paper. Total P in the extracts was determined on a Lachat flow injection analyzer.
pH
Soils slurries were mixed 1:1 on a volume ba-sis with deionized water and air-dried soil samples and then left to stabilize. The pH was measured after one hour with an Orion pH meter (Bremner, 1996; Nelson & Sommers, 1996).
Total Carbon and Nitrogen
Soil samples were ground with a mortar and pestle and placed into foil packages on a CAHN C-33 microbalance. Total C and N were determined using a CE-440 elemental analyzer, at 980ºC (Bremner, 1996; Nelson & Sommers, 1996). National Institute of Stan-dards and Technology (NIST) stanStan-dards “Montana soil” and “sludge standard”, along with acetanilide and benzoic acid as internal standards, were routinely in-cluded in analysis. Respective rates of recovery for standards were; 0.89-0.96 (C, Montana soil), 0.95-1.06 (N, sludge standard), 0.94-1.01 (C, acetanilide), 0.94-0.96 (N, acetanilide), 0.98 (C, benzoic acid). To-tal C and N were reported as % based on a dry weight basis, and the C:N ratio as weight:weight.
Nitrogen Fixation
There are advantages and deficiencies to ev-ery method for measurement of symbiotic N fixation. Methods reported in the literature include 15N isotope dilution (Busse, 2000), 15N natural abundance (Shearer et al., 1983), 15N incorporation (McNeill et al., 1997), N accretion (Rothe et al., 2002), and acetylene reduc-tion activity (ARA) (Hardy et al., 1973). As the goal of this study was to evaluate the impact of treatments onFrankia, and not to determine cumulative amounts
of N fixation, ARA was selected as the most conve-nient method of analysis (Myrold et al., 1999). ARA has been shown to be a sensitive method for compari-son of relative rates of N fixation (Weaver & Danso, 1994). Other methods such as isotope dilution are com-plicated by the need for a non-fixing reference plant that has similar growth patterns to the unique, rapid growth habits of Alnus spp. (Busse, 2000). In situ
methods (e.g. split-root systems, cuvettes) are more readily carried out in the laboratory and are not nec-essarily appropriate for field studies. For this study, foliar N was used in addition to ARA to evaluate the nitrogen balance between control and fertilized treat-ments.
Relative rates of N fixation were measured as ARA and reported as micromoles C2H4produced per gram of nodule used in the assay (dry weight basis) per hour (µmol C2H4g-1 h-1) as described in Hardy et
al. (1973). Two trees from each plot were harvested for analyses during the first week of September in 2002, and the last week of August in 2003. The val-ues from both trees were averaged and treated as a single sample for statistical analysis. This time of year was selected for tree harvesting to allow for a reason-ably complete growing season for comparison of bio-mass. In addition, it was determined based on reported midday observations of A. rubra ARA in July (34.9
Janu-ary (0.1 µmol g-1 hr-1) (Teklehaimanot & Martin, 1999)
that ARA would be sufficiently high at this time. Rep-licate blocks were analyzed on consecutive days at the same time of the day to account for diurnal variations. Tree roots were dug up with a garden fork and soil was lightly brushed off. A random selection of nod-ules was removed from roots with a razor knife, keep-ing a portion of the root intact to ensure that damage did not occur to nodules, and placed into a 65 mL glass vial, which was then sealed with rubber septa. 6.5 mL air was removed from the vial and then 6.5 mL acety-lene (C2H2) was added (10% by volume), and the head space was mixed well. Positive controls (nodules, no C2H2) and negative controls (C2H2, no nodules) were included. The reaction was left to run for three hours in the dark and then a 3ml sample was taken from each vial and stored in a vacutainer for transport to the labo-ratory. Samples were analyzed for ethylene (C2H4) on a SRI 8610C gas chromatograph (GC) with a 60 m ×
0.53 Supelco capillary column, using manual injection with nitrogen as the carrier gas (Hardy et al., 1973; Myrold et al., 1999; Weaver & Danso, 1994). Detec-tion limits for this analysis, taking diluDetec-tion into account, were 1.5 µmol g hr-1. Soil moisture and temperature
were also determined for each plot at the time of ARA sampling to account for potential variability.
Biomass
Whole trees were harvested for biomass de-termination. Shoots and roots were separated at the soil line for root and shoot biomass measurements in 2002. All nodules were brushed to remove soil and re-moved from roots for separate biomass measurements. Although multiple plants were harvested per plot, the biomass measures of the plants were averaged and a single average value was used for statistical analysis. Plants were oven-dried for 72 hours at 70ºC. Biom-ass was reported as dry weight in grams. Two trees were harvested from each plot the first year of the study. For the second year only shoots were harvested as dry cemented soil conditions made it difficult to accurately collect the entire root and nodule system for determination of total biomass. Mean ± standard deviation is reported in the text.
Total Foliar Nitrogen
Three leaves were randomly selected from each tree to comprise one composite sample for both trees collected from each plot. Samples were oven-dried, ground and then analyzed for total N on a CE-440 elemental analyzer as described for soils (Bremner, 1996; Nelson & Sommers, 1996). NIST plant stan-dards as well as acetanilide and benzoic acid as inter-nal standards were included in ainter-nalysis. Respective rates of recovery for standards were; 0.96-1.01 (N,
citrus leaves), 0.94-1.01 (C, acetanilide), 0.94-0.96 (N, acetanilide), 0.98 (C, benzoic acid). Mean ± standard deviation is reported in the text.
Statistical Analysis
Statistical analyses were performed using SPSS 12 for Windows (SPSS Inc, 2003). Data was checked for normality by visual inspection and con-firmed using Kolmogorov-Smirnov tests. Analysis of variance (ANOVA) was used to test for main effects of treatment and treatment versus rate interactions. There was a small block effect for both foliar N and total soil C the first year and no significant block ef-fects for the second year of the study. There were no block versus treatment interactions for either year. Means were separated using Duncan’s multiple range test (P= 0.05). Linear regression was used to
evalu-ate relationships between treatment revalu-ate and measured properties, and correlation was evaluated among mea-sured properties (P = 0.05).
RESULTS AND DISCUSSION
Soil Properties
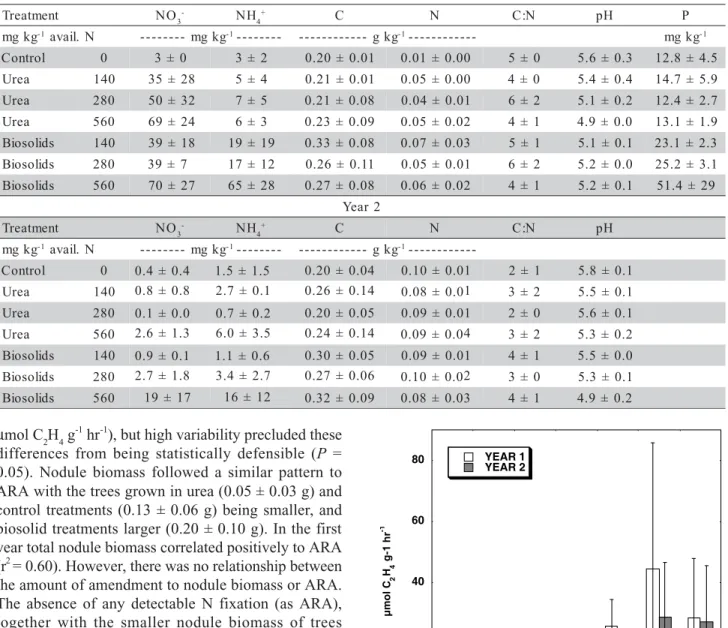
At the end of the first growing season (Table 1) both urea and biosolids treatments had higher lev-els of available N than the control. NO3-
concentra-tions were similar for biosolids and urea for each treat-ment, with soil NH4+ concentrations overall being lower
for urea than biosolids. As expected, almost the entire N from urea application was in the form of plant avail-able N (PAN) for the first year of the study and had dissipated by the second year. There was a slight de-crease in the C:N ratio for almost every treatment from the first to the second year. The first year soil pH val-ues for urea and biosolid treatments were both lower than that of the control, while in the second year the biosolids pH was lower than both the control and urea. The lowest pH was in the year 2 biosolids 560 kg ha-1
treatment (pH = 4.9) as compared to the highest in the year 2 control (pH=5.8). Plant available P was higher in all of the biosolids treatments than in the con-trol or urea treatments. This is to be expected as biosolids contain high levels of P in addition to N. The extractable P in the biosolid amended soils are con-sidered optimal for plant growth, whereas the P in the urea and control soils were below optimal levels, po-tentially indicating deficiency (SERA-IEG 17, 2000).
Nitrogen fixation and nodule biomass
At the time of the first year tree harvest, N fixation activity as ARA was below detection limits for all trees grown with urea amendments (Figure 1). Rates of ARA for trees grown in biosolid treatments (26-45
µmol C2H4 g-1 hr-1), but high variability precluded these
differences from being statistically defensible (P =
0.05). Nodule biomass followed a similar pattern to ARA with the trees grown in urea (0.05 ± 0.03 g) and control treatments (0.13 ± 0.06 g) being smaller, and biosolid treatments larger (0.20 ± 0.10 g). In the first year total nodule biomass correlated positively to ARA (r2= 0.60). However, there was no relationship between
the amount of amendment to nodule biomass or ARA. The absence of any detectable N fixation (as ARA), together with the smaller nodule biomass of trees grown in urea amended soils, was most likely a result of available N in the soil inhibiting N fixation and nodu-lation. This effect has been well documented for Alnus
species (Huss-Danell et al., 2001; Martin et al., 2003; Wall et al., 2000).
At the time of the second year tree harvest, when N had dissipated from the urea treatments, rates of N fixation in the urea treatments increased to 4-16
µmol C2H4 g-1 hr-1. ARA for control trees was 7 µmol
C2H4 g-1 hr-1 and biosolids 20-29
µmol C2H4 g-1 hr-1.
Differences between type of treatments were not sta-tistically different (P = 0.05), but ARA activity in the
urea amendments increased proportionally with the amount of treatment applied in the first year (r2= 0.70,
P = 0.05). Where ARA was inhibited the first year for
the urea trees, the second year trees were fixing N at rates similar to the control soils. ARA for trees grown Table 1 - Mean ± standard deviation for soil NO3-, NH
4
+, total C, N, and C:N by treatment type and rate for both years.
Biosolids were applied at rates to provide equivalent available N as the Urea.
1 r a e Y t n e m t a e r
T NO3- NH
4
+ C N C:N pH P
g k g
m -1avail.N -------- mgkg-1-------- ------------ gkg-1------------ mgkg-1
l o r t n o
C 0 3± 0 3± 2 0.20± 0.01 0.01± 0.00 5± 0 5.6± 0.3 12.8± 4.5
a e r
U 140 35± 28 5± 4 0.21± 0.01 0.05± 0.00 4± 0 5.4± 0.4 14.7± 5.9
a e r
U 280 50± 32 7± 5 0.21± 0.08 0.04± 0.01 6± 2 5.1± 0.2 12.4± 2.7
a e r
U 560 69± 24 6± 3 0.23± 0.09 0.05± 0.02 4± 1 4.9 ± 0.0 13.1± 1.9
s d i l o s o i
B 140 39± 18 19± 19 0.33± 0.08 0.07± 0.03 5 ± 1 5.1± 0.1 23.1 ± 2.3
s d i l o s o i
B 280 39± 7 17± 12 0.26± 0.11 0.05± 0.01 6± 2 5.2± 0.0 25.2± 3.1
s d i l o s o i
B 560 70± 27 65± 28 0.27± 0.08 0.06± 0.02 4± 1 5.2± 0.1 51.4 ± 29
2 r a e Y t n e m t a e r
T NO3- NH
4
+ C N C:N pH
g k g
m -1avail.N -------- mgkg-1-------- ------------ gkg-1-----------
-l o r t n o
C 0 0.4± 0.4 1.5± 1.5 0.20± 0.04 0.10± 0.01 2 ± 1 5.8± 0.1
a e r
U 280 0.1± 0.0 0.7± 0.2 0.20± 0.05 0.09± 0.01 2± 0 5.6± 0.1
s d i l o s o i
B 140 0.9± 0.1 1.1± 0.6 0.30± 0.05 0.09± 0.01 4± 1 5.5± 0.0
s d i l o s o i
B 560 19± 17 16± 12 0.32± 0.09 0.08± 0.03 4± 1 4.9 ± 0.2
Figure 1 - Nitrogen fixation by Frankia as measured by acetylene
reduction activity (ARA) for Alnus rubra fertilized
with urea or municipal biosolids applied to provide one, two or four times the estimated N demand. Data, means and standard deviation are shown for both years. 0 20 40 60 80 C ont rol 1X U rea 2X U rea 4X U rea 1 X B ios ol ids 2 X B ios ol ids 4 X B ios ol ids YEAR 1 YEAR 2 µmol C 2 H4 g-1 hr -1
in the biosolid treatments were not inhibited by avail-able N in either year of the study. This was the case even though the biosolids and urea amendments were designed to provide the same amounts of available N. These results can potentially be explained by
consid-a e r
U 140 0.8± 0.8 2.7± 0.1 0.26± 0.14 0.08± 0.01 3± 2 5.5± 0.1
a e r
U 560 2.6± 1.3 6.0± 3.5 0.24± 0.14 0.09± 0.04 3± 2 5.3± 0.2
s d i l o s o i
ering the other nutrients included in the biosolids. In particular, N, P and the ratio between them have been found to increase nodulation and N fixation in actinorhizal species. Studies growing actinorhizal spe-cies in solution have found N to be an inhibiter and P a promoter of nodule growth (Wall et al., 2000). In addition, at low P concentrations such as those ob-served in the control and urea treatments, soil N in-hibits nodule size and number, but at high P concen-trations N stimulates nodule growth (Gentili & Huss-Danell, 2003; Huss-Danell et al., 2001). In a field study on the Tanana River floodplain N fixation of A. tenuifolia was found to be P limited at total P
con-centrations of 79 g m-2 (depth of 20 cm) (Uliassi &
Ruess, 2002). Phosphorus fertilization increased nod-ule biomass and resulted in a 138% increase in A. tenuifoliaN fixation. Based on the N fixation observed in the biosolid treatments, our results suggest that the P in the biosolids was a factor in increasing N fixa-tion.
Shoot biomass
The average shoot biomass at the time of the first years sampling were 5 ± 2 g for trees grown in urea and 10 ± 8 g for the control trees, with the biosolids trees being larger 23 ± 11 g than the urea and control trees (Figure 2). There was a weak cor-relation between total biomass and rates of ARA (r2=
0.49). At the second year harvest the differences in shoot biomass between trees grown in the biosolids amended soils and the other treatments were again very pronounced, with the control and urea treatments
be-ing smaller (190 ± 45 g biosolids, 50 ± 14 g control and 51 ± 38 g urea). No correlation was seen between shoot biomass and ARA, although in other studies A. rubra biomass has frequently been seen to correlate
to ARA (Monaco et al., 1982; Rojas et al., 2002). Shoot biomass decreased with increasing amount of urea amendment, while shoot biomass of trees grown with biosolids amendments were 2 to 5 times larger than control and urea treatments. Ob-served yield increases were similar across all rates of biosolid additions. Total P in the biosolids used in this study was 26.7 g kg-1and plant available P in all
biosolid treatments was greater than or equal to 25 mg kg-1. Plant available P in all other treatments
av-eraged 13.3 mg kg-1 which is below optimal levels
for plant growth (SERA-IEG 17, 2000). At the low-est application rate (6 Mg ha-1), the biosolids provided
161 kg P ha-1. Although recent studies have
demon-strated that the phytoavailable fraction of total P in biosolids varies based on biosolids treatment, results from this study suggest that P, or other nutrients pro-vided by the biosolids, may have been the factor re-sponsible for the high growth and subsequent high N demand in trees grown in these treatments (O’Connor et al., 2004).
A growth response has been seen when P is added to nitrogen fixing plants, but it is unknown whether or not the P limitation is due to nodulation and nodule function of the symbiotic relationship (Gentili & Huss-Danell, 2003; Olivera et al., 2004), or the host plant demand for P (Reddell et al., 1997). Binkley et al. (2003) found P fertilization of
Facaltaria moluccana (actinorhizal tree) to increase
both the seedling biomass by 75% and N fixation by 100%. Rojas et al. (2002) found the addition of ma-cronutrients (P, K, Ca, Mg), combined with inocula-tion of A. rubra with Frankia, to also increase both
rates of ARA and biomass.
Total P concentration in the soil for this study was 428 mg kg-1 and phytoavailable P was below
op-timal levels. In another study also conducted on a grav-elly, sandy loam, Indianola series soil, Compton & Cole (1998) found total soil P in a 50 year-old A. rubra stand
that colonized following a clear cut of P. menziesii / Tsuga heterophulla (Douglas fir/western hemlock)
for-est to be between 940 and 1130 mg kg-1 in the upper
15 cm of soil.
The first year root:shoot ratio of biosolid amended trees (0.45 ± 0.07) and control trees (0.47 ± 0.09) were both lower than the urea treatment (0.60 ± 0.13). The average total tree biomass of the biosolid, control and urea treatment trees was; 33 ± 14 g, 14 ± 11 g and 7 ± 3 g, respectively. Although Troelstra et al. (1992) found the addition of available N to increase
Figure 2 - Foliar biomass for Alnus rubra fertilized with urea or municipal biosolids applied to provide one, two or four times the estimated N demand. Means and standard deviation are shown for both harvests with two trees harvested per plot per year.
0 50 100 150 200 250
C
ont
rol
1X
U
rea
2X
U
rea
4X
U
rea
1
X
B
ios
ol
ids
2
X
B
ios
ol
ids
4
X
B
ios
ol
ids
Year 1 Year 2
Fol
ia
r B
iom
a
s
s
(
g
pe
r pl
ot
the biomass of A. incana, during the first year of this
study adding urea to the soil actually reduced tree growth, and it appears that at the highest rate of urea application the reduced yield seen in this study may have been partially related to NH3 toxicity.
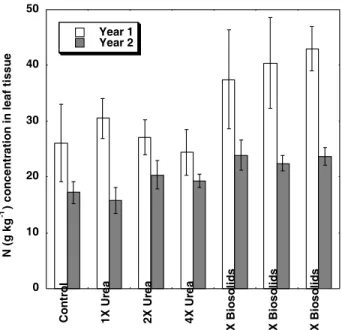
Foliar N
During both years of the study foliar N was higher in trees grown in the biosolids amended soils than other treatments (Figure 3). This difference was most pronounced during the first year of the study with foliar N in trees grown with biosolids averaging 40 ± 1 g kg-1 for comparison to 26 ± 1 g kg-1 for the
control and 27 ± 1 g kg-1 for the urea treated soils.
Foliar N for trees in urea treatments decreased with increasing rate of amendment. The first year trees growing in the 140 and 280 kg ha-1 urea treatments,
which had no detectable ARA activity, also had equiva-lent foliar N concentrations in relation to control trees indicating that the trees were able to utilize added soil available N. However, decreased foliar N of trees grown in the 560 kg ha-1 urea treatment, along with
reduced shoot biomass, may again indicate NH3 tox-icity.
For the second year, trees grown in biosolids amended soil had foliar N concentrations of 23 ± 2 g kg-1 as compared to 17 ± 3 g kg-1 for the control and
19 ± 3 g kg-1 for the urea amended soils. Foliar N
con-centration for trees grown with urea were similar to the control during the second year of the study when
available N was depleted from the soil. Second year foliar N, in combination with higher rates of ARA ac-tivity, indicate that at this time Frankia was
supply-ing N for the urea trees. The first year foliar N re-sults for all trees were higher than the second year when soil N was also higher, indicating that Alnus
were utilizing added soil N. The higher foliar N, rates of N fixation and shoot biomass of trees grown with biosolid amendments indicate that the N demand of trees was not being met entirely by Frankia or
biosolids, but by a combination of Frankia and
biosolids N concurrently. Urea trees appeared to only utilize either urea or Frankia N, not a combination
of the two, the reduced growth and resulting N de-mand of the trees in the urea treatments may have been the result of a nutrient deficiency. In compari-son, Compton et al. (1997) did not see a difference in foliar N when comparing two stands of A. rubra
between soils with differing P and pH, indicating that
Frankia was able to supply the difference, but did
find trees from lower P soils to also have lower fo-liar P, Ca, and Mg in addition to lower shoot biom-ass. In another study, Beaupied et al. (1990) found that the majority of leaf N in A. glutinosa came from symbiotically fixed N, even if there was available N in the soil, as shown by rates of N fixation and soil mineral N concentrations. Levels of available N in that study (~2-20 mg NO3- kg-1soil, ~2-12 mg NH
4 +
kg-1 soil) were lower than levels in this study.
CONCLUSION
TheAlnus/Frankia relationship for responses
to N added in the different forms of urea and biosolids showed positive effects resulting from the addition of biosolids and little response to added urea. Biosolids treated trees had higher shoot biomass, foliar N, and rates of N fixation than the urea and control trees. Urea inhibited rates of N fixation the first year, and had a negative impact on growth response. For low produc-tivity soils, land application of biosolids to A. rubra
appears to be an efficient method to maximize yield response. Although it was beyond the scope of this study to measure effects of NO3- leaching, the high
growth rate observed by trees grown in the biosolids amended soils suggests that N demand may have been high enough to reduce the potential for nitrate leach-ing.
ACKNOWLEDGEMENTS
This study was funded through a grant from King County and the Northwest Biosolids Management Association.
Figure 3 - Foliar N for Alnus rubra collected for both years of the study. Means ± standard deviation are presented. Trees were fertilized with urea or municipal biosolids applied to provide one, two or four times the estimated N demand prior to planting.
0 10 20 30 40 50
C
ont
rol
1X
U
rea
2X
U
rea
4X
U
rea
1
X
B
ios
ol
ids
2
X
B
ios
ol
ids
4
X
B
ios
ol
ids
Year 1 Year 2
N (
g
k
g
-1 ) co
n
cen
tr
ati
o
n
i
n
l
eaf ti
ssu
REFERENCES
BEAUPIED, H.; MOIROUD, A.; DOMENACH, A.-M.; KURDALI, F.; AND LENSI, R. Ratio of fixed and assimilated nitrogen in a black alder (Alnus glutinosa) stand. Canadian Journal of Forest Research, v.20, p.1116-1119, 1990.
BINKLEY, D.; SENOCKB, R.; CROMACK, K. Phosphorus limitation on nitrogen fixation by Facaltaria seedlings. Forest Ecology and Management, v.186, p.171-176, 2003. BREMNER, J.M. Nitrogen - total. In: BARTELS, J.M.; BIGHAM,
J.M.; SPARKS, D.L.; PAGE, A.L.; HELMKE, P.A.; LOEPPERT, R.H.; SOLTANPOUR, P.N.; TABATABAI, M.A.; JOHNSTON, C.T.; SUMNER, M.E. (Ed.) Methods of soil analysis. Part 3. Chemical methods. Madison: SSSA; ASA, 1996. p.1085-1089. BUSSE, M.D. Suitability and use of the 15N-isotope dilution method to estimate nitrogen fixation by actinorhizal shrubs. Forest Ecology and Management, v.136, p.85-95, 2000.
COMPTON, J.E.; COLE, D.W. Phosphorus cycling and soil P fractions in Douglas-fir and red alder stands. Forest Ecology and Management, v.110, p.101-112, 1998.
COMPTON, J.E.; COLE, D.W.; HOMANN, P.S. Leaf element concentrations and soil properties in first- and second-rotation stands of red alder (Alnus rubra).Canadian Journal of Forest Research, v.27, p.662-666, 1997.
CÔTÉ, B.; DAWSON, J.O. Effects of temperature regime and fertilization on nitrogenase activity of black alder seedlings during autumn in Illinois, USA. Canadian Journal of Forest Research, v.19, p.1644-1647, 1989.
DAIMON, H.; YOSHIOKA, M. Responses of root nodule formation and nitrogen fixation activity to nitrate in a split-root system in Peanut (Arachis hypogaeae L.). Journal of Agronomy and Crop Science, v.187, p.89-95, 2001.
FUJIKAKE, H.; YASHIMA, H.; SATO, T.; OHTAKE, N.; SUEYOSHI, K.; OHYAMA, T. Rapid and Reversible Nitrate Inhibition of Nodule Growth and N2 Fixation Activity in Soybean (Glycine max (L.) Merr.). Soil Science and Plant Nutrition, v.48, p.211-217, 2002.
GENTILI, F.; HUSS-DANELL, K. Local and systemic effects of phosphorus and nitrogen on nodulation and nodule function in
Alnus incana.Journal of Experimental Botany, v.54,
p.2757-2767, 2003.
HARDY, R.W.F.; BURNS, R.C.; HOLSTEN, R.D. Applications of the acetylene-ethylene assay for measurement of nitrogen fixation.Soil Biology and Biochemistry, v.5, p.47-81, 1973. HENRY, C.L.; COLE, D.W.; HARRISON, R.B. Nitrate leaching from fertilization of three douglas-fir stands with biosolids. In: THE FOREST ALTERNATIVE SYMPOSIUM, Seattle, 2000.
Proceedings. Seattle, 2000. p.83-88.
HENRY, C.L.; SULLIVAN, D.; RYNK, R.; DORSEY, K.; COGGER, C.Managing nitrogen from biosolids. Seattle: Washington State Department of Ecology, 1999. 57p.
HUSS-DANELL, K.; GENTILI, F.; VALVERDE, C.; WALL, L.; WIKLUND, A. Phosphorus is important in nodulation of actinorhizal plants and legumes. In: FINAN, T.M.; O’BRIAN, M.R.; LAYZELL, D.B.; VESSEY, J.K.; NEWTON, W. (Ed.).
Nitrogen fixation global perspectives. Hamilton: Oxford University Press, 2001. p.163-165.
KEENEY, D.R.; NELSON, D.W. Nitrogen - inorganic forms. In: PAGE, A.L. (Ed.) Methods of soil analysis. Part 2. Chemical and microbiological properties. Madison: ASA; SSSA, 1982. p.643-649.
KUO, S. Phosphorus. In: BARTELS, J.M.; BIGHAM, J.M.; SPARKS, D.L.; PAGE, A.L.; HELMKE, P.A.; LOEPPERT, R.H.; SOLTANPOUR, P.N.; TABATABAI, M.A.; JOHNSTON, C.T.; SUMNER, M.E. (Ed.) Methods of soil analysis. Part 3 Chemical methods. Madison: SSSA; ASA, 1996.
MARTIN, K.J.; POSAVATZ, M.J.; MYROLD, D.D. Nodulation potential of soils from red alder stands covering a wide age range.Plant and Soil, v.254, p.187-192, 2003.
MCNEILL, A.M.; ZHU, C.; FILLERY, I.R.P. Use of in situ 15N-labelling to estimate the total below-ground nitrogen of pasture legumes in intact soil-plant systems. Australian Journal of Agricultural Research, v.48, p.295-304, 1997.
MONACO, P.; CHING, K.; CHING, T. Host-endophyte effects on biomass production and nitrogen fixation in Alnus rubra
actinorhizal symbiosis. Botanical Gazette, v.143, p.298-303, 1982.
MYROLD, D.D.; RUESS, R.W.; KLUG, M.J. Dinitrogen fixation. In: ROBERTSON, P.; COLEMAN, D.; BLEDSOE, C.; SOLLINS, P. (Ed.) Standard soil methods for long-term ecological restoration. New York: Oxford University Press, 1999. p.241-257.
NATURAL RESOURCES CONSERVATION SERVICE – NRCS. Washington: State Soil Survey Report, 2004. Available in: http:/ /www.wa.nrcs.usda.gov.
NELSON, D.W.; SOMMERS, L.E. Total carbon, organic carbon, and organic matter. In: BARTELS, J.M.; BIGHAM, J.M.; SPARKS, D.L.; PAGE, A.L.; HELMKE, P.A.; LOEPPERT, R.H.; SOLTANPOUR, P.N.; TABATABAI, M.A.; JOHNSTON, C.T.; SUMNER, M.E. (Ed.) Methods of soil analysis. Part 3. Chemical methods. Madison: SSSA; ASA, 1996. p.961-1010. O’CONNOR, G.A.; SARKAR, D.; BRINTON, S.R.; ELLIOTT,
H.A.; MARTIN, F.G. Phytoavailability of biosolids-phosphorus.
Journal of Environmental Quality, v.33, p.703-712, 2004. OLIVERA, M.; TEJERA, N.; IRIBARNE, C.; OCANA, A.; LLUCH, C. Growth, nitrogen fixation and ammonium assimilation in common bean (Phaseolus vulgaris): effect of phosphorus.
Physiologia Plantarum, v.121, p.498-505, 2004.
REDDELL, P.; YUN, Y.; SHIPTON, W.A. Do Casuarina cunninghamiana seedlings dependent on symbiotic N2 fixation have higher phosphorus requirements than those supplied with adequate fertilizer nitrogen? Plant and Soil, v.189, p.213-219, 1997.
ROBERTSON, G.P.; SOLLINS, P.; ELLIS, B.G.; LAUTHA, K. Exchangeable Ions, pH, and Cation Exchange Capacity. In: ROBERTSON, P.; COLEMAN, D.; BLEDSOE, C.; SOLLINS, P. (Ed.). Standard soil methods for long-term ecological research. New York: Oxford University Press, 1999. p.106-114. ROJAS, N.S.; PERRY, D.A.; LI, C.Y.; GANIO, L.M. Interactions among soil biology, nutrition, and performance of actinorhizal plant species in the H.J. Andrews Experimental Forest of Oregon.Applied Soil Ecology, v.19, p.13-26, 2002. ROTHE, A.; CROMACK, K.J.; RESH, S.C.; MAKINECI, E.; SON,
Y. Soil carbon and nitrogen changes under douglas-fir with and without red alder. Soil Science Society of America Journal, v.66, p.1988-1995, 2002.
RYTTER, L.; ARVEBY, A.S.; GRANHALL, U. Dinitrogen (C2H2) fixation in relation to nitrogen fertilization of grey alder (Alnus
incana (L.) moench.) plantations in a peat bog. Biology and
Fertility of Soils, v.10, p.233-240, 1991.
SERA-IEG 17. Methods of phosphorus analysis for soils, sediments, residuals, and waters. Southern Cooperative Series Bulletin, n.396, 2000. Available in: http://www.soil.ncsu.edu/sera17/ publications/sera17-2/pm_cover.htm. Accessed at: 01/15/06. SHEARER, G.; KOHL, D.H.; VIRGINIA, R.A.; BRYAN, B.A.;
SKEETERS, J.L.; NILSEN, E.T.; SHARIFI, M.R.; RUNDEL, P.W. Estimates of N2-fixation from variation in the natural abundance of 15N in Sonoran Desert ecosystems. Oecologia, v.56, p.365-373, 1983.
SIDIRAS, N.; AVGOULAS, C.; BILALIS, D.; TSOURGRIANIS, N. Effects of tillage and fertilization on biomass, roots, N-accumulation and nodule bacteria of vetch (Vicia sativa cv. Alexander).Journal of Agronomy and Crop Science, v.182, p.209-216, 1999.
SPSS INC. SPSS 12 for Windows. Chicago, Il., 2003.
TROELSTRA, S.R.; WAGENAAR, R.; SMANT, W. Growth of Actinorhizal Plants as Influenced by the Form of N with Special Reference to Myrica gale and Alnus incana. Journal of Experimental Botany, v.43, p.1349-1359, 1992.
ULIASSI, D.D.; RUESS, R.W. Limitations to Symbiotic Nitrogen Fixation in Primary Succession on the Tanana River Floodplain.
Ecology, v.83, p.88-103, 2002.
USEPA. SW-846 - Test methods for evaluating solid waste – Physical/chemical methods. Method 3050B: Acid digestion of sediments, sludges, and soils. Washington, DC, 1986. VIEIRA, R.F. Sewage sludge effects on soybean growth and nitrogen
fixation. Biology and Fertility of Soils, v.34, p.196-200, 2001.
VOISON, A.S.; SALON, C.; MUNIER-JOLAIN, N.G.; NEY, B. Effect of mineral nitrogen nutrition and biomass partitioning between the shoot and roots of pea (Pisum sativum L.). Plant and Soil, v.242, p.251-262, 2002.
WALL, L.G.; HELLSTEN, A.; HUSS-DANELL, K. Nitrogen, phophorus, and the ratio between them affect nodulation in
Alnus incana and Trifolium pratense. Symbioses, v.29,
p.91-105, 2000.
WEAVER, R.W.; DANSO, S.K.A. Dinitrogen fixation. In: WEAVER, R.W.; ANGLE, J.S.; BOTTOMLEY, P.S. (Ed.).
Methods of soil analysis. Part 2. Chemical and microbiological properties. Madison: SSSA; ASA, 1994. p.1019-1023.