ISSN 0100-2945 http://dx.doi.org/10.1590/0100-29452017774
PRODUCTION COSTS AND PROFITABILITY
OF ‘NIAGARA ROSADA’ TABLE GRAPE GROWN
IN DIFFERENT REGIONS OF SÃO PAULO STATE
1FERNANDO PEREZ CAPPELLO2, MARCEL BELLATO SPÓSITO3, MAURO OSAKI4
ABSTRACT – Niagara Rosada is the main cultivar of table grapes produced in São Paulo state. Its production is concentrated mainly in the regions of Campinas, Itapetininga and Jales, where it is grown under different production systems. The aim of this study was to analyze the economic viability of cv. Niagara Rosada at main regions producers of São Paulo State. Therefore, case studies were made with grape growers for each
region to assess the production cost and calculate profitability. In the Campinas region, for two cycles per
year, the main crop and the second crop were evaluated, and the Total Cost (TC) obtained was US$ 0.81/ Kg, with US$ 0.23/Kg of Total Net Revenue (TNR). Considering only the main crop, the decrease of grape
production increased the production cost and reduced profitability, the TC reached was US$ 0.93/Kg and
TNR US$ 0.08/Kg. In the Itapetininga region, for two cycles per year, in main crop the TC was US$ 0.68/ Kg and the TNR was US$ 0.32/Kg. Meanwhile, in the second crop, the lower productivity increased TC to US$ 1.05/Kg, but the higher price caused a TNR of US$ 0.38/Kg. In the Jales region, only one cycle per year, TC was increased to US$ 1.21/Kg, however, the high selling prices in the off-season in São Paulo State resulted in TNR of US$ 0.43/Kg. According to the results, the production of cv. Niagara Rosada in different
regions of São Paulo State is profitable and has a positive return for family agriculture. Nevertheless, each
region has its own characteristics in terms of production and commercialization of table grapes.
Index terms:Vitis labrusca L., Table grape, Production cost, Investment; Profitability.
CUSTO DE PRODUÇÃO E RENTABILIDADE DA UVA ‘NIÁGARA ROSADA’
CULTIVADA EM DIFERENTES REGIÕES DO ESTADO DE SÃO PAULO
RESUMO - A Niágara Rosada é a principal cultivar de uva de mesa produzida no Estado de São Paulo. Sua produção concentra-se, principalmente, nas regiões de Campinas, Itapetininga e Jales, onde é cultivada sob diferentes sistemas de produção. O objetivo do trabalho foi analisar a viabilidade econômica da cv. Niágara Rosada nas principais regiões produtoras do Estado de São Paulo. Para isso, foram realizados estudos de caso com produtores de cada região para a elaboração do custo de produção e da rentabilidade da cultura, para o ano de 2012. Na região de Campinas, para dois ciclos de produção por ano, para as safras principal e temporã, o Custo Total (CT) foi US$ 0,81/kg, com uma Receita Líquida Total (RLT) de US$ 0,23/kg de uva. Na safra principal, a queda na produção elevou o custo e diminuiu a rentabilidade de forma que o CT foi de US$ 0,93/kg e a RLT de US$ 0,08/kg. Na região de Itapetininga, para dois ciclos de produção por ano, na safra principal, o CT foi de US$ 0,68/kg, e a RLT de US$ 0,32/kg, e na safra temporã, a menor produtividade elevou o CT para US$ 1,05/kg, mas o melhor preço de venda proporcionou uma RLT de US$ 0,38/kg. Na região de Jales, com apenas um ciclo de produção por ano, o CT foi de US$ 1,21/kg, contudo o elevado preço de venda na entressafra paulista gerou uma RLT de US$ 0,43/kg. Portanto, a produção de uva cv. Niágara Rosada, nas diferentes regiões do Estado de São Paulo, mostra-se rentável e possui retorno positivo nos moldes da agricultura familiar, apesar de cada região possuir diferentes características de produção e de comercialização.
Termos para indexação:Vitis labrusca L., custo de produção, investimento, rentabilidade.
1(Paper 111-16). Received September 12, 2016. Accepted December 02, 2016.
2Agronomist Engineer MSc, Researcher at CEPEA/ESALQ/USP – Piracicaba-SP – E-mail: fernandopcap@gmail.com
3Agronomist Engineer, Associate Professor, Crop Science Departament, ESALQ/USP, CNPQ scolarship productivity, level 2,
Piracicaba-SP – E-mail: mbsposito@usp.br
INTRODUCTION
The São Paulo state is the third largest Brazilian producer of grapes, with 132 thousand tons, of which 98.9% are allocated to the fresh market (INSTITUTO DE ECONOMIA AGRÍCOLA, 2015). The main cultivar of the São Paulo state is the American table grape ‘Niagara Rosada’ (Vitis
labrusca), which accounts for 92% of vineyards
planted. In the three main producing regions of grape in São Paulo State, namely Campinas, Itapetininga and Jales, cv. Niagara Rosada accounts for 56%, 24.5% and 6.9%, respectively, of the production (INSTITUTO DE ECONOMIA AGRÍCOLA, 2015). These producing regions feature distinct characteristics in terms of vineyard management, vine density and pruning systems, which are related to climatic conditions of each region (MAIA; CAMARGO, 2012). However, for the activity to
be profitable, a market analysis where the producer
intends to offer its product is required, as well as the analysis of production economic factors. Among these factors, Total Cost (TC) is an essential tool for decision-making based on sustainability. TC represents all expenses on the property during the harvest, comprising the sum of depreciation costs and opportunity costs of the capital asset (structures, machinery, irrigation system, and implements) and capital invested in the vineyard. Thus, if the return is positive, revenue from the culture should be equal to or greater than TC to prevent devaluation of assets at the end of their useful life.
In order to evaluate the economic scenario of grape producers of the main producing regions of cv. Niagara Rosada table grape in the state of São Paulo, this work aimed to determine typical production features of each region and calculate TC, according to the production system established at properties.
MATERIAL AND METHODS
The major producing regions of cv. Niagara Rosada table grape in São Paulo were chosen based on production data of the year 2011 (INSTITUTO DE ECONOMIA AGRÍCOLA, 2015). The selected regions were Campinas, Itapetininga and Jales. In each region, seven producers of cv. Niagara Rosada were selected, recommended by producer groups and public agencies, such as the Coordenadoria de Assistências Técnicas Integrais (CATI) in São Miguel Arcanjo, Instituto Agronômico de Campinas (IAC) in Jundiaí, and Embrapa Uva e Vinho, in Jales. Two
meetings were carried out with each producer to obtain information on the production system adopted, routine of production activities and grape marketing and to calculate production costs for the year of 2012, taking into account the average planted area, management system, spacing, as well as age and number of pruning events. Data on the production process of cv. Niagara Rosada table grape were used to analyze the average production cost by region. The values obtained were converted into U.S. dollar based on the rate R$1.95 for U.S. dollar, average value in the year 2012 (BANCO CENTRAL DO BRASIL, 2015).
Total Cost (TC) was calculated as the sum of the Operating Cost (OC) with the Annual Recovery Capital (ARC) (ALVES et al., 2012; BARROS, 2014). OC refers to operations that generate production assets throughout a year. The items used to compose OC were: labor costs; inputs, such as pesticides, fertilizers, dormant benchgrafts, fuels, lubricants, adjuvants (disregarding items in stock); operations with machinery and equipment; irrigation costs; overhead costs (water, electricity, telephone, utility expenses, individual protection equipment, associations and unions costs, taxes collected on the property and vineyard insurance), capital costs and harvesting costs. In the item ‘harvesting’, the cost of packing and freight was not taken into account, because each producer has their own way of trading. Therefore, the average price received by the producer described in this work was free of shipping and packing costs. The cost of inputs, pesticides, fertilizers, etc., was calculated in all three regions based on prices collected with producers and local retailers referring to the year 2012 at the doses and quantities used.
For the cost of working capital, an opportunity cost was considered when the producer used their own
capital to finance the harvest, and an interest rate of
discount rate for the opportunity cost was the same used in ARC of other goods, with real interest rate of 1.23% per year, equivalent to the average gains of savings between 2009 and 2013
For the Profitability Analysis, productivity
and average sales prices practiced in the marketing of grapes during the harvest in each region were collected. These data were used to obtain Operational Net Revenue (ONR), described in equation: ONR = GR – OC, where GR is the gross revenue obtained by the average sales price in US$/kg multiplied by productivity and OC is the variable costs of a year crop. The comparative analysis between the regions was made from ONR and TNR (Total Net Revenue), in terms of investments, by the Rate Return on the Operational Cost (RROC) and by the Rate Return on Total Cost (RRTC). These indicators are used to inform about how much the activity returns in terms of OC and TC of the harvest, when the investment made is also taken into account.
For the data of OC, TC, Profitability and
components of production cost, labor and pesticides, collected from each producer, the analysis of variance and comparison of the means were carried out by the Tukey test (5%). The analyses were made in the statistical program SAS 9.3, Stat Module.
RESULTS AND DISCUSSION
In the Campinas region, the typical property has an average area planted of cv. Niagara Rosada table grape of 4.5 ha and the typical trellis system is vertically shoot-positioned (VSP), with spacing 1.00 x 1.70 m (5,882 plants/ha). In this region, three crops are held every two years, with a semester of interval between the pruning events. In the 2011/12 harvest, about 40% of producers of Campinas held an second crop, obtained from pruning in February, following the main crop, by a pruning event carried out in August. Most producers, however, held only
the main crop and diversified revenue in the middle
of the year with other cultures, mostly, other fruit trees. In pruning for main and second crops, around 8-14 productive branches per plant and 1-2 buds per branch are kept. Two bunches are kept, on average,
for each productive branch. In relation to the profile
of producers in the Campinas region, the role of family labor is highlighted, even if merged with day workers and hired employees, as reported by Silva et al. (2008). The useful life of the vineyard was considered ten years for production, in addition to two years of deployment. The average productivity of the main harvest was 14.2 ton/ha (harvest in December-January), that is, 2.43 Kg/plant. Silva et
al. (2008) observed similar results for the Campinas region, with an average density of 1.7 x 1.0 m the average productivity was 2.3 Kg/plant. In the second harvest (harvest in May-July), the average productivity was 10.3 ton/ha, that is, 1.76 Kg/plant. The lower productivity in the second crop, compared to the main crop, observed for the Campinas region in this work, is common, because producers who perform second crop always carries it out after the main crop. Therefore, there is a depletion of
plant stocks, which reflects on the productivity of
the second crop, besides unfavorable weather that is more conducive to the development of fungal diseases.
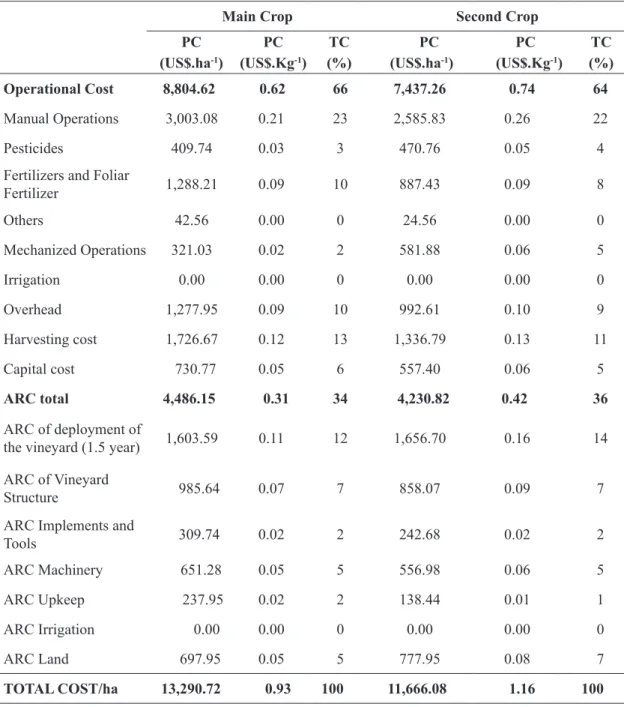
In the main and second crops, the producer had to sell the cv. Niagara Rosada table grape at least for US$0.62/Kg and US$0.74/Kg, respectively, to cover operational costs and for US$0.93/Kg and US$1.16/Kg, respectively, to cover costs and recover the capital invested in the property as well as remunerate the opportunity cost of land (Table 1).
In the OC distribution, the labor item (manual operation) was the most expensive for the producer, both in the main and second crops, due to activities of pruning, shoot thinning, hedging and sprays. This high cost is attributed to the average value of remuneration paid for daily work journey in the region of US$28.16, and the number of working days, on average 135 days (Table 1). Harvesting was the second most expensive item of OC, both in the main and second crops. With an average harvesting rate of 70 5-Kg boxes/day, harvesting accounted for 13% and 11% of TC. Regarding costs of inputs, in the two crops, fertilization was the costliest item in which the organic matter (OM) represented 63%. The OM used was chicken manure at a dosage of 2.5 L per plant. Regarding the use of pesticides, in the main and second crops, 15 and 22 sprays were carried out, respectively.
The larger number of sprays in the second crop was due to environmental conditions where the plants developed, as more rains occurred in the budding period, which favored the presence of diseases. Among the pesticides, fungicide costs accounted for 68% in the main and second crops. The main diseases in vineyards of the region were the downy mildew (Plasmopara viticola) and anthracnose (Elsinoe ampelina). In relation to ARC, the higher cost was the investment to deploy the vineyard, which occurred during a year and a half
before the first production pruning, accounting for
38% of total ARC (Table 1).
costs and pesticide costs. The sales price per kg of fruit was higher in the second crop; however, as productivity of the main crop was greater, total net revenue (TNR) was equal for both crops (Table 4). Producers who grew two crops (main crop followed by second crop) had the average sales price of cv. Niagara Rosada weighted between the two crops of US$1.09/kg, with an annual productivity of 24.57 ton/ha, which resulted in GR of US$26,884.10/ha per year. Therefore, ONR was $10,642.22/ha per year, that is, a margin of US$0.43/kg of grapes marketed. When considering TC, the producer obtained TNR, or
profit of US$1,927.30/ha per year, that is, US$0.08/
kg of grapes. The leveling productivity to cover TC, considering the two crops, was 22.8 ton/ha, thus, the
difference of 1.7 ton/ha was the annual profit of the producer. In this scenario, the role of family financial
management is important, because the income obtained provides for around 3-4 persons (wife and children) and payments for the grapes do not occur homogeneously.
Under the proposed conditions for the main and second crops, RROC was 66% and RRTC, 8%.
Although return and profitability of activity showed
positive results in 2012, the increase in the second crop is seen by some producers as a solution to just
solve cash-flow issues. The second crop may present
a greater risk of production losses because of adverse weather conditions, and the following pruning events may decrease the useful production life of vineyards for exhausting the plants (GUILHARDI; MAIA, 2001).
In the Itapetininga region, a typical property with cv. Niagara Rosada vineyards has 2 ha and the typical trellis system is vertically shoot-positioned (VSP), with 1.5 x 0.9 m spacing (7,400 plants/ha). There is a main crop or a second crop, from production pruning (main crop) and drastic pruning (complete elimination of production branches) followed by summer pruning on the branch formed after drastic pruning (second crop). On main and summer pruning events, around 8 to 12 branches per plant and one bud per branch are kept and two bunches are kept for each productive branch per plant. In 2012, the main crop (January-March) had average productivity of 22.01 ton/ha, or 2.97 Kg/plant, and on the second crop, the average productivity was 15 ton/ha, that is, 2.03 Kg/plant.
In the Itapetininga region, there is difficulty
for selling the fruit directly at supply stations; thus,
the figure of an intermediary purchaser is clear,
reducing the possibility to obtain better prices for the crop, in addition to irregularities in payments.
Production in the region is flown to supply stations
in the state of São Paulo, Paraná and local markets and retailers. Producers claimed that technical assistance is not frequent in the region; likewise, it is not common to elaborate production costs of the property. However, producers usually insure the vineyards and perform soil analysis at least every two years to support fertilizing procedures. Another
feature of the area is family farming and financing
crop costs in which PRONAF (National Program for the Strengthening of Family Agriculture) is the line used by the producers. However, for the development of new areas, producers use their own capital.
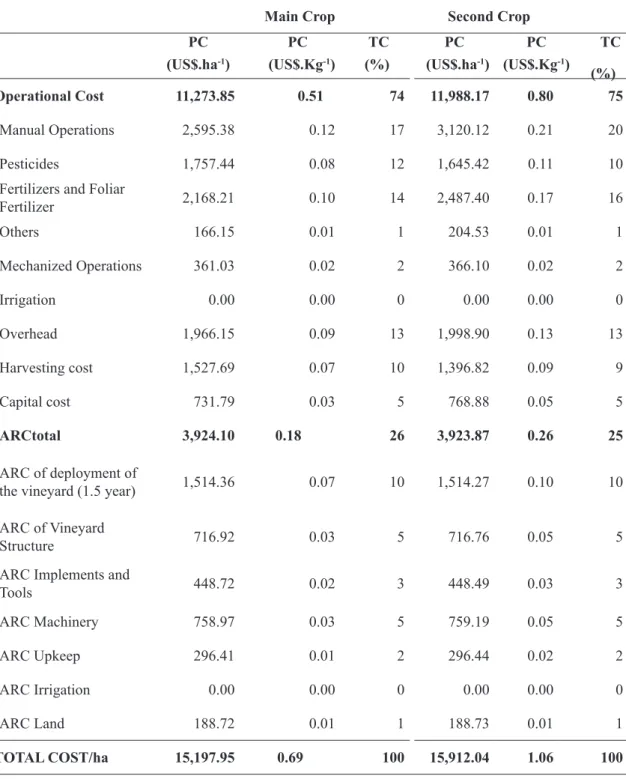
Based on the typical property in the region, considering costs of the main crop in 2012, the producer would need to sell the cv. Niagara Rosada grape for US$0.86/Kg to cover TC. Taking into account depreciation and opportunity cost of capital invested in the property, the cost would be US$0.69/ Kg with a productivity of 22.01 ton/ha (Tables 2 and 4). Based on the sales price in 2012, the producer would have to obtain a minimum productivity of ton/ha to cover TC.
In OC, manual operations, such as pruning, shoot thinning, hedging and sprays accounted for increased expenses (17%), followed by soil and foliar fertilizers (14%). For labor remuneration, the value US$23.04 was adopted for the 8-h daily work journey, average value of the region. Overall, 71 daily journeys were spent on cultural practices. Regarding pesticides, during the main crop of 2012, there were 37 sprays on average. Nevertheless, the cost of machinery to perform the sprays accounted for only 2% of TC. In the region, due to the high vine density, most producers held the spraying with low-power stationary sprayers and low fuel consumption in which the producer conducts the spray nozzle through the vineyard. Among the pesticides, fungicide was the most expensive item, accounting for about 8% of TC and 76% of pesticide costs. Of the 37 sprays carried out, 33 were sprays with fungicides. The main diseases that occurred in the vineyards of the region were downy mildew (Plasmopara viticola), anthracnose (Elsinoe
ampelina), gray mold (Botrytis cinerea) and powdery
useful life (eight years in production).
On green pruning for the second crop in 2012, the results of OC and TC per ha were similar to those obtained for the main crop (Table 2). However, the average productivity achieved in the second crop was 15 ton/ha, with OC of US$0.80/ Kg and TC of US$1.06/Kg, 54% above the TC value for the main crop in the region (Table 2). The distribution of OC and total ARC in the second crop was similar to that in the main crop. Costs of manual operations with fertilizers and foliar fertilizers were the most representative of TC, with 20% and 16%, respectively. In the second crop, there was an increase in upkeep costs, due to one more pruning event in relation to the main crop (drastic pruning and green pruning), which required 91 daily work journeys more, accounting for 13.4% of TC. The cost of harvesting presented a small reduction in relation to the main crop, because despite the lower crop production, the harvesting capacity estimated was lower than that for the main crop (90 5-kg boxes harvested per day per worker). As for pesticides, the second crop required an average of 41 sprays, and 37 of which were sprays with fungicides. The cost of fungicides accounted for 84% of pesticide costs, while pesticides accounted for 10% of TC.
In the Itapetininga region, the average sales price of cv. Niagara Rosada table grape from the main crop was US$0.86/Kg in 2012 and the average productivity of the region was 22.01 ton/ha. GR was US$18,928.60/ha per crop from which OC was subtracted, and ONR of US$7,654.75/ha per crop was obtained, meaning a difference of US$0.35/
Kg of grapes marketed. TNR, or activity profit,
was US$3,730.65/ha per crop, or US$0.17/Kg. The productivity level of TC, based on the sales price, was 17.67ton/ha. Therefore, in the scenario of the main harvest of 2012, productivity was 24.5 percent. The RROC was 68%, and 25% was RRTC. Thus, the producer was able to honor their commitments of the crop, remunerating their workforce based on payment of daily work journeys and was also able to have a monthly withdrawal of US$310.89/ha, based on the TNR of the main crop obtained in 2012. In the second crop, the average sales price of grape was set at US$1.53/Kg, which, combined with the average crop productivity of 15 ton/ha, resulted in GR of US$22,959.18/ha per crop. Considering the OC and TC obtained, ONR and TNR were US$10,971.01/ ha per crop (US$0.73/Kg) and US$7,047.14/ha per crop (US$0.47/Kg), respectively. The balance productivity was US$10,400.03 Kg/ha, if the sales price of the grape was kept. RROC and RRTC obtained for the second crop were 92% and 44%,
respectively. The region has a tendency to carry out green pruning every two years in the vineyards of cv. Niagara Rosada in order to obtain larger revenue due to the better price during the off-season, extending thus the marketing window.
In the Jales region, a typical property has an area of 3.5 ha of cv. Niagara Rosada table grape, and the typical trellis system is pergola, spacing 2.00 m x 2.50 m (2,000 plants/ha) under irrigation. Another feature of the region is two pruning events; one formation pruning (September-December) and a production pruning (February-July) to allow harvesting in the off-season of other table grape producing regions of São Paulo State, between June and November (COSTA et al., 2008; COSTA et al., 2012). In the production pruning, between 20 and 25 productive branches are kept per plant, and two bunches per branch on average, totaling 45 bunches per plant. For the 2012 crop, an average productivity of 20.6 ton/ha, or 10.3 Kg/plant, was set.
Unlike other producing regions of cv. Niagara Rosada table grape, in the Jales region, producers are undergoing an adaptation process of the culture to the tropical climate. Family labor is also characteristic of the region; however, 29% of producers have permanent workers, in addition to family labor. Most producers of Jales have no technical assistance for the production; however, they perform soil analysis every two years to support fertilizer use. Crop production is supplied to the local market, supply stations in the São Paulo state and to other states in the southeastern, southern and central-western regions. In the Jales region, the presence of intermediary purchaser is common. Regarding financial funding, 60% of
producers acquire cost financing for the crop, mostly
using PRONAF. Most producers in the region do not insure the vineyards, once most vineyards are covered with black screen, with 18% of shading, which protect against hailstorms.
eight years of production).
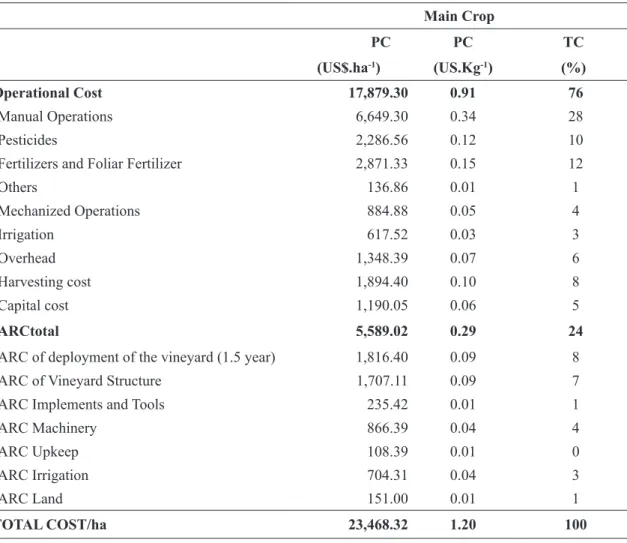
Family labor was remunerated based on the value of the daily journey in the region, at US$28.16. Upkeep costs were the most representative item in TC with 20.4%, equivalent to 172 daily journeys for pruning, shoot thinning, hedging, etc. For the harvesting, internal transport of production and packaging of 20.6 ton/ha spent US$1,433.76/ ha, with a capacity of 77 5-kg boxes per day. Regarding inputs, pesticide and fertilizer costs were similar. The cost of OM and formulated fertilizers accounted for 47% and 40% of spent with fertilizers and foliar fertilizers, respectively. In the pesticide cost, fungicides accounted for 67% and vegetables regulators, 23%. In the 2012 crop, 63 sprays were made and 60 were made with fungicides. Costa et al. (2012) obtained a similar result. The authors found 59 sprays with fungicides, for the same region. The main diseases in the region were downy mildew (Plasmopara viticola), anthracnose (Elsinoe
ampelina), rust (Phakopsora euvitis), leaf blight
(Mycophaerella personata) and powdery mildew
(Uncinula necator).
In the Jales region, pesticide costs were higher than in the other regions, at US2,286.56/ha due to the greater number of sprays with fungicides and the use of plant regulators, such as Ethephon (Table 3). The use of Ethephon applied prior to production pruning induces plant defoliation, which standardizes and improves the vine ability to sprout (FRACARO et al., 2004). The harvesting occurred from late June through November, and the average sales price received by the grape producer was US$1.63/Kg. This value was above the average price
received by producers of other regions, justified by
lower supply in the period. Average productivity of 20.6 ton/ha in the crop resulted in GR of US$33,578.00/ha per year. Therefore, the resulting ONR was US$15,698.70/ha (US$0.76/Kg of grapes marketed) and TNR US$10,109.68/ha (US$0.49/Kg). The balance productivity was 14,397.74 Kg/ha per crop; however, the average productivity achieved was 43% higher. With this result, RROC was 88% and RRTC was 43%. Producers of Jales managed to cover for OC and TC, which allowed a monthly
withdrawal on the profit of US$842.47/ha.
Among the regions and crops evaluated, TC in the Jales region presented the highest value. In this region, even with high productivity, TC was high due to higher demand for labor that requires manual practice in a trellising pergola system and because of two pruning events (formation and production) and only one harvesting activity. In the other regions and crops, due to management of the VPS trellis system,
there was no difference in labor costs. In the Jales region, the use of irrigation and the high number of sprays also increased TC (Table 4).
Pesticide costs, where the use of fungicides predominated, presented higher values in Jales and in the second crop of Itapetininga, due to the greater number of sprays throughout the crop, 60 and 39, respectively. This occurred because in both regions
and crops, plants develop in the first semester of the
year, which is a period that favors the occurrence of diseases, mainly downy mildew. In the Campinas region, there was lower frequency of sprays and less volume per application, which resulted in lower costs of pesticides (Table 4), due to the lower volume of leaf area because of the smaller number of plants per ha in the trellising system.
The crop of the Jales region, as well as the second crop of Itapetininga, obtained the highest average sales prices of cv. Niagara Rosada table
grape. The prices obtained are justified because the
harvesting occurs in period of low supply of the plant variety on the market, mainly in Jales, in off-season. Despite the greater TC for these crops and regions, the prices obtained by the sales resulted in higher TNR in relation to other regions and crops, ensuring
higher profitability. In Itapetininga, net revenues
TABLE 1- Production Cost (PC) per hectare (ha) and kilo (Kg), in dollars (US$), of ‘Niagara Rosada’ table grape and participation of activities in Total Cost (TC) for the operational cost and annual recovery capital (ARC) to the main and second crops in the region of Campinas-SP, in 2012/13.
Main Crop Second Crop
PC PC TC PC PC TC
(US$.ha-1) (US$.Kg-1) (%) (US$.ha-1) (US$.Kg-1) (%)
Operational Cost 8,804.62 0.62 66 7,437.26 0.74 64
Manual Operations 3,003.08 0.21 23 2,585.83 0.26 22
Pesticides 409.74 0.03 3 470.76 0.05 4
Fertilizers and Foliar
Fertilizer 1,288.21 0.09 10 887.43 0.09 8
Others 42.56 0.00 0 24.56 0.00 0
Mechanized Operations 321.03 0.02 2 581.88 0.06 5
Irrigation 0.00 0.00 0 0.00 0.00 0
Overhead 1,277.95 0.09 10 992.61 0.10 9
Harvesting cost 1,726.67 0.12 13 1,336.79 0.13 11
Capital cost 730.77 0.05 6 557.40 0.06 5
ARC total 4,486.15 0.31 34 4,230.82 0.42 36
ARC of deployment of
the vineyard (1.5 year) 1,603.59 0.11 12 1,656.70 0.16 14
ARC of Vineyard
Structure 985.64 0.07 7 858.07 0.09 7
ARC Implements and
Tools 309.74 0.02 2 242.68 0.02 2
ARC Machinery 651.28 0.05 5 556.98 0.06 5
ARC Upkeep 237.95 0.02 2 138.44 0.01 1
ARC Irrigation 0.00 0.00 0 0.00 0.00 0
ARC Land 697.95 0.05 5 777.95 0.08 7
TABLE 2 - Production Cost (PC) per hectare (ha) and kilo (Kg), in dollars (US$), of ‘Niagara Rosada’ table grape and participation of activities in Total Cost (TC) for the operational cost and annual recovery capital (ARC) to the main and second crops in the region of Itapetininga-SP, in 2012/13.
Main Crop Second Crop
PC PC TC PC PC TC (US$.ha-1) (US$.Kg-1) (%) (US$.ha-1) (US$.Kg-1)
(%) Operational Cost 11,273.85 0.51 74 11,988.17 0.80 75
Manual Operations 2,595.38 0.12 17 3,120.12 0.21 20
Pesticides 1,757.44 0.08 12 1,645.42 0.11 10
Fertilizers and Foliar
Fertilizer 2,168.21 0.10 14 2,487.40 0.17 16
Others 166.15 0.01 1 204.53 0.01 1
Mechanized Operations 361.03 0.02 2 366.10 0.02 2
Irrigation 0.00 0.00 0 0.00 0.00 0
Overhead 1,966.15 0.09 13 1,998.90 0.13 13
Harvesting cost 1,527.69 0.07 10 1,396.82 0.09 9
Capital cost 731.79 0.03 5 768.88 0.05 5
ARCtotal 3,924.10 0.18 26 3,923.87 0.26 25
ARC of deployment of
the vineyard (1.5 year) 1,514.36 0.07 10 1,514.27 0.10 10
ARC of Vineyard
Structure 716.92 0.03 5 716.76 0.05 5
ARC Implements and
Tools 448.72 0.02 3 448.49 0.03 3
ARC Machinery 758.97 0.03 5 759.19 0.05 5
ARC Upkeep 296.41 0.01 2 296.44 0.02 2
ARC Irrigation 0.00 0.00 0 0.00 0.00 0
ARC Land 188.72 0.01 1 188.73 0.01 1
TABLE 3- Production Cost (PC) per hectare (ha) and kilo (Kg), in dollars (US$), of ‘Niagara Rosada’ table grape and participation of activities in Total Cost (TC) for the operational cost and annual recovery capital (ARC) to the main crop in the region of Jales-SP, in 2012/13.
Main Crop
PC PC TC
(US$.ha-1) (US.Kg-1) (%)
Operational Cost 17,879.30 0.91 76
Manual Operations 6,649.30 0.34 28
Pesticides 2,286.56 0.12 10
Fertilizers and Foliar Fertilizer 2,871.33 0.15 12
Others 136.86 0.01 1
Mechanized Operations 884.88 0.05 4
Irrigation 617.52 0.03 3
Overhead 1,348.39 0.07 6
Harvesting cost 1,894.40 0.10 8
Capital cost 1,190.05 0.06 5
ARCtotal 5,589.02 0.29 24
ARC of deployment of the vineyard (1.5 year) 1,816.40 0.09 8
ARC of Vineyard Structure 1,707.11 0.09 7
ARC Implements and Tools 235.42 0.01 1
ARC Machinery 866.39 0.04 4
ARC Upkeep 108.39 0.01 0
ARC Irrigation 704.31 0.04 3
ARC Land 151.00 0.01 1
TOTAL COST/ha 23,468.32 1.20 100
TABLE 4-Productivity per hectare, total cost, labor cost, pesticide cost, sales price and total net revenue obtained in the different producing regions of ‘Niagara Rosada’ table grape and crops in the state of São Paulo, in 2012/13.
Region - Crop Productivity (Kg.ha-1)z
Total Cost (US$.Kg-1)
Labor Cost (US$.Kg-1)
Pesticide Cost (US$.Kg-1)
Sales Price (US$.Kg-1)
Total Net Revenue (US$.Kg-1)z
Campinas – main 14,228 b 0.93 ab 0.22 abc 0.02 c 1.01c 0.07b
Campinas – second 10,342 c 1.16 a 0.28 ab 0.05 bc 1.21 b 0.06 b
Itapetininga – main 22,010 a 0.69 b 0.12 c 0.08 ab 0.86 c 0.17 ab
Itapetininga – second 15,006 b 1.06 ab 0.21 bc 0.11 a 1.53 ab 0.47 a
Jales – main 20,600 a 1.20 a 0.34 a 0.12 a 1.63 a 0.44 a
CONCLUSION
Taking into account the characteristics of each system and pre-established conditions in the vine crops analyzed, all producing regions of ‘Niagara Rosada’ table grapes of São Paulo State feature revenues that cover for total costs, presenting as economically sustainable.
In the Itapetininga region, in the production cost analysis, main and second crops of ‘Niagara Rosada’ table grape are similar, not showing thus gains from green pruning, in the scenario of price and productivity.
The Jales region presents the highest production costs. However, the highest sales price of ‘Niagara Rosada’ table grape, which occurs in the off-season of other producing regions of São Paulo State, confers the highest total net revenue to producers in this region.
ACKNOWLEDGEMENTS
To the Research Foundation of São Paulo State – FAPESP (Process: 2012/10472-4 and 2013/24003-9) for the financial support, which enabled the realization of this project.
REFERENCES
ALVES, L.R.A.; BARROS, G.S.C.; OSAKI, M. Custo de produção e gestão operacional das fazendas. In: INSTITUTO MATO-GROSSENSE DO ALGODÃO. Manual de boas práticas de manejo do algodoeiro em Mato Grosso. Cuiabá, 2012. p. 18-31.
BANCO CENTRAL DO BRASIL. Taxa de câmbio 2012. Disponível em: <http://bcb.gov.br/pec/taxas>. Acesso em: 1 fev. 2015.
BARROS, G.S. Gestão de negócios agropecuários com foco no patrimônio.Piracicaba: ESALQ, 2014. 67 p. (Série Didática, D-130). Disponível em: <http://economia.esalq.usp. br/did/did-130.pdf>. Acesso em: 9 maio 2014.
COSTA, S.M.A.L.; GOMES, M.R.L.; TARSITANO,
M.A.A. A comercialização de uvas finas na região
de Jales – SP. Revista Brasileira de Fruticultura, Jaboticabal, v.30, n.1, p.127-132, 2008.
COSTA, T.V.; TARSITANO, M.A.A.; CONCEIÇÃO, M.A.F. Caracterização social e tecnológica da produção de uvas para mesa em pequenas propriedades rurais da região de Jales-SP. Revista Brasileira de Fruticultura, Jaboticabal, v.34, n.2, p.766-773, 2012.
FRACARO, A.; PEREIRA, F.M; NACHTIGAL, J.C.; BARBOSA, J.C. Efeito do ethephon sobre a produção da uva ‘Niágara Rosada’ (Vitis labrusca
L.) produzida na entressafra na região de Jales-SP.
Revista Brasileira de Fruticultura, Jaboticabal, v.26, n.1, p. 82-85, 2004.
GUILHARDI, A.A.; MAIA, M.L. Tecnologia, custo de produção e rentabilidade do cultivo de uva Niágara no Estado de São Paulo. Informações Econômicas, São Paulo, v.31, n.12, p.48-64, 2001.
INSTITUTO DE ECONOMIA AGRÍCOLA.
Área e produção dos principais produtos da agropecuária. São Paulo, 2015. Disponível em: <http://ciagri.iea.sp.gov.br/nia1>. Acesso em: 1 fev. 2015.
MAIA, J.D.G.; CAMARGO, U.A. Implantação do vinhedo. O cultivo da videira Niágara no Brasil.
Brasília: Embrapa. Chap 4, p. 81-96, 2012.