________________________________
1 M.Sc., Pesquisador Científico, Agência Paulista de Tecnologia dos Agronegócios - Pólo Leste Paulista, Secretaria de Agricultura e
Abastecimento do Estado de São Paulo, Monte Alegre do Sul - SP, [email protected].
2 Dr., Professor Livre-Docente (M-5), Universidade Estadual de Campinas - UNICAMP, Faculdade de Engenharia Agrícola,
Departamento de Máquinas Agrícolas, Campinas - SP. Recebido pelo Conselho Editorial em: 23-6-2010 Aprovado pelo Conselho Editorial em: 15-8-2011
DANIEL GOMES1, ANTONIO C. DE O. FERRAZ2
ABSTRACT: The ‘Niagara Rosada’ grape is the main Brazilian table grape belonging to the
Labrusca family. It develops medium, cylindrical and compact bunches with berries presenting a pinkish skin and a foxy flavor that is valued in the Brazilian market. These berries are tender and have a pedicel-berry connection provided by the vascular bundles and surrounding skin. This cultivar is very susceptible to berry drop mainly caused by vibration and senescence. The objective of this study was to evaluate the temporal mechanical behavior of the pedicel-berry detachment, using resistance indexes extracted from traction force-deformation curves. Test results showed two different detachment types. In the first one, which exhibited higher average resistance, a considerable portion of the vascular bundle came out attached to the pedicel and in the second type; the vascular bundle was retained inside the berry. The proposed indexes based on maximum detachment force, force at 0.2; 0.5; 1.0 and 1.2 mm, and maximum force to corresponding deformation ratio did not discriminate the senescence of the berry.
KEYWORDS: postharvest, viticulture, mechanical properties, senescence.
COMPORTAMENTO MECÂNICO DO DESTACAMENTO DE BAGOS DE UVA
‘NIAGARA ROSADA’
RESUMO: A uva Niagara Rosada é a principal uva de mesa brasileira, da família das Labruscas, possui cachos médios cilíndricos e compactos, coloração rosada e sabor denominado Foxy muito apreciado pelo consumidor brasileiro. Os frutos são delicados, a junção do pedicelo com o bago é feita pela casca e por feixes vasculares. Essa cultivar é muito suscetível à degrana causada, principalmente, pela vibração e pelo envelhecimento. O objetivo deste trabalho foi avaliar o comportamento mecânico da junção pedicelo-bago e sua variação temporal, utilizando-se de índices de resistência ao destacamento, extraídos das curvas força-deslocamento, obtidos em ensaios de tração de uvas. Os ensaios revelaram dois tipos de destacamento: um em que porção considerável do pincel (feixes vasculares) saiu preso ao pedicelo, e outro, em que o pincel ficou no interior do bago. A resistência média encontrada no primeiro tipo de destacamento foi maior que o segundo. Os índices de resistência constituídos pelos valores médios da a força máxima no destacamento, força às deformações de 0.2; 0.5; 1.0 e 1.2 mm, e a razão entre força máxima e o deslocamento correspondente não discriminaram a senescência do bago.
INTRODUCTION
The cultivar 'Niagara Rosada' is the main Brazilian table grape, accounting for 80% production of the table grapes in the state of São Paulo (CATI, 2001). It is a crop of pronounced social importance, which is cultivated largely by small and medium farmers that use family labor. This cultivar is classified as Rustic Table from the Labrusca family, with medium, cylindrical and compact bunches. The berry is of medium size, with ellipsoidal shape and pink skin coated with a thin layer of wax called bloom. The pulp is mucilaginous and has a raspberry flavor called 'foxy',
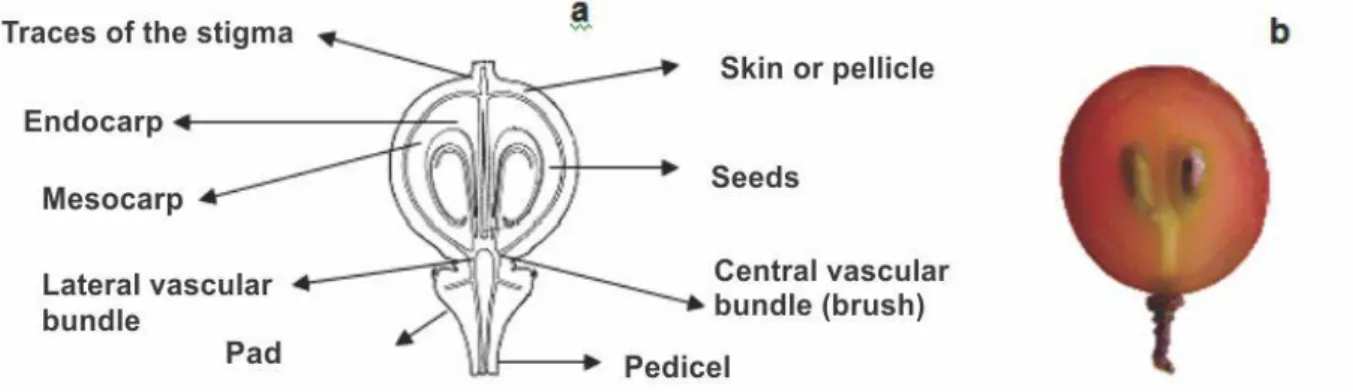
typical of Labrusca. The stalk is part of the bunch, being characterized by woody branches called pedicel, which supports the berries. At the end of each pedicel, there is a small bump called the pad, which extends the vascular bundles, with the purpose of nourishing the berries and the seeds (GOMES, 2006). The central vascular bundle is called the brush (Figure 1, RIBEREAU & PEYNAUD, 1980). The berry consists of a structure formed by one or more syncarpic carpels, with a thin epicarp, a mesocarp and a juicy endocarp, with one or more seeds (CHITARRA & CHITARRA, 1995).
The berry has little mechanical strength and is naturally more susceptible to detachment from the pedicel (threshing), especially after harvest (GOMES, 2006).
FIGURA 1. Illustration of the grape berry morphology (a) adapted from RIBEREAU & PEYNAUD (1980), and the longitudinal section (b) of a ‘Niagara Rosada’ grape berry (Picture:
DANIEL GOMES, 2006).
MATERIAL AND METHODS
Cleaning, identification and classification
Bunches of Class III grapes cv. 'Niagara Rosada' derived from the municipality of Louveira, state of São Paulo, were harvested in the morning. Toilet was carried out in the field, with removal of leaves or branches located between the grapes, as well as rotten, deformed or damaged grapes. These bunches were identified with a label attached to the stem and classified according to the technical regulation of identity and quality of Rustic Table grapes (BRASIL, 2002). The class III was chosen for this study by presenting medium-sized bunches of 250 to 350 g, which represents the class of highest production volume.
Packaging and storage
After classification, packaging was performed using 10 wooden boxes with dimensions of 480 mm length, 300 mm wide and 140 mm high, with cover and a nominal capacity of 5 kg. The producers themselves packed the grapes in the typical way, i.e., with boxes covered with a sheet of paper and grapes accommodated in two layers followed with closing the lids with nails. These boxes were carefully transported to the Laboratory of Mechanical Properties of Biological Materials at FEAGRI-UNICAMP and placed on the benches. During the trial period, the fruits were kept in wooden boxes and the temperature and relative humidity of the room were recorded with hygrothermographer (Oakton, model 37250-10), with averages of 29.8 °C (CV 0.058) and 67% (CV 0.025), respectively. The weight was determined using a MARS digital scale model A1000, with 0.01 g accuracy and 1,000 g capacity.
Daily, two boxes of grapes were randomly chosen, from which three bunches were removed. Subsequently, six berries were taken randomly, being two berries from the upper region, two from the equatorial and two from the lower region of the bunch, with a total of 36 berries. Each berry had the pedicel carefully removed with scissors, as far as possible from the insertion in the berry, to ensure a sufficient length to allow its attachment by the gripping mechanism during the detachment test.
It was performed analysis of variance (ANOVA) (VIEIRA, 1999) using the statistical software ORIGIN 6.1.The difference between means was assessed by the Tukey’s test (p> 0.05) (SENEDECOR, 1980).
Detachment test
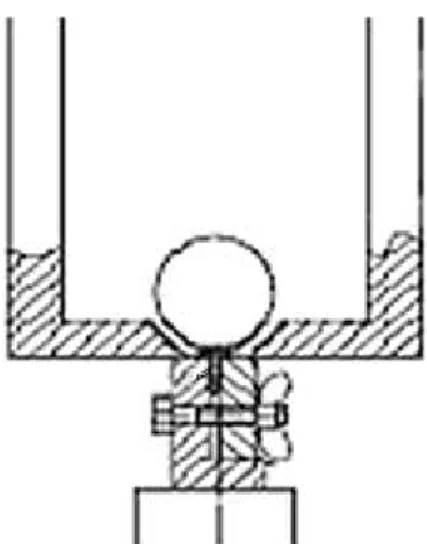
The detachment test consisted of pulling the peduncle until detaching it from the berry by using a device specially designed to accommodate the berries and allow the alignment of the longitudinal axis of the pedicel with the direction of the traction.
FIGURA 2. Schematic illustration of the detachment device for the pedicel of the grape berry showing the gripping claw to the pedicel and the conical surface to accommodate the berry.
After the tests were performed, force-deformation curves were generated in spreadsheet and subjected to careful visual inspection in order to identify regions of similar behavior that would make comparisons possible among all 36 daily runs over the five days of the experiment. Thus, deformations of 0.3; 0.5; 1.0 and 1.2 mm were read, and values of force and daily averages were calculated. The variation of strength with small deformations, 0.3 and 0.5 mm, was studied because it provides relevant information about the mechanical behavior of the tissues over time (FERRAZ et al., 2001).
The average force (N) at a given deformation is proposed as an index of resistance to detachment and was used for comparisons. Another proposed index was given by the average ratios between the maximum force and its corresponding deformation (N mm-1). This index has advantages over the maximum force usually used (GOMES, 2006), since it shows the difference of events occurring at maximum strength to those occurring at different deformations, making the index more meaningful. To apply this index, the tests considered were those that the brush was completely detached from the berry, while those that the brush broke near the insertion into the pad were discarded.
For temporal comparison of mean values of force at a given deformation, the maximum force and the ratio between maximum force and the corresponding deformation were performed through analysis of variance (ANOVA) and Tukey’s tests (p>0.05) (VIEIRA, 1999) using the statistical software ORIGIN 6.1,considering a completely randomized design. The variability of the resistance to deformation indexes was analyzed using the coefficient of variation (SENEDECOR, 1980).
RESULTS AND DISCUSSION
Analysis of force-deformation curve of pedicel detachment
maintenance of the force value. After this accommodation, the tissues offer resistance again (segment 3), roughly displaying a linear relationship between force and deformation. A phase of increasing resistance is followed until it reaches the maximum force at the end of segment 4, with simultaneous disruption of a considerable portion of tissue. This disruption is evidenced by a sharp decline of the force. It is assumed that the maximum force obtained is associated with the separation of the vascular bundles of the seeds inside the berry. At this stage of the detachment, the main connections of brush and pad with the other components of the berry are impaired and the detachment of the pedicel with an intact brush can be completed with little force.
Figure 3 b illustrates schematically the appearance of the assembly formed by the pedicel, pad and intact brush after this type of detachment.
FIGURA 3. Characteristic force-deformation curve of detachment of the pedicel with intact brush (a) and schematic representation of the berry and pedicel with intact brush after detachment in 'Niagara Rosada' grapes.
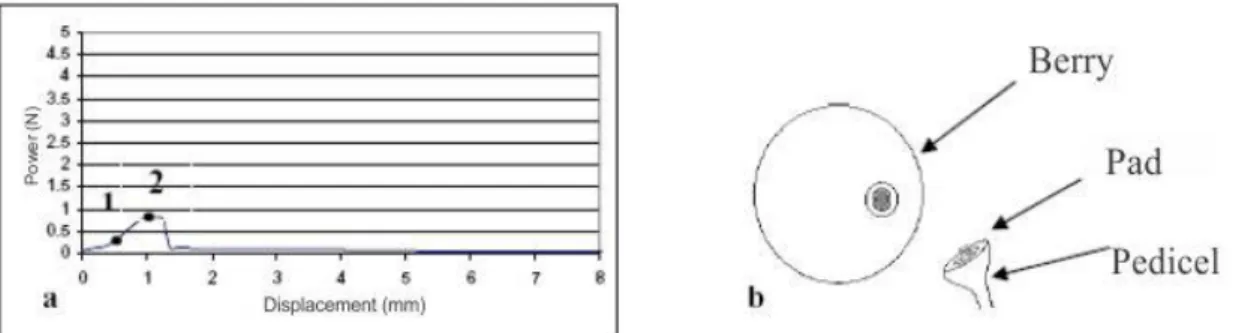
The second type of detachment observed is illustrated by the characteristic force-deformation curve (Figure 4 a) displaying lower force values than the previous type. The segment 1 of the curve is characterized by little resistance during the initial accommodation and the section 2 by the level of force, indicating successive ruptures of tissues. In this type of detachment, the brush remains within the berry (Figure 4 b), indicating that the resistance of the brush connections with the berry tissues is larger than the connections with the pedicel.
FIGURA 4. Characteristic force-deformation curve of detachment of the pedicel with broken brush (a) and schematic representation of the berry and pedicel with broken brush after detachment in 'Niagara Rosada' grapes.
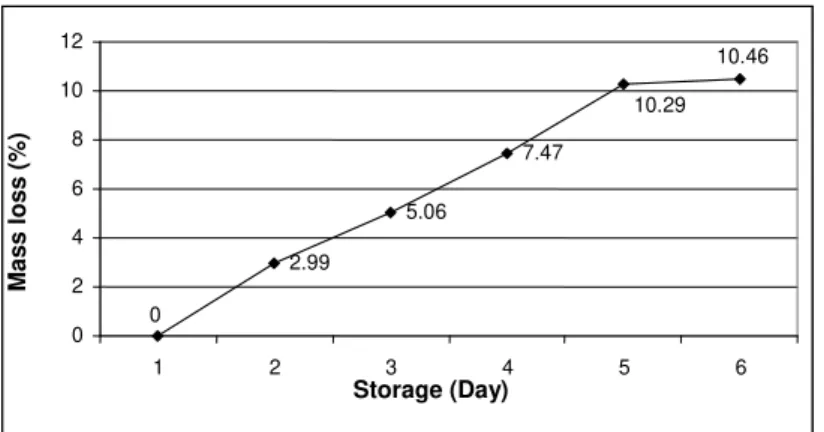
be partially exposed and subject to changes. From the third day of storage, with approximately 5% mass loss, the abscission zone was expanded. Figure 5 illustrates the mass loss during storage.
FIGURA 5. Mass loss during storage at a mean temperature and humidity of 29.8 °C and 67%, respectively.
The inspection of the curves obtained demonstrated to be possible to compare temporal detachment rates for the segments 1 and 2, for both types of detachment. However, the rates associated with maximum force had different meaning for each detachment type and should not be compared.
FIGURA 6. Temporal variation in grapes of mean deformation strengths of 0.3 mm and 0.5 mm.
For greater deformation values, 1.0 and 1.2 mm, which are located at the end of segment 1 of the curve and before the biological flow portion of the segment 2, the differences appeared in the third day (Figure 6). The mean force values for 1.0 mm deformation were significantly different between the first and third, and the third and fifth days of storage, while for the 1.20 mm deformation, the significant differences occurred between the third and fourth days of storage (Tukey, p> 0.05).
FIGURA 7. Temporal variation in grapes of mean deformation strengths of 1.0 mm and 1.2 mm.
2.99 5.06 7.47 0 10.46 10.29 0 2 4 6 8 10 12
1 2 3 4 5 6
Storage (Day) Mas s l oss ( % ) 0.66 0.78 0.79 0.8 0.8 0.43 0.52 0.49 0.5 0.47 0 0.1 0.2 0.3 0.4 0.5 0.6 0.7 0.8 0.9
1 2 3 4 5
Storage (Day) Def. 0,5mm Def. 0,3mm S tre ngth (N) 1.6 1.19 1.79 2.58 2.55 2.43 1.41 1.55 1.74 1.74 0 0.5 1 1.5 2 2.5 3
1 2 3 4 5
Storage (Day)
Def. 1,20mm
Def 1,0 mm
S
tre
ngth
(N
Mean maximum force and ratio between maximum force and corresponding deformation The temporal variation of the mean maximum force and the ratio between maximum force and the corresponding deformation is illustrated in Figure 8. Both of these values showed significant differences from the third to the fourth day (Tukey, p> 0.05).
FIGURA 8. Temporal variation in the grapes of the mean maximum force and the ratio between maximum force and corresponding deformation.
Variability of indices of resistance to detachment
The coefficient of variation for resistance to berry-pedicel detachment rates of 'Niagara' grapes (Table 2) ranged between 19.4 and 55.3% with most of them with values greater than 30.0% considered relatively high (Pimentel Gomes). Throughout the evaluation period, these values showed no trend of increase or reduction, with high values in the first and last days. It is observed that the index values expressed by the maximum force had the lowest mean for coefficient of variation, 24.4%, representing only the variation in force, regardless of the associated deformation value. When the associated deformation (column d) is incorporated to obtain the Fmax/d index, the
mean coefficient of variation increases, reaching a mean value of 33.5%. The maximum force index might be considered the best index to describe the temporal resistance, because it displays the lowest coefficients of variation, with a mean of 24.4%, showing differences in the fourth day. In this case, this conclusion is incorrect, because the index does not include the influence of deformation (d). By incorporating these values to generate the Fmax/d index, it is observed that
despite the increase in mean CV to 33.3%, they discriminate the variations in the fourth day and showed the lowest coefficient of variation. For F(0.5mm),despite showing a mean CV of 28.4%, it
does not discriminate against any temporal variation, thus being no longer useful.
TABELA 2. Coefficient of variation (%) (d) in grapes for indexes of resistance to detachment and deformation at maximum force.
Storage(day) Repetition *Fmáx *d *Fmáx/d *F(0,3 mm) *F(0,5mm) *F(1,0mm) *F(1.2mm)
1 36 19,4 31 31,1 40 31,5 39,3 31,4
2 32 20,9 26,5 32,3 34,2 20,5 32,1 31,7
3 30 23,6 25,1 31,8 43,2 30,7 43,1 45,2
4 27 31 35,5 37,5 33,4 23,3 46,3 49,3
5 27 27,2 36,8 33,8 55,3 35,8 46,9 52,5
Average 24,4 31 33,3 41,2 28,4 41,5 42
*Coefficient of variation for 36 repetitions.
CONCLUSIONS
The disruption of the brush in the insertion of the berry’s pedicel increases over time and is relevant during the storage and marketing of fresh fruits, as it causes the berries to thresh from the
3.21
1.17 2.82
3.64 3.59
3.45
1.16 1.42
1.57 1.32
0 0.5 1 1.5 2 2.5 3 3.5 4
1 2 3 4 5
Storage (day)
Maxp
bunches, with the initial inspection with force-deformation curves being important to establish the limits of investigation of the mechanical behavior in this fruit.
The indexes of pedicel detachment resistance of 'Niagara Rosada' berry grapes do not allow temporal discrimination of senescence in the berry-pedicel junction and consequently of the bunch.
REFERENCES
BARNES, K.K. Detachment characteristics of lemons. Transactions of the ASAE, St. Joseph, v.12,
n.1, p.41-45, 1969.
BRASIL. Instrução Normativa n. 1, de 1o de fevereiro de 2002. Regulamento Técnico de Identidade e de Qualidade para a Classificação dos produtos a seguir: abacaxi,uva fina de mesa, uva rústica. Diário Oficial da União, Brasília, DF, 4 fev. 2002.Seção 1, p.2.
CHITARRA, M.I.F.; CHITARRA, A.B. Pós-colheita de frutos e hortaliças: fisiologia e manuseio.
Lavras: ESALFAEPE, 1990. 320 p.
CATI – COORDENADORIA DE ASSISTÊNCIA TÉCNICA INTEGRAL. Mapas de produções agrícolas do estado de São Paulo, Campinas, 2001.
CHEN, F.H.; YU, X.; ZHANG, W.Y.; TAN, D.Y. Study on relationship between pedicel structure and berry abscission of Xinjiang Wuhebai grape cultivars, Journal of Xinjiang Agricultural
University, Xinjiang,v.23, p.44–48, 2000.
FERRAZ. A.C.O.; SARGENT. A.; FOX. A.J. A nondestructive method for measuring firmness of blueberry fruit. Proceedings Florida Horticulture Society, v.114, p.138-142, 2001.
GOMES. D. Efeito da vibração na qualidade da uva Niagara Rosada. 2006. Dissertação
(Mestrado) - Faculdade de Engenharia Agrícola, Universidade Estadual de Campinas, Campinas, 2006.
MOHSENIN,N.N. Physical Properties of plants and Animals Material. New York: Gordon and
breach Science Publisher, 1970. v.1, 734 p.
RIBÉREAU-GAYON, J.; PEYNAUD, E. Traitéd'ampélologie: sciences et techniques de la vigne:
biologie de la vigne, sols de vignobles Paris: Dunod, 1980. v.1, p.116-130.
SANTOS, A.H.P.; FERRAZ, A.C. O.; DAL FABRO, I.M. Força de destacamento da vagem do pedúnculo do amendoim. In: CONGRESSO DE ENGENHARIA AGRÍCOLA, 23., Campinas.
Anais...
SNEDECOR, G.W. Statistical methods. 7th ed. Iowa State University, 1980.