1 Recebido para publicação em 3.9.2012 e aprovado em 26.11.2012.
2 Universidade Federal de Pelotas, Pelotas-RS, Brasil, <[email protected]>; 3 Embrapa Trigo Researcher, Passo Fundo-RS, Brasil.
A
DAPTIVEV
ALUE OFR
YEGRASSB
IOTYPES WITHL
OW-L
EVELR
ESISTANCE ANDS
USCEPTIBLE TO THEH
ERBICIDEF
LUAZIFOP ANDC
OMPETITIVEA
BILITY WITH THEW
HEATC
ULTURE1Valor Adaptativo de Biótipos de Azevém com Resistência de Nível Baixo e Suscetível ao
Herbicida Fluazifop e Habilidade Competitiva com a Cultura do Trigo
FRAGA, D.S.2, AGOSTINETTO, D.2, VARGAS, L.3, NOHATTO, M.A.2, THÜRMER, L.2, and HOLZ, M.T.2
ABSTRACT - Ryegrass is the main weed in wheat crop, causing yield loss due to competition by environmental resources. The objectives of this study were to estimate the fitness cost of ryegrass biotypes with low-level resistance and susceptible to fluazifop and to investigate the relative competitive ability of these biotypes between themselves and against the crop. Thus, fitness cost and competitive ability experiments were conducted under greenhouse conditions. For the fitness cost experiments, the low-level resistant ryegrass biotypes and those susceptible to fluazifop were used. For competitive ability, the treatments were arranged in a replacement series, with five proportions of the wheat cultivar FUNDACEP Horizonte and the low-level resistant and susceptible ryegrass biotypes 100:0, 75:25, 50:50, 25:75 and 0:100. Competitive analysis was carried out through diagrams applied to the replacement experiments and use of relative competitiveness indices. Variables evaluated were plant height, in the fitness cost experiment, and leaf area and shoot dry biomass in both experiments. The ryegrass biotypes show overall similar fitness cost and competitive ability. The wheat cultivar FUNDACEP Horizonte is superior in competitive ability to the ryegrass biotype with low-level resistance and equivalent to the susceptible biotype.
Keywords: weed, competition, Lolium multiflorum.
RESUMO - O azevém é a principal planta daninha da cultura do trigo, a qual contribui para a perda de produtividade devido à competição exercida por recursos do ambiente. Os objetivos deste trabalho foram estimar o valor adaptativo de biótipos de azevém com resistência de nível baixo e suscetível ao herbicida fluazifop e investigar a habilidade competitiva relativa desses biótipos entre si e com a cultura do trigo. Para isso, foram realizados experimentos de valor adaptativo e habilidade competitiva em casa de vegetação. Para valor adaptativo, utilizaram-se biótipos de azevém com resistência de nível baixo e suscetível ao herbicida fluazifop. Quanto à habilidade competitiva, os tratamentos foram arranjados em série de substituição, constituindo-se de cinco proporções de plantas de trigo cultivar FUNDACEP Horizonte e biótipos de azevém com resistência de nível baixo e suscetível: 100:0, 75:25, 50:50, 25:75 e 0:100. A análise da competitividade foi efetuada por meio de diagramas aplicados a experimentos substitutivos e uso de índices de competitividade relativa. As variáveis avaliadas foram estatura, no experimento de valor adaptativo, e área foliar e matéria seca da parte aérea, em ambos. Os biótipos de azevém apresentam, em geral, valor adaptativo e habilidade competitiva similares. O trigo cultivar FUNDACEP Horizonte apresenta habilidade competitiva superior à do biótipo de azevém com resistência de nível baixo e equivalente à do suscetível.
INTRODUCTION
Wheat is one of the most important cereals for human consumption worldwide, together with rice and corn. In 2011/12, the area cultivated with wheat in Brazil was 2,125 thousand hectares, with production of 5,414 thousand tons and productivity of 2,547 kg ha-1 (Conab, 2012). This productivity results especially from the use of cultivars with high yield potential, the appropriate use of inputs and adoption of technology. However, productivity is below that achieved in the areas of research, and this is, in part, due to the unsatisfactory control of weeds, which cause damage to the quantitative and qualitative production of wheat (Paula et al., 2011).
Among the various weeds that infest the wheat crop is the kind Lolium multiflorum
(ryegrass). This species presents resistance to six chemical groups of herbicides in the world and, in Brazil, is resistant to inhibitors of the enzymes 5-enolpyruvylshikimate-3-phosphate synthase (EPSPs), acetolactate synthase (ALS) and acetyl Coenzyme A carboxylase (ACCase) (Heap 2012). Ryegrass is an easy dispersion plant, which presents cross-fertilization. It is particularly important for infesting cultures of winter cereals, such as wheat and barley.
The study of the susceptibility of ryegrass biotypes to herbicides, their competitive ability and their mechanisms of adaptation to the environment is key to developing management strategies aiming to control resistant biotypes. The characteristics of biotypes directly affect the rate of development of resistance or even maintenance of the same proportion of resistant plants within the population, when there is absence of selection pressure by the herbicide (Jasieniuk et al. 1996).
To analyze the characteristics of biotypes, growth studies are often used, which detect possible structural and functional differences between biotypes. The most suitable biotypes are often more competitive and capable of increasing its relative proportion over time and thus eliminating individuals less able to occupy a certain ecological niche (Christoffoleti et al. 1997). The competition for environmental resources, imposed to crops by weeds, is among the factors that most cause decreases in
productivity. Competition occurs when one or more resources necessary to its development and growth (water, light and nutrients) are limited to meet the needs of all individuals present in the environment (Radosevich et al., 2007), and the growth rate is an important variable in predicting situations of competition between plants. To determine the competitive interactions between weeds and crops, several types of experiment have been used, especially those in replacement series, enabling the study of inter- and intraspecific competition. The premise of this type of experiment is that the yields of mixtures can be determined compared to monoculture (Cousens, 1991).
Studies on crop competitiveness with weeds allow the development of strategies for their management, since they can define the characteristics that confer greater competitive ability of crops. Cultivars with higher increase speeds of leaf area, height, shoot dry matter, increased soil coverage and light interception by the canopy showed greater competitive ability with weeds (Fleck et al., 2003).
Knowledge of adaptive value and competitive ability among species of wheat and ryegrass allows the understanding of competitive interactions and makes it possible to develop more efficient practices in weed management. Thus, the hypotheses of this work are that the susceptible biotype presents adaptive value and competitive ability equal to the biotype with of low-level resistance, and the wheat, competitive ability superior to that of ryegrass biotypes.
The objectives of this study were to estimate the adaptive value of ryegrass biotypes with low-level resistance and susceptible to the herbicide fluazifop and to investigate the relative competitive ability of these biotypes among themselves and with the wheat culture, by means of experiment in substitution series.
MATERIAL AND METHODS
performed by soil analysis, as recommended for the crop.
The first study to determine adaptive value, comparing the biotypes of ryegrass with low-level resistance and susceptible to the herbicide fluazifop, was conducted in completely randomized design with four replications.
The treatments consisted of plants of the biotypes with low-level resistance and susceptible to the herbicide fluazifop (evaluated in a preliminary experiment) and nine sampling periods (10, 20, 30, 40, 50, 60, 70, 80 and 90 days after emergence - DAE). The variables evaluated in each period were: plant height (HEI), leaf area (LA) and shoot dry matter (SDM). The HEI was determined with the aid of a millimeter ruler, measuring the distance from the ground to the point of insertion of the last leaf. After cutting the plants at ground level, the AF was measured through a meter Model LI 3100C. SDM was quantified by weighing the shoots after being dried in an oven with forced air circulation at 60 oC, until constant weight.
The data obtained were analyzed for normality (Shapiro-Wilk test) and later subjected to variance analysis (p≤0,05). If a statistical significance was verified, a regression analysis was held for the factor of evaluation times, for all variables, using the exponential model.
y = a.eb.x
where: y = response-variable of interest;
x = number of days accumulated, e = exponential function, and a and b = estimated parameters of the equation, a being the difference between the maximum and minimum points of the variable and b and the slope of the curve.
To assess the competitive ability between ryegrass and wheat crops, were performed a study consisting of two experiments. The first, with monocultures of wheat and ryegrass, aimed to determine the population of plants (m-2) from which the shoot dry matter (SDM) (g) per unit area (m-2) becomes independent from the population, according to the “law of constant final production” (Radosevich et al., 1997). The experiment was conducted in a completely
randomized design with three replications. Populations tested were 2, 4, 8, 16, 32, 64 and 128 plants pot-1 (equivalent to 83, 166, 332, 664, 1,328, 2,656 and 5,312 plants m-2). Seeds of wheat cultivar FUNDACEP Horizonte and ryegrass susceptible and with low-level resistance to the herbicide fluazifop.
The variable SDM was quantified at 60 DAE in the same manner as described above. In the data analysis, the reciprocal production was used to determine plant population where SDM becomes constant. The population where the SDM became independent of the plants population, in the average species, was of 1,992 plants m-2 (data not shown).
The second experiment was conducted in a replacement series, with a population of 48 plants per plot (equivalent to 1,992 plants m2), determined in the monoculture experiment. The experimental design used was completely randomized with four replications. The treatments consisted of proportions of ryegrass biotypes susceptible and with low-level resistance to the herbicide fluazifop and the wheat cultivar FUNDACEP Horizonte. The proportions tested were: 100:0 (cultivar pure stand), 75:25, 50:50, 25:75 and 0:100% [ryegrass biotype pure stand (low-level resistance or susceptible)]. Sowing was done on density greater to the populations desired in each treatment, and at 10 DAE a buffing was carried out to remove excess plants.
the unity (1) (straight line), there is competition for the same resources; and if it is greater than 1 (convex line), the competition is avoided. If the PRT is less than 1 (concave line) mutual growth damage occurs (Cousens, 1991; Radosevich et al. 2007).
The indices of relative competitiveness (CR), relative clustering coefficient (K) and competitiveness (C). The CR represents the comparative growth of the species X over Y; K indicates the relative dominance of one species over another; and C indicates which of the species is more competitive. Thus, indices CR, K and C indicate which species manifests itself as more competitive, and their joint interpretation indicates species competitiveness more surely (Cousens, 1991). The species X is more competitive than Y when CR > 1, Kx > Ky e C > 0; on the other hand, the species Y is more competitive than X when CR < 1, Kx < Ky and C < 0 (Hoffman & Buhler, 2002). To calculate these indices, proportions of species by 50:50 were used, using the following equations: CR = PRx/PRy; Kx = PRx/ (1-PRx); Ky = PRy/(1-PRy); C = PRx - PRy (Cousens & O’Neill, 1993).
The procedure for the statistical analysis of productivity or relative variation includes calculating the differences in the values of PR (DPR) obtained in proportions of 25, 50 and 75% in relation to the values belonging to the hypothetical line at the respective proportions (Bianchi et al., 2006). The t test was used to evaluate the differences in the indices DPR, PRT, CR, K and C (Roush et al., 1989; Hoffman & Buhler, 2002). It was considered as null hypothesis, in order to test the differences in DPR and C, that the means were equal to zero (Ho = 0); for PRT and CR, that the means were equal to 1 (Ho = 1); and, for K, that the means of the differences between Kx e Ky were equal to zero [Ho = (Kx - Ky) = 0]. The criterion used for the PR and PRT curves different from hypothetical lines was that, at least in two proportions, significant differences occurred by t test (Bianchi et al., 2006). Similarly, for the CR, K and C indices, the existence of differences in competitiveness was considered when in least two of them, there was a significant difference by t test.
The results obtained, expressed as mean values per treatment, were subjected to
analysis of variance by F test (p≤0.05) being significant, the treatment means were compared by Dunnett’s test, considering the monocultures as witnesses (p≤0,05).
RESULTS AND DISCUSSION
For the study of adaptive value, the Shapiro-Wilk test proved not to be necessary for the transformation of data. There was an interaction among biotypes and evaluation times for the variables HEI and LA, while for the variable SDM there was only the effect of sampling times.
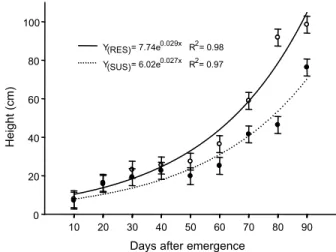
The variables studied (HEI, LA and SDM) set the exponential equation of two parameters; the values of the coefficient of determination (R2) ranged from 0.93 to 0.99, demonstrating satisfactory fit of the data to the model (Figures 1, 2 and 3). From the analysis of the arrangement of the curves, an exponential increase was observed in plant HEI as for the advancement of the evaluation period (Figure 1). The behavior of biotypes was similar, considering the exponential coefficient of equations; of the biotype with low-level resistance, compared to the susceptible, showed higher plant height from 60 DAE.
The height is an important morphological feature that interferes with competition for
The points represent the mean values of replications between biotypes, and the bars, the confidence intervals of the mean.
Regarding LA, there was an exponential increase with the advancement of the evaluation time (Figure 2). The behavior of biotypes was similar, considering the exponential coefficient of equations; of the biotype susceptible, compared to the low-level resistance, showed higher LA at the two last evaluation times. The LA is directly related to the photosynthetic capacity and light interception, interfering in competition with other plants.
As for the MSPA variable, there was an exponential growth with the advancement of evaluation periods, and a slow dry matter production was observed until 50 DAE, with a peak after 60 DAE (Figure 3). This behavior is possibly related to the number of tillers emitted by the plant.
The dry matter variable brings relevant information about the competition between plant species. Individuals with higher dry matter accumulation in the shortest time demonstrate greater skill when in competition (Radosevich et al., 2007). In general, plants which produce more dry matter cause reduction in environmental resources, which may result in suppressing the growth of surrounding plants (Fleck et al. 2006).
Comparing the variables studied, it was found that the biotype with low-level resistance had higher HEI; the susceptible biotype, higher LA; and they did not differ in relation to the SDM. These results may be due to genetic characteristics or from their place of origin, as discussed earlier. This inference is relevant when seeking strategies for the management of resistance, since if the low-level resistance biotype does not differ from the susceptible biotype, practices such as reverse selection become ineffective.
Studies have shown that weed biotypes resistant to sulfonylurea and imidazolinone (ALS inhibitors) do not show differences in adaptability compared to the susceptible biotype (Christoffoleti et al., 1997). On the other hand, the ryegrass biotype susceptible to the glyphosate herbicide produced an amount of dry matter greater than the resistant biotype (Vargas et al. 2005).
In the field, the dominance of the resistant over the susceptible has been observed, which
The points represent the mean values of replications between biotypes, and the bars, the confidence intervals of the mean.
Figure 2 - Leaf area of Lolium multiflorum biotypes with low-level resistance and susceptible to the herbicide fluazifop, evaluated from 10 through 90 days after emergence.
The points represent the mean values of replications between biotypes, and the bars, the confidence intervals of the mean.
Figure 3 - Shoot dry matter of Lolium multiflorum biotypes with low-level resistance and susceptible to the herbicide fluazifop, evaluated from 10 through 90 days after emergence.
stems from the high selection pressure caused by the constant elimination of susceptible plants due to the repeated use of the same herbicide (Silva & Silva, 2007). Few studies are related to biotypes with low-level resistance, so there is a need to develop new works, comparing a larger number of biotypes for physiological, biochemical and genetic characteristics, in order to clarify the possible relationship between these characteristics and its response to ACCase inhibiting herbicides, eliminating even the possible influence of the place of origin of biotypes in the results.
For the experiment of competitive ability of low-level resistance and susceptible ryegrass biotypes among themselves and with wheat in replacement series, the normality test proved not to be necessary to transform the data.
The graphical analysis of the results obtained for PR, for the variables LA and SDM, showed that overall wheat was more competitive than with low-level resistance and susceptible ryegrass biotypes, the wheat PR being represented by a convex line and the ryegrass biotypes being represented by a concave line (Figures 4 and 5). In both cases there was a benefit to the culture and damage to the competitor; the competition occurred for the same environmental resources, which were used more efficiently by the culture. For ryegrass biotypes competing with each other, the results of the PR for the variables LA and SDM proved to be equivalent, since the estimated lines were similar to hypothetical ones, that is, ryegrass biotypes exploit the same ecological niche (Figure 6).
Considering that, in order to be significant, at least two ratios should differ, PR deviations were observed in the culture, in competition with the biotypes, only for the variable SDM in the proportions of 50:50 and 25:75, compared with their hypothetical lines (Table 1). For the PR of both ryegrass biotypes, in competition with the culture or competing between themselves, the ratios had not presented differences in the evaluated variables.
With respect to the PRT, the graphical analysis showed mixed results (Figures 4, 5 and 6), but there was no difference between the expected and estimated values for any
Empty circles () represent the PR of the susceptible biotype; filled circles (•), the PR of wheat; and triangles () indicate the
PRT. Dashed lines refer to the relative hypothetical productivities, when there is no interference from one species over another.
Figure 4 - Relative productivity (PR) and total (PRT) for the leaf area and dry matter of wheat plants and susceptible ryegrass.
variable studied (Table 1). When PRT values are equal to 1, corresponding to the straight line, there is competition for the same resources. This demonstrates that biotypes interact for the same resources available in the environment, but one uses these resources more efficiently than the other. This behavior shows that one biotype is more competitive than the other and contributes more than expected to the overall productivity of the association (Radosevich, 1987).
the lines of PR for wheat obtained convex behavior, and those of the susceptible biotype, concave behavior in both variables (Figure 4). A similar behavior was observed in the competition of wheat and ryegrass with low-level resistance (Figure 5).
Assessing the competition between beggarticks biotypes resistant and susceptible to ALS inhibitors, it has been observed, in general, that there was no difference in the competitive ability among biotypes
(Lamego et al., 2011). In that same vein, studies of competitive ability between Cyperus
difformis biotypes resistant and susceptible to
ALS inhibitors and in competition with rice showed that these biotypes have equal competitive ability, while rice cultivation showed superior competitive ability to the biotypes (Dal Magro et al., 2011).
As for the morphological variable LA, there was no difference between the culture and the weed, regardless of the ryegrass biotype and
Empty circles () represent the PR of the low-level resistance biotype; filled circles (•), the PR of wheat; and triangles ()
indicate the PRT. Dashed lines refer to the relative hypothetical productivities, when there is no interference from one species over another.
Figure 5 - Relative productivity (PR) and total (PRT) for the leaf area and dry matter of wheat plants and low-level resistance ryegrass.
Empty circles () represent the PR of the susceptible biotype; filled circles (•), the PR of the low-level resistance biotype; and
triangles () indicate the PRT. Dashed lines refer to the relative hypothetical productivities, when there is no interference from one species over another.
the proportion of plants (Table 2). Similarly, the ryegrass biotypes behaved similarly when competing with each other. For the SDM variable, when the culture competed with the susceptible biotype, there was an increase of SDM only in the smallest proportion of wheat plants (25:75), whereas no difference was observed in any combination for the susceptible biotype. When the crop competed low-level resistance biotype, a behavior similar to the competition with the susceptible was observed, presenting differences in associations 50:50 and 25:75. Now the biotype with low-level resistance was significant when in lower proportion (25:75). In turn, the competition of ryegrass biotypes between themselves showed no significant data.
The results show that, in general, for the wheat crop, intraspecific competition is greater (Table 2), that is, the culture prefers to split the niche with other plant species other than the same species, while for the ryegrass
Table 1 - Relative differences in productivity for the variables leaf area and shoot dry matter and total relative yield, in the plant proportions of 75:25, 50:50 and 25:75 of susceptible ryegrass and with low-level resistance to the herbicide fluazifop, competing between themselves and with wheat cultivar FUNDACEP Horizonte
ns Not significant and * significant by t test (p≤0.05). Values in parentheses represent the standard errors of the means.
biotypes, this is independent from the competitor. In a study to verify the competitive ability of barley coexisting with ryegrass, it was found that interspecific competition is less harmful to both species involved than intraspecific competition (Galon et al., 2011). Similar results occurred with wheat in competition with ryegrass (Rigoli et al., 2008).
Table 2 - Response of ryegrass biotypes susceptible and with low-level resistance to the herbicide fluazifop competing between themselves and with wheat cultivar FUNDACEP Horizonte
ns Not significant and * significant compared to the respective control (100%) by Dunnett’s test (p
≤0.05).
Table 3 - Competitiveness indices between ryegrass biotypes susceptible and with low-level resistance to the herbicide fluazifop competing between themselves and with wheat cultivar FUNDACEP Horizonte, expressed by relative competitiveness (CR) and relative clustering (K) and competitiveness (C) coefficients
1/ Leaf area; 2/ Shoot dry mass; 3/ Kt – wheat; Kas – susceptible ryegrass; e Kar – low-level resistance ryegrass; ns Not significant and * significant by t test (p≤0,05). Values in parentheses represent the standard errors of the means.
Study showed that, generally, the culture is more competitive than the weed, because the effect of weeds is not only due to its greater individual competitive ability, but mainly to the total population of plants (Vilá et al., 2004). However, the crop is not always in advantage when in competition among species of the same family or between individuals of the same species. Red rice, although belonging to the same species, shows superiority in competition with cultivated rice (Pantone & Baker, 1991).
Studies related to the competitiveness of the wheat crop and the different ryegrass biotypes are still limited. Thus, research becomes useful to identify the ideal population of weeds to make the control decision, since this will not cause negative interference on the culture.
Biotypes of ryegrass with low-level resistance and susceptible to the herbicide fluazifop presented similar adaptive value. Intraspecific competition is more harmful for the wheat culture. The wheat cultivar FUNDACEP Horizonte presents superior competitiveness to that of ryegrass biotypes, while ryegrass biotypes between themselves have equivalent competitive ability.
LITERATURE CITED
BIANCHI, M. A. et al. Proporção entre plantas de soja e plantas competidoras e as relações de interferência mútua. Ci. Rural, v. 36, n. 5, p. 1380-1387, 2006.
CHRISTOFFOLETI, P. J. et al. Growth analyses of sulfonylurea - resistant and susceptible kochia (Kochia scoparia).Weed Sci., v. 45, n. 5, p. 691-695, 1997.
COMPANHIA NACIONAL DE ABASTECIMENTO – CONAB. Acompanhamento da safra brasileira – Grãos – Terceiro levantamento – 2011. Disponível em: <http:// www.conab.gov.br>. Acesso em: 8 jan. 2012.
COUSENS, R. Aspects of the design and interpretation of competition (interference) experiments. Weed Technol., v. 5, n. 3, p. 664-673, 1991.
COUSENS, R.; O’NEILL, M. Density dependence of replacement series experiments. Oikos, v. 66, n. 2, p. 347-352, 1993.
DAL MAGRO, T. et al. Habilidade competitiva entre biótipos de Cyperus difformis L. resistente ou suscetível a herbicidas inibidores de ALS e destes com arroz irrigado. Bragantia, v. 70, n. 2, p. 294-301, 2011.
FLECK, N. G. et al. Características de plantas de cultivares de arroz irrigado relacionadas à habilidade competitiva com plantas concorrentes. Planta Daninha, v. 21, n. 1, p. 97-104, 2003.
FLECK, N. G. et al. Interferência de Raphanus sativus sobre cultivares de soja durante a fase vegetativa de
desenvolvimento da cultura. Planta Daninha, v. 24, n. 3, p. 425-434, 2006.
GALON, L. et al. Habilidade competitiva de cultivares de cevada convivendo com azevém. Planta Daninha, v. 29, n. 4, p. 771-781, 2011.
HEAP, I. Internacional survey of herbicide resistant weeds. Disponível em: <www.weedscience.org>. Acesso em: 25 jan. 2012.
HOFFMAN, M. L.; BUHLER, D. D. Utilizing Sorghum as functional model of crop-weed competition. I. Establishing a competitive hierarchy. Weed Sci., v. 50, n. 4, p. 466-472, 2002.
JASIENIUK, M. et al. The evolution and genetics of herbicide resistance in weeds. Weed Sci., v. 44, n. 1, p. 176-193, 1996.
LAMEGO, F. P. et al. Competitiveness of ALS inhibitors resistant and susceptible biotypes of greater beggarticks (Bidens subalternans). Planta Daninha, v. 29, n. 2, p. 457-464, 2011.
PANTONE, D. J.; BAKER, J. B. Reciprocal yield analysis of red rice (Oryza sativa) competition in cultivated rice. Weed Sci., v. 39, n. 1, p. 42-47, 1991.
PAULA, J. M. et al. Competição de trigo com azevém em função de épocas de aplicação e doses de nitrogênio. Planta Daninha, v. 29, n. 3, p. 557-563, 2011.
PONTES, L. S. et al. Variáveis morfogênicas e estruturais de azevém anual (Lolium multiflorum Lam.) manejado em diferentes alturas. R. Bras. Zootec., v. 32, n. 4, p. 814-820, 2003.
RADOSEVICH, S. R. Methods to study interactions among crops and weeds. Weed Technol., v. 1, n. 3, p. 190-198, 1987.
RADOSEVICH, S. R. et al. Ecology of weeds and invasive plants: Relationship to agriculture and natural resource management. 3.ed. New York: John Wiley & Sons, 2007. 454 p.
RADOSEVICH, S. R. et al. Weed ecology: implications for vegetation management. 2. ed. New York: Wiley, 1997. 589 p.
RIGOLI, R. P. et al. Habilidade competitiva de trigo (Triticum aestievum) em convivência com azevém (Lolium multiflorum) ou nabo (Raphanus raphanistrum). Planta Daninha, v. 26, n. 1, p. 93-100, 2008.
SANCHOTENE, D. M. et al. Manejo químico de plantas daninhas tolerantes ao glyphosate na cultura da soja. R. Fac. Zootec. Vet. Agron., v. 15, n. 2, p. 77-84. 2008.
SILVA, A. A.; SILVA, J. F. Tópicos em manejo de plantas daninhas. Viçosa, MG: Universidade Federal de Viçosa, 2007. 367 p.
VARGAS, L. et al. Alteração das características biológicas dos biótipos de azevém (Lolium multiflorum) ocasionada pela resistência ao herbicida glyphosate. Planta Daninha, v. 23, n. 1, p. 153-160, 2005.