ISSN: 1809-4430 (on-line)
_________________________
1 Parte da Dissertação de Mestrado do primeiro Autor
2 Secretaria Municipal de Agricultura, Pecuária, Abastecimento e Meio Ambiente, Vitória Brasil-SP, Brasil. 3 Faculdade de Engenharia de Ilha Solteira-SP, Brasil.
*Corresponding author. E-mail: [email protected]
GEOTECHNOLOGY APPLICATION FOR DATA ACQUISITION FOR
AGRICULTURAL AND ENVIRONMENTAL MANAGEMENT OF THE MUNICIPALITY OF VITÓRIA BRAZIL-SP1
Doi:http://dx.doi.org/10.1590/1809-4430-Eng.Agric.v36n4p 684-695/2016
FÁBIO H. ZANARDO2*, RICARDO A. F. RODRIGUES3, HELIO R. SILVA3,
ARTUR P. MARQUES3, GLAUCIA A. FARIA3
ABSTRACT:The present study aimed at associating geoprocessing procedures for analysis of land use and native vegetation for municipal management, using an easy access and low cost methodology to the public administration of the municipality of Vitória Brazil/SP. Initially, the land use and the land occupation were evaluated, being delimited the municipal hydrographical micro basin and the permanent preservation areas (PPAs). For this purpose, multispectral images of high spatial resolution were used, available by the government partnerships between the City Hall, the state and federal authorities. From the obtained results it was possible to efficiently determine that only 3% of the original vegetation is preserved; the livestock is the main municipal occupation, covering more than 41% of the area; citrus and sugar-cane are also very expressive, occupying, respectively 13% and 7% of the area of the municipality of Vitoria; and around 70% of the municipal PPAs need hydrophilic species for its recovering. These indicators configure a data bank for consulting and supporting the public admiration, as well as a source for the administrative decision making, aiming at guiding the resources for the development of the municipal rural sector, in a more dynamic, efficient and economically viable way.
KEY WORDS:land occupation, remote sensing, hydrographical micro basin.
INTRODUCTION
The Northern region of the State of São has shown environmental problems that contribute to the water resources degradation, such as high susceptibility of soils to erosion associated to agricultural activities without appropriate technical criteria (UGRHI-15, 2014). Moreover, the rapid growth of these activities has contributed for the predominant landscape of native vegetation was gradually replaced by an increasingly devastated, heterogeneous and fragmented landscape as well accelerating the environmental degradation (COELHO et al. 2014).
The intensive exploitation of the soil, by the family agriculture activities, predominantly in this region, has been causing loss of biodiversity, reduction in soil fertility and the intensification of erosive processes. This characteristic is associated with the agricultural economic development implemented in Brazil, which in the last decades has been marked by the intensive use of natural resources without proper planning (VANZELA et al. 2010).
However for the sustainable development of the societies, it is essential to reconcile the use of natural resources with the preservation of the environment beca use the measures to recover and/or minimize the environmental degradation are costly and require great attention from the public power to be applied effectively (FLAUZINO et al. 2010).
Remote sensing is a high potential tool in collecting data on agricultural areas (MOTOMIYA et al. 2012). This tool enables the knowledge of the geographical area, such as monitoring the use and occupation of land in watersheds (GOUVEIA et al. 2013). In addition, geographic information systems associated with remote sensing have been important tools for surveillance of areas of natural vegetation in particular the permanent preservation areas (PPAs).
The preservation of natural vegetation on the riverbanks and around the springs and reservo irs are regulated by law since 1965 (BRAZIL, 1965) when the Forest Code was instituted (DURIGAN et al. 2001) and confirmed by the new Forest Code, effective from 2012. NOWATZKI et al. (2010) mentioned that despite the extensive resolutions for standardization, the PPA's surveys in the Brazilian territory are scarce and irregular. Such fact can be related to the difficulty of mapping the areas in compatible scale with the land management.
Remote sensing and digital image processing techniques were highly effective in the characterization and spatial distribution of forest fragments of the Atlantic Forest, proving to be an accurate and reliable tool to subsidize the decision-making process of the environmental managers (PASSOS et al. 2013). However LAMPARELLI et al. (2008) state that for each map of land use generated by geotechnology, some specific tools should be used to measure the quality of these maps. According to the authors one of the possibilities is to use the error matrix as the starting point for the implementation of a number of technical descriptive and analytical statistics to generate the overall quality score and the concordance coefficient as accuracy measure as thematic classifications.
This study aimed to use low-cost geo-technologies, in agricultural and municipal environmental management.
MATERIAL AND METHODS
The study area was the city of Vitoria Brazil (SP), which has an area of 4,951 hectares and is far 590 km from São Paulo, 151 km from São José do Rio Preto, bordering the following municipalities: Jales, Estrela D`Oeste, Turmalina and Dolcinópolis. It is located in the northwest region of the state, between the coordinates 20° 08'42" and 20° 15'08" south latitude and 50°26'11" and 50° 32'17" west longitude, with an average altitude of 490 meters (VITÓRIA BRASIL, 2013). This municipality belongs to the watershed of the Turvo Grande (UGRHI-15, 2014) being situated in the Urubupungá Complex Influenced Area, which has three power plants with a capacity of power generation of 5,860 MVA (SILVA et al. 2006).
The region of Vitoria Brazil is under the Climate domain Aw, tropical with dry season (KÖPPEN, 1928). The soil belongs to the association Ultisol eutrophic + Ultisol dystrophic or eutrophic + Haplortox (PVA10), according to the map presented by OLIVEIRA et al. (1999).
The methodology was divided into three major stages of study described below. The first stage was to survey and literature review, dedicated to the search for a theoretical base theme selection of reasons to be addressed in the study area. The research of municipal information was conducted with government agencies and related entities at the state and federal level involving
research and collection of material on the region covered by the city of Vitoria Brazil, obtaining
statistical data, census data from the Department of Agriculture and State Supply, from the Coordination of Integral Technical Assistance and Coordination of Agricultural Defense, Forestry Institute, the National Institute for Space Research (INPE), among others, on the municipality and their watersheds.
The second stage consisted of the construction of the georeferenced database with a focus in the city of Vitoria Brazil from data and cartographic information and remote sensing, which were
processed with the gvSIG software support (gvSIG EC, 2013), following the principles of the
SOUZA et al. (2013) methodology.
elevation model of the municipality, SF-22-X-A, which was generated by the project Shuttle Radar Topography Mission (SRTM) and made available by EMBRAPA (MIRANDA, 2005).
It was integrated to the database two RapidEye satellite images from 09/28/2011 and 11/02/2011 with the following scene codes: 2229717_2011-09-28T142944_RE3_3A-NAC_10916192_148316_0 and
2229817_2011-11-02T142428_RE5_3A-NAC_10917989_148318_1.
These data belongs to the collection of the Ministry of Environment were made available to the City Hall of Vitoria Brazil / SP by the "Term of Appointment / Corporate the use of RapidEye Satellite Images". As stated in this document these images can be used for research, planning and the benefit of society, through the aid of the Environmental Planning Coordination (CPLA)
belonging to the Environmental Secretariat of the State of São Paulo (BRAZIL, 2011). The
RapidEye system consists of a constellation of five satellites with high spatial resolution and the possibility of revisits in a daily time scale providing a large number of images of the same site (BLACKBRIDGE, 2015).
In addition it also composed this database two orthorectified aerial photographs obtained in a
survey between 2010 and 2011 with 45 cm GSD (Ground Sample Distance), members of the
“Project Maps São Paulo” which covers the area of study, obtained by the covenant and the images
use commitment with the purpose tool for municipal planning between the local government and the Paulista Company of Metropolitan Planning S.A. (EMPLASA, 2013).
For the extraction of spatial information, it was made the refinement of municipal boundaries contained in the IBGE file and images from the Rapid Eye satellite, then it was vectored manually
the municipal drainage network and its sources.Permanent Preservation Areas (PPA) watercourses
were recorded from the edge of the regular bed rail, so we opted initially for the evaluation of the
PPA’s conservation level of a 30m range around the entire drainage network of the microbasins and
50 m from the springs, according to the Brazilian Forest Code Federal Law No. 12,651; 2012 (BRAZIL, 2012a) and included under the Law No. 12,727; 2012 (BRAZIL, 2012b). Thus, with the
tools “bioprocesses managers”, these PPAs were created. Later with the SRTM data the delimitation of municipal watersheds were realized.
The preliminary survey of the soil use and occupation, occurred through unsupervised
classification (clustering algorithm) present in the gvSIG, being generated and identified several
thematic classes, which were then used as parameters to limit the spectral samples selected in the processing of supervised classification, resulting in a preliminary classification with the following soil cover classes: Native Vegetation, Floodplains shrubby formation, Wetland Herbaceous Vegetation, Complementary area, Bodies of water, Pasture, Citrus, Sugarcane, Perennial Crops, Commercial Reforestation, Grapevine, Annual Culture, Area of Public Utility, Urban Perimeter, PPA Area of influence, Rubber tree, Eucalyptus, Sanitary Landfill, Treatment Pond, Cemetery, and Municipal Small farm. To validate the data, checks were carried out in the field in November and December 2013 with the aid of a GPS navigation receiver, of digital camera, and during the visits informal questions were asked, an unstructured questionnaire, to local residents, in a convenient manner during the checks in the study area, the main questions corresponded if the interviewee remembered what was the use of the soil during the period of the satellite passage (09/28/2011 and 11/02/2011), and if the occupation corresponded with the class found in the classification. It has also been informed opinions on the local environmental conditions, among them, with respect to natural resources such as water availability over time. The data collected helped in generating the final classification of the municipal soil coverage, being delineated manually each thematic class found.
The accuracy of the soil used classes and occupation, generated by the supervised classification of the RapidEye satellite image was evaluated by the Global Accuracy metrics (GA) and Kappa Index from 36 samples randomly distributed by the municipality of Vitoria Brazil, checked in the field and organized in the form of spreadsheet, considering the soil used class and
reference) at these points was drawn the Error Matrix, calculated the values of the Kappa index, the Global Accuracy and the errors of omission and commission, used to give the size of the classification accuracy .
The Global Accuracy Index (total) (GA) was calculated by the number of pixels classified correctly (diagonal of matrix errors) divided by the total number of pixels of the reference image. And the Kappa index ( ) was generated as ((CONGALTON & GREEN, 1999). The classification
was made according to FONSECA (2000), where K ≤ 0.2 (very poor); 0.2 ≤ K ≤ 0.4 (reasonable);
0.4 ≤ K ≤ 0.6 (good); 0.6 ≤ K ≤ 0.8 (very good); 0.8 ≤ K ≤ 1.0 (excellent).
RESULTS AND DISCUSSION
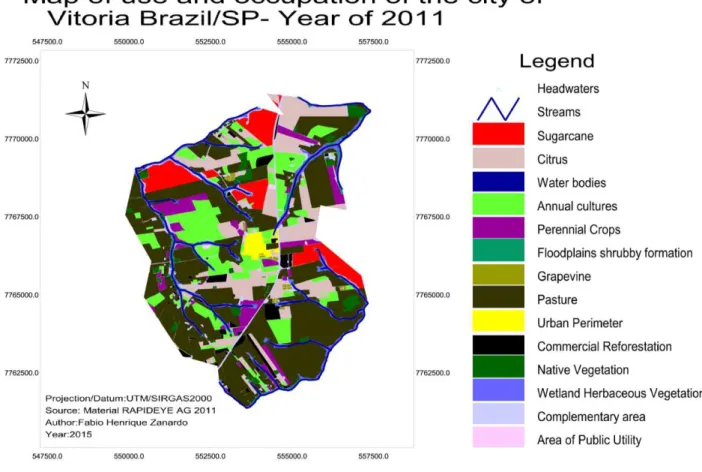
The results obtained in the final classification of the soil use and occupation (Figure 1) s how
that there are in Vitória Brazil 14 distinct thematic classes, as follows: “Native vegetation” are the
natural vegetation fragments, also called Forest Remnants and correspond to natural forests formations that have less anthropic interference and greater ability to protect part of its original
biodiversity (SOS MATA ATLANTICA, 2014). “Floodplains shrubby formation” covers a
vegetation category named floodplain vegetation, formation that occurs along the waterways, showing bushes with canopies that stand out from the others (SAO PAULO, 2009). They also
identified the “Wetland Herbaceous Vegetation” class; this class was considered by the fact of
requiring special native species that are tolerant to waterlogging in planning the PPAs
environmental recovery. Another identified class was the “Complementary area”, this area
considered without agricultural activity, or area where there are carriers, roads, improvements and
other uses that did not intend the soil vegetal exploration. It was also identified “Water bodies”
class where are covered by dams and other water features. The Class “Pasture” covers the areas of
activity of the municipal livestock. For the discrimination of the main agricultural activities in the
municipality were constituted the classes related to the most economically important crops, “Citrus”
and “Sugarcane” and created the “Perennial Crops” class which includes the banana, annatto,
mango, coffee crops, orchards with cashew, litchi, coconut, among others. The “Commercial
Reforestation” class is the arboreal formations of rubber and eucalyptus. The “Grapevine” class
represents agricultural activities conducted in this system, such as vine, passion fruit, zucchini,
chayote, loofah, among others. The “Annual Culture” class represents the cultures of corn, soybean,
grass for seeds and other temporary annual activities. Finally the classes found that do not fit in the
other such as the “Area of Public Utility” places of public use as the sanitary landfill, the sewage
treatment plant, the cemetery and the municipal little farm. Ending with the “Urban Perimeter”
FIGURE 1. Map of use and occupation of the city of Vitoria Brazil/SP-2011.
(Source: Author's research data, prepared by the © RapidEye AG from 2011 materials (All rights reserved) of the covenant between the Ministry of Environment (ME) with the City of Vitoria Brazil / SP for purposes of research and municipal planning)
The confusion matrix, shown in Table 1, shows the classes that are confusing among them.
TABLE 1. Confusion matrix generated from sample data and from the RapidEye image
classification.
Thematic Image classification (m²)
WB AC PC NR HG PT VG Total
WB 8561.10 8561.1
AC 1020057.97 1020057.97
PC 73353.31 19488.41 7381.13 100222.85
RN 2614.21 36778.25 5012.53 44404.99
HG 16992.02 6424.62 46402.41 76519.24 146338.29
PT 42716.75 42716.75
VG 40323.32 40323.32
Total 8561.1 1037049.99 82392.14 36778.25 65890.82 119235.99 52716.98 1402625.27
(Source: Author's research data)
The calculations of the errors of omission and commission, the producer, consumer, global accuracies and kappa index calculated for the categories from the supervised classification of the
soil use and occupation of RapidEye image in 36 points distributed are shown in Table 2.
Global accuracy and the Kappa index were about 90% and 79% respectively. The accuracy
The data showed producer accuracy values above 73% for six of the seven variables studied and consumer values accuracy above 70% for 6 of them. The best results by category can be seen in Table 2.
TABLE 2. Evaluation of the RapidEye image classification.
Variables Omission Error (%) Commission Error (%) Producer accuracy (%) Consumer accuracy (%)
Water bodies 0.00 000 100.00 100
Annual culture 1.64 0.00 100.00 100.00
Perennial culture 10.97 26.81 73.19 98.36
Native vegetation / Reforestation 0.00 17.18 82.82 89.03
High grass (Cane / forage) 29.58 68.29 31.71 100.00
Pasture 64.17 0.00 100.00 70.42
Wetland vegetation * 23.51 0.00 100.00 35.83
Global Accuracy Indices (%) 90.42 Kappa Index (%) 78.64
(Source: Author's research data). *Floodplains shrubby formation and wetland herbaceous vegetation
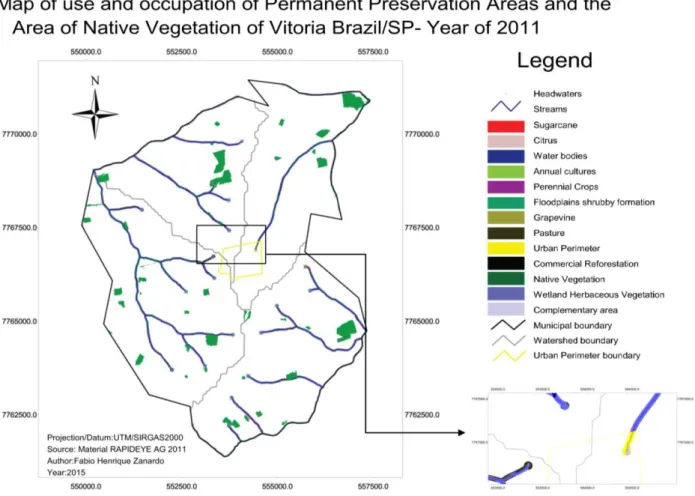
Four main watersheds were delimited (WS) in the city: Cedro Stream, Stream of Helena, Desengano Stream and Veadão Stream (Figure 2).
FIGURE 2. Map of use and occupation of Permanent Preservation Areas and the area of Native Vegetation of Vitoria Brazil.
(Source: Author's research data, prepared by the © RapidEye AG from 2011 materials (All rights reserved) of the covenant between the Ministry of Environment (ME) with the City Hall of Vitoria Brazil / SP )
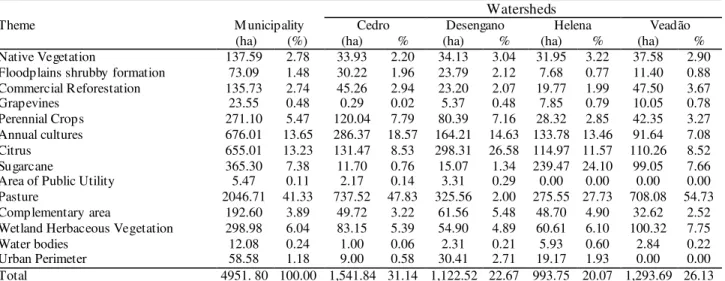
TABLE 3.Distribution of the thematic classes in the watersheds in relation to the total county. Watersheds
Theme M unicipality Cedro Desengano Helena Veadão
(ha) (%) (ha) % (ha) % (ha) % (ha) %
Native Vegetation 137.59 2.78 33.93 2.20 34.13 3.04 31.95 3.22 37.58 2.90 Floodplains shrubby formation 73.09 1.48 30.22 1.96 23.79 2.12 7.68 0.77 11.40 0.88 Commercial Reforestation 135.73 2.74 45.26 2.94 23.20 2.07 19.77 1.99 47.50 3.67 Grapevines 23.55 0.48 0.29 0.02 5.37 0.48 7.85 0.79 10.05 0.78 Perennial Crops 271.10 5.47 120.04 7.79 80.39 7.16 28.32 2.85 42.35 3.27 Annual cultures 676.01 13.65 286.37 18.57 164.21 14.63 133.78 13.46 91.64 7.08 Citrus 655.01 13.23 131.47 8.53 298.31 26.58 114.97 11.57 110.26 8.52 Sugarcane 365.30 7.38 11.70 0.76 15.07 1.34 239.47 24.10 99.05 7.66 Area of Public Utility 5.47 0.11 2.17 0.14 3.31 0.29 0.00 0.00 0.00 0.00 Pasture 2046.71 41.33 737.52 47.83 325.56 2.00 275.55 27.73 708.08 54.73 Complementary area 192.60 3.89 49.72 3.22 61.56 5.48 48.70 4.90 32.62 2.52 Wetland Herbaceous Vegetation 298.98 6.04 83.15 5.39 54.90 4.89 60.61 6.10 100.32 7.75 Water bodies 12.08 0.24 1.00 0.06 2.31 0.21 5.93 0.60 2.84 0.22 Urban Perimeter 58.58 1.18 9.00 0.58 30.41 2.71 19.17 1.93 0.00 0.00 Total 4951. 80 100.00 1,541.84 31.14 1,122.52 22.67 993.75 20.07 1,293.69 26.13 (Source: Author's research data)
The main use of the soil found in this survey was to the pasture area, corresponding to 41% of the municipal area. To VITORIA BRASIL et al. (2010) dairy farming is a remarkable activity for the municipality, and for most of the properties the main complement of income, basically a family activity, and one of the main responsible to keep producers in the field.
According to PETINARI et al. (2008) cattle ranching has great emphasis on family farming in the Rural Development Office Region (RDO) of Jales, both in the maintenance of families in the field and in generating income and jobs. Although it may be noted that the gross value of the production in 2005, the top 10 activities developed in 14 municipalities of this RDO, beef cattle stands out for the first place, and dairy farming follows in the fourth place, accounting for 46% of gross total production, thus demonstrating the importance of this activity in this region.
Analyzing the main crops of economic importance of the municipality, we see that the citrus industry stands out in the local economy, SCAPU data - Survey Census of Agriculture Production Units of São Paulo (SAO PAULO, 2008), show that of the 161 Agriculture Production Units (APUs), 62 of these produced orange, about 38% of all municipal properties, demonstrating the importance of this crop.
In this survey, for the year 2011 were identified 655 hectares of citrus, taking into account the most used density in the region, which is around 290 to 350 plants per hectare, totaling then
between 190,000 to 230,000 citrus plants in the municipality of Vitoria Brazil. This data is
consistent to the one provided by the Agricultural Defense Coordination (A.D.C.) (SÃO PAULO, 2013) for the first half of 2012, which in its databases recorded 194,339 plants.
In relation to the culture of sugarcane, this survey was registered in an area of 365.30 ha in production, this data coincides with the one presented in the Canasat (INPE, 2014).
We identified about 137 ha of native vegetation (Figure 2); this data is relatively close to that provided by the Forestry Institute (SÃO PAULO, 2009) which identified 145 ha of this natural plant formation in the municipality of Vitoria Brazil.
As stated in the “Atlas of forest remnants of the Atlantic Forest period 2011-2012” (SOS MATA ATLANTICA, 2014), were mapped in Vitória Brazil 89 hectares of natural vegetation, with an area more than 5 ha. In this research, we identified eight fragments with areas above 5 ha of native vegetation; together represent 88.2 ha of forest vegetation remnants, a value consistent to that found by the SOS Atlantic Forest.
formations and large tree species with areas greater than 3 ha, representing only 2.1% of the original area, value lower when compared to the average in the present biome of the Atlantic Forest.
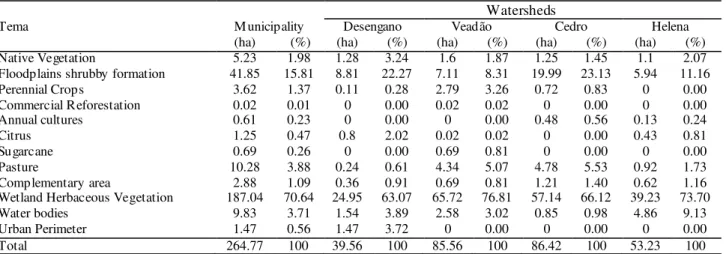
Another important result is the occupation of Permanent Preservation Areas (PPAs) (Figure 2) in the municipality of Vitoria Brazil and the watersheds visualized in table 4. The obtained data show that human occupation in this municipality devastated the natural vegetation, deprotecting the springs. It was found that from 264.77 hectares of PPA's approximately 4% were occupied by pastures, and other crops occupying about 2% of the area.
TABLE 4. Status of the use and occupation of PPA’s in Vitoria Brazil/SP.
Watersheds
Tema M unicipality Desengano Veadão Cedro Helena
(ha) (%) (ha) (%) (ha) (%) (ha) (%) (ha) (%)
Native Vegetation 5.23 1.98 1.28 3.24 1.6 1.87 1.25 1.45 1.1 2.07 Floodplains shrubby formation 41.85 15.81 8.81 22.27 7.11 8.31 19.99 23.13 5.94 11.16 Perennial Crops 3.62 1.37 0.11 0.28 2.79 3.26 0.72 0.83 0 0.00 Commercial Reforestation 0.02 0.01 0 0.00 0.02 0.02 0 0.00 0 0.00 Annual cultures 0.61 0.23 0 0.00 0 0.00 0.48 0.56 0.13 0.24
Citrus 1.25 0.47 0.8 2.02 0.02 0.02 0 0.00 0.43 0.81
Sugarcane 0.69 0.26 0 0.00 0.69 0.81 0 0.00 0 0.00
Pasture 10.28 3.88 0.24 0.61 4.34 5.07 4.78 5.53 0.92 1.73 Complementary area 2.88 1.09 0.36 0.91 0.69 0.81 1.21 1.40 0.62 1.16 Wetland Herbaceous Vegetation 187.04 70.64 24.95 63.07 65.72 76.81 57.14 66.12 39.23 73.70 Water bodies 9.83 3.71 1.54 3.89 2.58 3.02 0.85 0.98 4.86 9.13 Urban Perimeter 1.47 0.56 1.47 3.72 0 0.00 0 0.00 0 0.00 Total 264.77 100 39.56 100 85.56 100 86.42 100 53.23 100 (Source: Author's research data)
It was observed that about 70% of the area showed influence of humid area, region that needs tolerant species to soaked soil and flooding for long periods, this range of species are few possibilities in the region according to CRESTANA et al (2004) in his list of more than 600 native species of the state of São Paulo recommended for reforestation, only 7.5% are hydrophilic species tolerant to permanently waterlogged soils, supporting long floods typical of swamp forests.
This is worrying, as the reforestation result in an environment with little heterogeneity, limiting all the rest of the animal chain that will subsequently colonize it.
The shrub vegetation of medium and small size is mainly concentrated in the Streams of Desengano (22%) and Cedro (23%), however, even so has little expression, which is also a
disturbing situation when comparing to the municipal overall 16%. In addition, we verified the
presence of only 2% of natural vegetation within the APP's, all basins showed similar results, with sparse vegetation and no connectivity.
Moreover, the absence of riparian vegetation may be contributing to water erosion and consequent siltation of water bodies, which contributes to reducing the water storage capacity of the Ilha Solteira reservoir, thereby reducing the lifetime of this hydroelectric plant.
Through informal questions, not structured questionnaire to local residents, carried out in an opportune manner during the field visits in the study area, it was reported the supposed occ urrence of environmental problems, such as reducing the availability of water in quantity and quality for agricultural activities such as irrigation and watering of animals, among other factors that cause losses to the owners of Vitoria Brazil.
CONCLUSIONS
According to the results it can be concluded that the map produced from the digital ima ge classification presented accuracy indices considered excellent and only 2.78% of the native vegetation is still preserved; cattle ranching is the main municipal occupation with more than 41% of the area; citrus and sugarcane has great expression in the municipality occupying, respectively, 13.23% and 7.38% of the Vitoria Brazil / SP area; and about 70% of the municipal PPA's required
hydrophilic species for their recovery.Based on the results obtained by the classification of images
and field studies, we realized that the absence of natural vegetation in the PPAs is causing environmental degradation in the municipality. The methodology and the results of this research have shown to be effective and can be used as methodological parameters for consultation and support for decision-making to managers thus plan efficient actions, providing subsidies for the restoration of the environment in the municipality of Vitoria Brazil / SP.
It is noteworthy that through government partnerships, the use of free software and easily accessible data associated with the proposed methodology in this research, it was possible to generate a variety of information that will assist in making municipal decisions and that will benefit the entire society and future generations
REFERENCES
BLACKBRIDGE. Delivering the world. Satellite imagery product specifications. Version 6.1
april 2015. Disponível em:
<http://blackbridge.com/rapideye/upload/RE_Product_Specifications_ENG.pdf>. Acesso em: 17 dez. 2015.
BRASIL. Ministério do Meio Ambiente. São Paulo (Estado). Coordenadoria de Planejamento
Ambiental. Vitória Brasil, Prefeitura Municipal. Material © RapidEye AG de 2011.Brasília, DF,
2011. Disponível em: <http://geocatalogo.ibama.gov.br/>. Acesso em: 15 mar. 2014.
BRASIL. Lei nº 12.651, de 25 de maio de 2012a. Dispõe sobre a proteção da vegetação nativa; altera as Leis nos 6.938, de 31 de agosto de 1981, 9.393, de 19 de dezembro de 1996, e 11.428, de 22 de dezembro de 2006; revoga as Leis nos 4.771, de 15 de setembro de 1965, e 7.754, de 14 de abril de 1989, e a Medida Provisória no 2.166-67, de 24 de agosto de 2001; e dá outras
providências. Diário Oficial [da] República Fede rativa do Brasil, Brasília, DF, 28 maio 2012.
Disponível em: <http://www.planalto.gov.br/ccivil_03/_Ato2011-2014/2012/Lei/L12651.htm>. Acesso em: 15 mar. 2014.
BRASIL. Lei nº 12.727, de 17 de outubro de 2012b. Altera a Lei no 12.651, de 25 de maio de 2012, que dispõe sobre a proteção da vegetação nativa; altera as Leis nos 6.938, de 31 de agosto de 1981, 9.393, de 19 de dezembro de 1996, e 11.428, de 22 de dezembro de 2006; e revoga as Leis nos 4.771, de 15 de setembro de 1965, e 7.754, de 14 de abril de 1989, a Medida Provisória no 2.166-67, de 24 de agosto de 2001, o item 22 do inciso II do art. 167 da Lei no 6.015, de 31 de dezembro
de 1973, e o § 2° do art. 4° da Lei no 12.651, de 25 de maio de 2012. Diário Oficial [da]
República Federativa doBrasil, Brasília, DF, 18 out. 2012. Disponível
em:<https://www.planalto.gov.br/ccivil_03/_ato2011-2014/2012/lei/l12727.htm>. Acesso em: 15 mar. 2014.
BRASIL. Lei nº 4.771, de 15 de setembro de 1965. Institui o novo código florestal. Disponível
em: <http://www.planalto.gov.br/ccivil_03/leis/l4771.htm>Acesso em: 15 mar. 2014.
BRASIL. Lei nº 12.651, 25 de maio de 2012.Disponível
COELHO, V. H. R.; MONTENEGRO, S. M. G. L.; ALMEIDA, C. N.; LIMA, E. R. V.; RIBEIRO NETO, A.; MOURA, G. S. S. Dinâmica do uso e ocupação do solo em uma bacia hidrográfica do
semiárido brasileiro. Revista Brasileira de Engenharia Agrícola e Ambiental, Campina Grande,
v. 18, n. 1, p. 64-72, 2014. Disponível em: <http://www.scielo.br/pdf/rbeaa/v18n1/v18n1a09.pdf>. Acesso em: 15 maio 2014.
CONGALTON, R. G.; GREEN, K. Assessing the accuracy of re motely sensed data: principles
and pratices. Washington: Lewis Publishers, 1999. 137 p.
CRESTANA, M. S. M. et al. (Org.). Florestas:sistemas de recuperação com essências nativas,
produção de mudas e legislações. Campinas: CATI, 2004. 216 p.
DURIGAN, G.; MELO, A. C. G. M.; MAX, J. C. M.; VILAS BÔAS, O. ; CONTIERI, W. A.
Manual para recuperação de matas ciliares do oeste paulista.São Paulo: Páginas e Letras, 2001. 16 p.
EMPLASA - EMPRESA PAULISTA DE PLANEJAMENTO METROPOLITANO. Governo do Estado de São Paulo. Sistema Cartográfico Metropolitano. Projeto Mapeia São Paulo.
Levantamento aerofotogramétrico 2010/11. São Paulo, 2013.
FLAUZINO, F. S.; SILVA, M. K. A.; NISHIYAMA, L.; ROSA, R. Geotecnologias Aplicadas à
Gestão dos Recursos Naturais da Bacia Hidrográfica do Rio Paranaíba no Cerrado Mineiro. Sociedade & Natureza, Uberlândia, v. 22, n. 1, p. 75-91, 2010. Disponível em:
<http://www.scielo.br/pdf/sn/v22n1/06.pdf>. Acesso em: 15 mar. 2014.
FONSECA, L. M. G. Processamento digital de imagens. São José dos Campos: Instituto Nacional
de Pesquisas Espaciais, 2000. 105 p.
GOUVEIA, R. G. L.; GALVANIN, E. A. S.; NEVES, S. M. A. S. Aplicação do índice de transformação antrópica na análise multitemporal da Bacia do Córrego do Bezerro Vermelho em
Tangará da Serra-MT.Revista Árvore, Viçosa, MG, v. 37, n. 6, p. 1045-1054, 2013. Disponível
em: <http://www.scielo.br/pdf/rarv/v37n6/06.pdf>. Acesso em: 15 mar. 2014. GVSIG CE (gvSIGCommunityEdition), 2013. Disponível em:
<http://sourceforge.net/projects/gvsigce/>. Acesso em: 15 mar. 2014.
IBGE - INSTITUTO BRASILEIRO DE GEOGRAFIA E ESTATÍSTICA. Malha municipal
digital. Rio de Janeiro: 2007. Disponível em:
<http://downloads.ibge.gov.br/downloads_geociencias.htm>. Acesso em: 15 mar. 2014.
INPE - INSTITUTO NACIONAL DE PESQUISAS ESPACIAIS. CANASAT. Mapa de cultivo,
na safra 2011. Disponível em: <http://www.dsr.inpe.br/laf/canasat/cultivo.html>. Acesso em: 15 mar. 2014.
KÖPPEN, W.; GEIGER, R. Klimate der e rde. Gotha: VerlagJustusPerthes, 1928.
LAMPARELLI, R. A. C.; CARVALHO, W. M. O.; MERCANTE, E. Mapeamento de semeaduras
de soja (Glycinemax (L.)Merr.) mediante dados MODIS/Terra E TM/Landsat5: um comparativo.
Engenharia Agrícola, Jaboticabal, v. 28, n. 2, p. 334-344, 2008. Disponível em:
<http://www.scielo.br/scielo.php?script=sci_arttext&pid=S0100-69162008000200014&lng=pt&nrm=iso&tlng=pt>. Acesso em: 15 mar. 2014
MIRANDA, E. E. de. (Coord.). Brasil em relevo. Campinas: Embrapa Monitoramento por
Satélite, 2005. Disponível em: <http://www.relevobr.cnpm.embrapa.br>. Acesso em: 15 mar. 2014.
MOTOMIYA, A. V. A.; MOLIN, J. P.; MOTOMIYA, W. R.; BAIO, F. H. R. Mapeamento do
Índice de Vegetação da Diferença Normalizada em lavoura de algodão. Pesquisa Agropecuária
NOWATZKI, A.; SANTOS, L. J. C.; PAULA, E. V. Utilização do Sig na delimitação das áreas de
preservação permanente (APP's) na Bacia do Rio Sagrado (Morretes/PR)Sociedade & Nature za,
Uberlândia, v. 22, n. 1, p. 107-120, abr. 2010. Disponível em:
<http://www.scielo.br/scielo.php?script=sci_arttext&pid=S198245132010000100008&lng=en&nr m=iso>. Acesso em: 15 mar. 2014.
OLIVEIRA, J. B.; CAMARGO, M. N.; ROSSI, M. ; CALDERANO FILHO, B. Mapa pedológico
do Estado de São Paulo: legenda expandida. Campinas: Instituto Agronômico, 1999. 64 p. PASSOS, A. L. O.; TEIXEIRA, A. R.; SILVA, A. B. Avaliação das áreas verdes na região
administrativa de Ipitanga, em Salvador (BA), com o uso de geotecnologias. Revista Brasileira de
Cartografia, Rio de Janeiro, n. 65/6, p. 1113-1125, 2013. Disponível em:
<http://www.lsie.unb.br/rbc/index.php/rbc/article/view/752/642>. Acesso em: 15 mar. 2014. PERAZZOLI, M.; PINHEIRO, A.; KAUFMANN, V. Efeitos de cenários de uso do solo sobre o
regime hídrico e produção de sedimentos na Bacia do Ribeirão Concórdia – SC. Revista Árvore,
Viçosa, MG, v. 37, n. 5, p. 859-869, 2013. Disponível em:
<http://www.scielo.br/pdf/rarv/v37n5/08.pdf>. Acesso em: 15 mar. 2014.
PETINARI, R. A; TERESO, M. J. A; BERGAMASCO, S. M. P. P. Aimportância da fruticultura
para os agricultores familiares da região de Jales-SP. Revista Brasileira de Fruticultura,
Jaboticabal v. 30, n. 2, p. 356-360, jun. 2008, disponível em:
<http://www.scientificcircle.com/pt/38082/importancia-fruticultura-agricultores-familiares-regiao-sp/> Acesso em: 15 mar. 2014.
SÃO PAULO (Estado). Coordenadoria de Defesa Agropecuária - C.D.A.Dados da citricultura
paulista, 2013.Disponível em:
<http://www.cda.sp.gov.br/www/gdsv/index.php?action=dadosCitriculturaPaulista>. Acesso em: 15 mar. 2014.
SÃO PAULO (Estado). Instituto Florestal. Sistema de Informações Florestais do Estado de São
Paulo - SIFESP. Quantificação da vegetação natural remanescente para os Municípios do
Estado de São Paulo - Legenda IBGE - RADAM - 2009. Disponível em: <http://www.ambiente.sp.gov.br/sifesp/tabelas-pdf/ >. Acesso em: 15 mar. 2014.
SÃO PAULO (Estado). Secretaria de Agricultura e Abastecimento. Coordenadoria de Assistência
Técnica Integral. Instituto de Economia Agrícola. Levantamento censitário de unidades de
produção agrícola do Estado de São Paulo - LUPA 2007/2008.São Paulo: SAA/CATI/IEA, 2008. Disponível em: <http://www.cati.sp.gov.br/projetolupa>. Acesso em: 15 mar. 2014. SILVA, H. R.; ALTIMARE, A. L.; LIMA, E. A. C. F. Sensoriamento remoto na identificação do
uso e ocupação da terra área do projeto “Conquista da Água”, Ilha Solteira – SP, Brasil.
Engenharia Agrícola, Jaboticabal, v. 26, n. 1, p. 328-334, 2006. Disponível em: <http://www.scielo.br/pdf/eagri/v26n1/30124.pdf>. Acesso em: 15 mar. 2014.
SOS MATA ATLÂNTICA; INSTITUTO NACIONAL DE PESQUISAS ESPACIAIS. Atlas dos
re manescentes florestais da Mata Atlântica, período de 2011 a 2012. 2014. Disponível em:<http://mapas.sosma.org.br/>. Acesso em: 15 mar. 2014.
SOUZA, G. F.; GUTIERREZ, L. A. R.; SULEIMAN, H. C.; BARBASSA, A. P.; PARANHOS
FILHO, A. C.; ALBUQUERQUE, J. L. Procedime ntos das rotinas de geoprocessamento para
análise de indicadores ambientais utilizando o software gvSIG. São José do Rio Preto: CBH-TG / DAEE / UFSCar / UFMS / IPT, 2013. 2 v. (Material didático ou instrucional - Transferência de tecnologia, Edital MCT/CNPq/CT-Hidro/ANA N 15/2010).
TRABAQUINI, K.; MIGLIORANZA, E.; FRANÇA, V.; PEREIRA NETO, O. C. Caracterização de lavouras cafeeiras, utilizando técnicas de geoprocessamento e sensoriamento remoto, no
município de Umuarama – PR. Ciência e Agrotecnologia, Lavras, v. 35, n. 1, p. 35-44, jan./fev.
UGRHI -15 - Unidade de Gerenciamento de Recursos Hídricos. Bacia hidrográfica do Turvo Grande. Disponível em: <http://www.grande.cbh.gov.br/UGRHI15.aspx>. Acesso em: 15 mar. 2014.
VANZELA, L. S.; HERNANDEZ, F. B.; FRANCO, R. A. M. Influência do uso e ocupação do solo
nos recursos hídricos do Córrego Três Barras, Marinópolis. Revista Brasileira de Engenharia
Agrícola e Ambiental, Campina Grande, v. 14, p. 55-64, 2010. Disponível em: <http://www.scielo.br/pdf/rbeaa/v14n1/v14n01a08.pdf>. Acesso em: 15 mar. 2014.
VITORIA (Município). Prefeitura Municipal de Vitória Brasil. Dados da Secretaria Municipal de
Agricultura, Pecuária, Meio Ambiente e Abastecimento.2013.
VITORIA. (Município). Prefeitura Municipal de Vitória. Conselho Municipal de Desenvolvimento
Rural. Casa da Agricultura de Vitória Brasil. Escritório de Desenvolvimento Rural de Jales. Plano