DRIS norms for ‘Valencia’ sweet orange on three rootstocks(1)
Francisco de Assis Alves Mourão Filho(2) and João Carlos Azevedo(2)
Abstract – Diagnosis and Recommendation Integrated System (DRIS) applies nutrient ratios instead of the isolated concentration values of each nutrient in interpretation of tissue analysis. The objectives of this research were to establish adequate DRIS norms for ‘Valencia’ sweet orange irrigated commer-cial groves budded on three rootstocks and correlate indexes of nutrition balance with yield. Experi-ments were conducted in São Paulo State, Brazil. Rootstocks Rangpur lime, Caipira sweet orange, and Poncirus trifoliata, with more than six years old and yield above 40 ton ha-1 were utilized. Data re-ferred to yield, tree spacing, rootstock and foliar concentrations of N, P, K, Ca, Mg, S, Fe, Mn, Cu, Zn, and B in non fruiting terminals for each grove were processed for the years 1994 through 1998. DRIS indexes were calculated by Nick criterion for choosing the ratio order of the nutrients and Jones calcu-lation method of the ratio functions. Indexes of nutritional balance calculated from DRIS norms pre-sented high correlation with yield for the three scion/rootstock combinations. DRIS norms defined in this research are valid, since leaf sampling is done on non fruiting terminals and the grove is irrigated. Index terms: citrus, foliar diagnosis, nutrient balance, plant nutrition.
Normas DRIS para laranjeira ‘Valência’ sobre três porta-enxertos
Resumo – O sistema integrado de diagnose e recomendação (DRIS – Diagnosis and Recommendation Integrated System) utiliza relações entre nutrientes em vez da concentração absoluta e isolada de cada um deles na interpretação da análise de tecidos. O objetivo deste trabalho foi estabelecer normas para o método DRIS em pomares comerciais irrigados de laranjeira ‘Valência’ sobre três porta-enxertos e correlacionar os índices de balanço nutricional com a produtividade. Os experimentos foram conduzi-dos no Estado de São Paulo, com os porta-enxertos limão ‘Cravo’, laranja ‘Caipira’ e Poncirus trifoliata, com mais de seis anos, e produtividade acima de 40 t ha-1. Dados de produtividade, espaçamento, porta-enxerto e teores foliares de N, P, K, Ca, Mg, S, Fe, Mn, Cu, Zn e B em ramos não frutíferos, de cada talhão, de 1994 a 1998, foram processados. A escolha da ordem da razão dos nutrientes foi determinada segundo o método Nick, e as funções das razões dos nutrientes foram calculadas de acordo com o método Jones. Os índices de balanço nutricional calculados por meio das normas geradas apresentaram alta correlação com produtividade nas três combinações enxerto/porta-enxerto. As normas DRIS defini-das são aplicáveis desde que a amostragem de folhas seja realizada em ramos não frutíferos e os pomares sejam irrigados.
Termos para indexação: citro, diagnose foliar, equilíbrio nutricional, nutrição vegetal.
(1)Accepted for publication on July 7, 2002.
(2)Escola Superior de Agricultura Luiz de Queiroz, Dep. de
Pro-dução Vegetal, Caixa Postal 9, CEP 13418-900 Piracicaba, SP, Brazil. Bolsista do CNPq. E-mail: [email protected], [email protected]
Introduction
The usual methods for leaf analysis interpretation are based on the comparison of the nutrient concentration with critical reference values (sufficiency range approaches). Concentration values above or below reference values are
DRIS (Diagnosis and Recommendation Integrated System) applies nutrient ratios instead of absolute concentration values of each one for leaf analysis interpretation. DRIS norms have been developed for several field, forest, and horticultural crops, and have been applied as an additional tool for nutritional status diagnosis in the United States, Canada, and China (Lopes, 1998; Hallmark & Beverly, 1991).
Beverly (1987) suggested three modifications in DRIS method and proposed two new methods of diagnosis in ‘Valencia’ sweet orange, already defined in a previous investigation (Beverly et al., 1984). The author emphasized that the logarithmic transformation, population parameters, and use of a single calculation method may reduce systematic errors, simplify the diagnostic method, and extend its applicability. The two new proposed methods use individual nutrient concentration values, instead of ratios.
Investigations by Woods & Villiers (1992), in South Africa, pointed out that DRIS can be successfully applied in nutrient diagnosis of ‘Valen-cia’ sweet orange groves. The authors correlated yield (kg per plant) and quality (fruit mass) with DRIS indexes, working in a database with more than 1,700 observations. DRIS norms were also evaluated in field fertilization trials, and successfully associated with increases in yield and fruit quality.
Cerda et al. (1995) developed DRIS norms for nutrient status diagnosis in ‘Verna’ lemons, cultivated in Murcia and Alicante, Spain. Selected standard population (high-yield population) presented yield equal or above 125 kg per plant. DRIS norms determinations were influenced by scion/rootstock combination and by sampling time. Under high salinity conditions, DRIS was not efficient to indicate if the nutritional deficiency was caused by high salinity or lack of fertilizers.
Rodriguez et al. (1997) developed DRIS norms for ‘Valencia’ sweet orange, considering differences in plant age and in rootstock, in several regions within the four more important States in Venezuela. Standard population was selected in a group of the top-20%-yielding trees. Norms calculated were compared with those previously developed. In ge-neral, the results agreed with previous investigations. The authors suggested that DRIS can be an
economically, fast and reliable alternative to nutrient diagnosis.
In Brazil, investigations about DRIS in citrus are rare. Creste (1996), in ‘Siciliano’ lemon, organized a databank with leaf analysis in fruiting terminals, from plants with different ages, rootstocks and harvest years. Standard populations were grouped according to yield above 80 ton ha-1. After
calculation of DRIS norms, the method was evaluated in field conditions. DRIS was considered an efficient method, especially because it takes into account deficient or excess nutrients in an order of importance.
Santos (1997) utilized a databank of leaf analysis from a N, P, K-fertilization field trial network and commercial groves in São Paulo State to evaluate DRIS. Among three DRIS index calculation methods, the one proposed by Jones (1981) showed more advantages.
Citrus nutritional status can be affected by numerous factors, such as soil and climatic effects, scion/rootstock combination, depth of root system, pests and diseases.
This work focused on the establishment of adequate DRIS norms for ‘Valencia’ sweet orange on three rootstocks, and on the correlation between them and the yield.
Material and Methods
This study was carried out with data from irrigated ‘Valencia’ sweet orange groves budded on Rangpur lime (Citrus limonia L. Osbeck), ‘Caipira’ sweet orange (Citrus sinensis L. Osbeck), and Poncirus trifoliata, over six years old and yield above 40 ton ha-1. Groves were located at a
commercial citrus farm, in Mogi Guaçú, SP, Brazil. Data referred to yield, tree spacing, rootstock and leaf N, P, K, Ca, Mg, S, Fe, Mn, Cu, Zn, and B concentrations in non fruiting terminals of each grove were processed from 1994 through 1998. Leaf sampling was proceeded according to Hanlon et al. (1995).
Leaf analysis and yield data were organized in a large database, classified by grove referential number, rootstock, plant density (number of plants per hectare), leaf sampling and harvest year.
all DRIS indexes (including IDM)irrespective of sign (Nick,
1998).
Population was classified, for each rootstock, according to yield in a decreasing order. Data was analyzed for each year or a combination of years, considering the influence of non nutritional factors affecting yield, such as diseases and the effect of climate on flowering (Mourão Filho et al., 2002). Simulations varying standard (high-yield) population size were performed. DRIS norms and indexes were calculated in each simulation. Adjusted equation, R2,
for each regression analysis was registered. Standard population selected was that which induced the highest R2
in regression analysis.
Results and Discussion
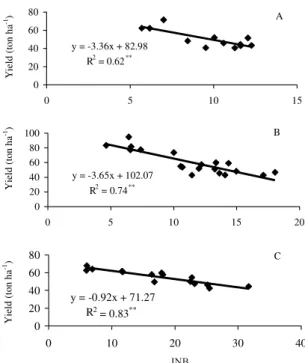
Adjusted equation of INB versus yield of ‘Va-lencia’ sweet orange on Rangpur lime resulted in calculated R2 of 0.62 (Figure 1A). The study
included 12 groves of this scion/rootstock combination with data referred to 1995 leaf sampling and harvest year (Table 1).
Yield of the selected population of ‘Valencia’ sweet orange on Rangpur lime varied from 40.5 to 71.5 ton ha-1, and the reference population presented 62.2
to 71.5 ton ha-1 (numbers 1 through 12). Plant density
did not vary much among population tested (222 to 247 plants per hectare), as well as plant age, which for most groves, varied between 22 and 33 years. Only grove referential number 12 was 11-year-old at the time of study. In general, groves were considered in full production after six years from planting. Considering that all groves were irrigated, and kept under toping and hedging pruning, it is very likely that the root system of an 11-year-old grove already explores all available soil around, for the same spacing, in a similar way as in an older grove. Therefore, these groves were analyzed within the same population.
Selection of the standard population of ‘Valen-cia’ sweet orange on Rangpur lime took into consideration the yield potential of the scion/ rootstock combination. All groves included in the low-yield population were considered with potential to increase yield levels up to those presented by the standard population. Those groves with yield bellow 40 ton ha-1 were not included in DRIS analysis
because non-nutritional factors might have influenced fruit production. Considering the fact that Rangpur lime is very susceptible to Citrus Blight (Castle et al., 1993), the high incidence of this disorder may have played an important role in decreasing yield, especially in those groves older than 20 years.
DRIS norms for ‘Valencia’ sweet orange on Rangpur lime were calculated and are valid for this scion/rootstock combination, since leaf samples are collected in non fruiting terminals and the groves are irrigated.
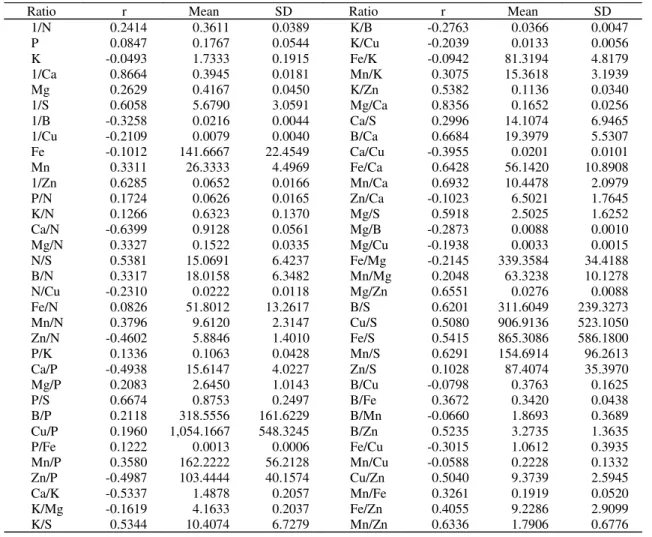
Correlation coefficient values (r) between each pair of nutrient ratios (A/B or B/A) and yield are also reported herein (Table 2). These values were determined from the analyzed populations (standard and low-yield populations), and are useful to verify the influence of each pair of nutrients on yield; the theoretical basis of the r value criterion according to Nick (1998), was applied in this research. The pairs of nutrients with r values over 0.5, irrespective to sign, are 1/Ca, 1/S, Ca/N, N/S, P/S, Ca/K, K/S, K/Zn, Mg/Ca, 1/Zn, B/Ca, Fe/Ca, Mn/Ca, Mg/S, Mg/Zn, B/S, Cu/S, Fe/S, Mn/S, B/Zn, and Mn/Zn.
y = -3.36x + 82.98 R2 = 0.62**
0 20 40 60 80
0 5 10 15
Y
ie
ld (
to
n ha
-1) A
y = -3.65x + 102.07 R2 = 0.74** 0 20 40 60 80 100
0 5 10 15 20
Y iel d ( ton h a
-1) B
y = -0.92x + 71.27
R2
= 0.83**
0 20 40 60 80
0 10 20 30 40
Y iel d ( ton h a -1) C
Figure 1. Adjusted regression equation between indexes of nutritional balance (INB) and yield (ton ha-1) for ‘Valencia’ sweet orange on Rangpur lime (A), Caipira sweet orange (B) and Poncirus trifoliata (C). **Significant at 1% level (F test).
Table 1. Yield, macro and micronutrient concentrations in leaf samples from non fruiting terminals of ‘Valencia’ sweet orange groves budded on the rootstocks (RT) Rangpur lime (RL), Caipira sweet orange (CP), Poncirus trifoliata (TR) utilized for the establishment of DRIS norms according to the grove referential number (NM), plant density in number of plants per hectare (DEN), grove age in years (GA) and leaf sampling and harvest year (HY). Mogi Guaçú, SP, Brazil. 1994, 1995.
NM RT DEN GA HY Yield N P K Ca Mg S B Cu Fe Mn Zn
(ton ha-1) --- (%) --- --- (ppm) ---
1 RL 222 30 1995 40.5 2.56 0.17 1.84 3.28 0.45 0.23 30 79 106 21 26
2 RL 222 30 1995 40.7 3.09 0.17 1.68 3.54 0.39 0.28 44 291 168 26 33
3 RL 222 29 1995 43.0 3.18 0.16 1.61 3.82 0.43 0.28 37 53 166 19 18
4 RL 222 29 1995 43.2 2.70 0.12 1.60 3.57 0.39 0.34 74 121 178 18 17
5 RL 222 30 1995 44.4 2.80 0.16 2.22 3.51 0.38 0.28 39 76 180 30 18
6 RL 222 30 1995 46.0 3.02 0.17 2.45 2.92 0.38 0.22 35 77 135 21 23
7 RL 222 30 1995 48.1 4.02 0.15 2.07 3.46 0.44 0.22 44 215 156 13 18
8 RL 222 30 1995 51.5 3.00 0.18 2.30 2.61 0.42 0.29 41 47 96 16 20
9 RL 222 30 1995 51.9 3.36 0.16 2.30 3.30 0.42 0.28 31 149 175 18 18
10 RL 247 22 1995 62.2 2.91 0.25 1.53 2.56 0.39 0.30 41 75 114 30 13
11 RL 222 33 1995 62.4 3.08 0.16 1.68 2.67 0.38 0.27 40 254 142 20 24
12 RL 247 11 1995 71.5 2.41 0.12 1.99 2.39 0.48 0.10 65 153 169 29 13
13 CP 222 30 1994 42.8 3.32 0.12 1.84 3.98 0.28 0.18 47 43 136 10 16 14 CP 222 30 1995 43.0 2.86 0.16 2.14 3.17 0.39 0.17 38 130 172 14 18 15 CP 222 30 1994 43.0 2.93 0.12 1.91 2.80 0.31 0.21 54 40 145 11 16
16 CP 222 29 1994 45.4 3.32 0.10 1.15 3.26 0.25 0.14 38 49 83 13 14
17 CP 222 30 1994 46.7 3.08 0.12 1.76 3.31 0.30 0.15 44 47 176 10 22 18 CP 222 31 1995 48.3 2.66 0.16 2.22 2.30 0.40 0.18 51 100 158 21 14 19 CP 247 11 1995 51.1 2.95 0.17 2.30 4.41 0.38 0.13 67 195 168 18 21 20 CP 222 31 1995 51.7 3.18 0.16 2.14 3.21 0.33 0.19 37 146 147 20 12 21 CP 222 31 1995 53.7 3.04 0.16 2.07 3.83 0.35 0.18 41 149 150 10 22 22 CP 222 31 1995 54.8 2.76 0.15 2.07 2.24 0.42 0.24 38 156 127 26 13 23 CP 222 31 1995 57.3 3.33 0.16 2.14 3.95 0.40 0.15 44 126 155 21 11
24 CP 313 9 1994 59.1 2.70 0.08 0.92 2.57 0.30 0.17 69 47 126 11 16
25 CP 278 30 1994 59.9 2.84 0.13 1.53 3.51 0.28 0.19 54 70 152 12 14 26 CP 370 14 1995 73.6 2.94 0.17 2.22 3.51 0.47 0.28 43 317 219 26 21 27 CP 370 13 1994 77.1 3.37 0.11 1.30 3.29 0.30 0.19 49 114 107 35 15 28 CP 370 14 1995 77.5 2.27 0.16 2.22 4.05 0.54 0.34 34 200 176 21 22 29 CP 370 13 1994 81.5 2.84 0.09 1.38 2.65 0.28 0.20 35 101 98 28 17 30 CP 370 14 1995 83.4 3.14 0.15 1.68 4.28 0.47 0.28 49 243 152 22 20 31 CP 370 13 1994 94.9 2.77 0.15 1.68 3.95 0.38 0.19 60 187 129 51 14
32 TR 313 6 1994 42.6 2.88 0.14 1.15 3.90 0.49 0.22 52 3 107 35 15
33 TR 247 11 1994 44.4 2.60 0.16 0.61 3.00 0.30 0.15 65 21 66 21 18
34 TR 278 14 1994 46.0 2.84 0.16 1.22 3.15 0.43 0.18 72 30 77 20 14
35 TR 313 12 1994 47.4 2.95 0.15 1.53 3.55 0.47 0.21 36 21 70 17 15
36 TR 313 12 1994 49.5 2.77 0.15 1.30 3.45 0.40 0.18 35 57 78 12 14
37 TR 313 12 1994 49.9 2.91 0.14 1.07 3.10 0.47 0.16 36 49 68 10 17
38 TR 313 11 1994 54.6 2.97 0.15 1.45 3.30 0.38 0.23 33 17 67 19 16
39 TR 556 12 1994 57.7 3.26 0.16 0.99 3.20 0.33 0.16 32 59 81 21 16
40 TR 222 30 1994 57.9 2.65 0.14 1.38 2.89 0.43 0.21 51 71 126 40 18
41 TR 222 32 1994 59.8 3.12 0.17 1.68 3.60 0.34 0.16 56 59 97 26 25
42 TR 222 32 1994 60.6 2.72 0.13 1.53 3.97 0.41 0.17 50 73 124 10 17
43 TR 222 31 1994 61.4 2.74 0.11 1.91 3.06 0.43 020 54 69 123 15 17
Adjusted equation of INB versus yield of ‘Valen-cia’ sweet orange on Caipira sweet orange resulted in calculated R2 of 0.74 (Figure 1B). The study
included 19 groves of this scion/rootstock combination with data referred to 1994 and 1995 leaf sampling and harvest years (Table 1). Yield of the selected population varied from 42.8 to 94.9 ton ha-1, and the standard population was
grouped by those groves with yield between 77.5 and 94.9 ton ha-1 (numbers 13 through 31). Plant
density varied more intensively in this population (222 to 370 plants per hectare), as well as plant age (9 to 31 years). Caipira rootstock, as any other sweet
orange variety, is very susceptible to Phytophthora
(Castle et al., 1993), and this fact may have played an important role in decreasing yield. Younger groves were also those with higher plant densities and presented higher yields. However, as well as already discussed for ‘Valencia’ on Rangpur lime, plant age probably is not an important factor. Considering that the groves are irrigated and kept under pruning, it is likely that a nine-year-old grove already explore all available soil around, for a similar plant spacing, as well as older groves.
Moreover, the cut-off limit of the standard population selected for Caipira rootstock is different
Table 2. Mean and standard deviation (SD) of DRIS norms for ‘Valencia’ sweet orange on Rangpur lime and correlation coefficient (r) between each nutrient ratio pair (A/B or B/A) and yield. Mogi Guaçú, SP, Brazil. 1995.
Ratio r Mean SD Ratio r Mean SD
1/N 0.2414 0.3611 0.0389 K/B -0.2763 0.0366 0.0047
P 0.0847 0.1767 0.0544 K/Cu -0.2039 0.0133 0.0056
K -0.0493 1.7333 0.1915 Fe/K -0.0942 81.3194 4.8179
1/Ca 0.8664 0.3945 0.0181 Mn/K 0.3075 15.3618 3.1939
Mg 0.2629 0.4167 0.0450 K/Zn 0.5382 0.1136 0.0340
1/S 0.6058 5.6790 3.0591 Mg/Ca 0.8356 0.1652 0.0256
1/B -0.3258 0.0216 0.0044 Ca/S 0.2996 14.1074 6.9465
1/Cu -0.2109 0.0079 0.0040 B/Ca 0.6684 19.3979 5.5307
Fe -0.1012 141.6667 22.4549 Ca/Cu -0.3955 0.0201 0.0101
Mn 0.3311 26.3333 4.4969 Fe/Ca 0.6428 56.1420 10.8908
1/Zn 0.6285 0.0652 0.0166 Mn/Ca 0.6932 10.4478 2.0979
P/N 0.1724 0.0626 0.0165 Zn/Ca -0.1023 6.5021 1.7645
K/N 0.1266 0.6323 0.1370 Mg/S 0.5918 2.5025 1.6252
Ca/N -0.6399 0.9128 0.0561 Mg/B -0.2873 0.0088 0.0010
Mg/N 0.3327 0.1522 0.0335 Mg/Cu -0.1938 0.0033 0.0015
N/S 0.5381 15.0691 6.4237 Fe/Mg -0.2145 339.3584 34.4188
B/N 0.3317 18.0158 6.3482 Mn/Mg 0.2048 63.3238 10.1278
N/Cu -0.2310 0.0222 0.0118 Mg/Zn 0.6551 0.0276 0.0088
Fe/N 0.0826 51.8012 13.2617 B/S 0.6201 311.6049 239.3273
Mn/N 0.3796 9.6120 2.3147 Cu/S 0.5080 906.9136 523.1050
Zn/N -0.4602 5.8846 1.4010 Fe/S 0.5415 865.3086 586.1800
P/K 0.1336 0.1063 0.0428 Mn/S 0.6291 154.6914 96.2613
Ca/P -0.4938 15.6147 4.0227 Zn/S 0.1028 87.4074 35.3970
Mg/P 0.2083 2.6450 1.0143 B/Cu -0.0798 0.3763 0.1625
P/S 0.6674 0.8753 0.2497 B/Fe 0.3672 0.3420 0.0438
B/P 0.2118 318.5556 161.6229 B/Mn -0.0660 1.8693 0.3689
Cu/P 0.1960 1,054.1667 548.3245 B/Zn 0.5235 3.2735 1.3635
P/Fe 0.1222 0.0013 0.0006 Fe/Cu -0.3015 1.0612 0.3935
Mn/P 0.3580 162.2222 56.2128 Mn/Cu -0.0588 0.2228 0.1332
Zn/P -0.4987 103.4444 40.1574 Cu/Zn 0.5040 9.3739 2.5945
Ca/K -0.5337 1.4878 0.2057 Mn/Fe 0.3261 0.1919 0.0520
K/Mg -0.1619 4.1633 0.2037 Fe/Zn 0.4055 9.2286 2.9099
from the one chosen for ‘Valencia’ sweet orange on Rangpur lime; in the first yield varied from 77.5 to 94.9 ton ha-1, whereas in Rangpur lime, the maximum
yield of the standard population was 71.5 ton ha-1.
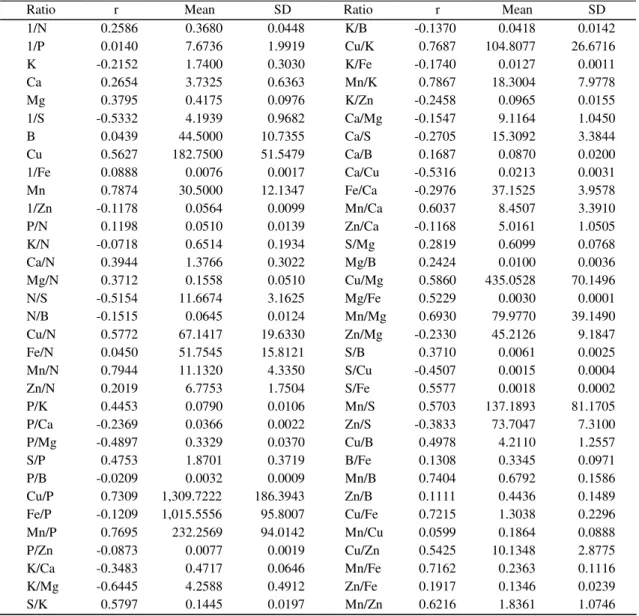
DRIS norms for ‘Valencia’ sweet orange on Caipi-ra sweet oCaipi-range, as well as correlation coefficient values (r) between each pair of nutrient ratios (A/B
or B/A) and yield are also reported (Table 3). The pairs of nutrients with r values over 0.5, irrespective to sign, are 1/S, N/S, Cu, Mn, Cu/N, Mn/N, Cu/P, Mn/P, K/Mg, S/K, Cu/K, Mn/K, Ca/Cu, Mn/Ca, Cu/Mg, Mg/Fe, Mn/Mg, S/Fe, Mn/S, Mn/B, Cu/Fe, Cu/Zn, Mn/Fe, and Mn/Zn (Table 3).
Adjusted equation of INB versus yield of
Ratio r Mean SD Ratio r Mean SD
1/N 0.2586 0.3680 0.0448 K/B -0.1370 0.0418 0.0142
1/P 0.0140 7.6736 1.9919 Cu/K 0.7687 104.8077 26.6716
K -0.2152 1.7400 0.3030 K/Fe -0.1740 0.0127 0.0011
Ca 0.2654 3.7325 0.6363 Mn/K 0.7867 18.3004 7.9778
Mg 0.3795 0.4175 0.0976 K/Zn -0.2458 0.0965 0.0155
1/S -0.5332 4.1939 0.9682 Ca/Mg -0.1547 9.1164 1.0450
B 0.0439 44.5000 10.7355 Ca/S -0.2705 15.3092 3.3844
Cu 0.5627 182.7500 51.5479 Ca/B 0.1687 0.0870 0.0200
1/Fe 0.0888 0.0076 0.0017 Ca/Cu -0.5316 0.0213 0.0031
Mn 0.7874 30.5000 12.1347 Fe/Ca -0.2976 37.1525 3.9578
1/Zn -0.1178 0.0564 0.0099 Mn/Ca 0.6037 8.4507 3.3910
P/N 0.1198 0.0510 0.0139 Zn/Ca -0.1168 5.0161 1.0505
K/N -0.0718 0.6514 0.1934 S/Mg 0.2819 0.6099 0.0768
Ca/N 0.3944 1.3766 0.3022 Mg/B 0.2424 0.0100 0.0036
Mg/N 0.3712 0.1558 0.0510 Cu/Mg 0.5860 435.0528 70.1496
N/S -0.5154 11.6674 3.1625 Mg/Fe 0.5229 0.0030 0.0001
N/B -0.1515 0.0645 0.0124 Mn/Mg 0.6930 79.9770 39.1490
Cu/N 0.5772 67.1417 19.6330 Zn/Mg -0.2330 45.2126 9.1847
Fe/N 0.0450 51.7545 15.8121 S/B 0.3710 0.0061 0.0025
Mn/N 0.7944 11.1320 4.3350 S/Cu -0.4507 0.0015 0.0004
Zn/N 0.2019 6.7753 1.7504 S/Fe 0.5577 0.0018 0.0002
P/K 0.4453 0.0790 0.0106 Mn/S 0.5703 137.1893 81.1705
P/Ca -0.2369 0.0366 0.0022 Zn/S -0.3833 73.7047 7.3100
P/Mg -0.4897 0.3329 0.0370 Cu/B 0.4978 4.2110 1.2557
S/P 0.4753 1.8701 0.3719 B/Fe 0.1308 0.3345 0.0971
P/B -0.0209 0.0032 0.0009 Mn/B 0.7404 0.6792 0.1586
Cu/P 0.7309 1,309.7222 186.3943 Zn/B 0.1111 0.4436 0.1489
Fe/P -0.1209 1,015.5556 95.8007 Cu/Fe 0.7215 1.3038 0.2296
Mn/P 0.7695 232.2569 94.0142 Mn/Cu 0.0599 0.1864 0.0888
P/Zn -0.0873 0.0077 0.0019 Cu/Zn 0.5425 10.1348 2.8775
K/Ca -0.3483 0.4717 0.0646 Mn/Fe 0.7162 0.2363 0.1116
K/Mg -0.6445 4.2588 0.4912 Zn/Fe 0.1917 0.1346 0.0239
S/K 0.5797 0.1445 0.0197 Mn/Zn 0.6216 1.8361 1.0746
cia’ sweet orange on Poncirus trifoliata resulted in calculated R2 of 0.83 (Figure 1C). The study included
16 groves of this scion/rootstock combination with data referred to 1994 sampling year and harvest year (Table 1).
Yield of the selected population varied from 42.6 to 67.8 ton ha-1 and the standard population
presented 62.6 to 67.8 ton ha-1 (numbers 32 through
47). Among scion/rootstock combinations tested, this was the one that presented higher variation in plant density (222 to 556 plants per hectare), even though the very high plant density was observed only in the grove referential number 39. Average grove age also varied (6 to 32 years), and this fact seemed not to be relevant for DRIS norms calculation. It must be pointed out that the younger groves are also those with higher plant densities. Therefore, considering the conditions of this study, younger high-density groves may have the same yield potential as older low-density groves.
Considering the effect of the scion/rootstock combination, selected cut-off limit of standard population of ‘Valencia’ on Poncirus trifoliata was different from the other combinations (Table 1). In this case, yield of standard population varied from 62.6 to 67.8 ton ha-1, much lower than the average
yield in ‘Valencia’ on ‘Caipira’ sweet orange (77.5 to 94.9 ton ha-1), and in ‘Valencia’ on Rangpur lime
(62.2 to 71.5 ton ha-1). All groves included in the
low-yield population presented yield above 40 ton ha-1, and were considered with potential to
increase yield.
DRIS norms for ‘Valencia’ sweet orange on
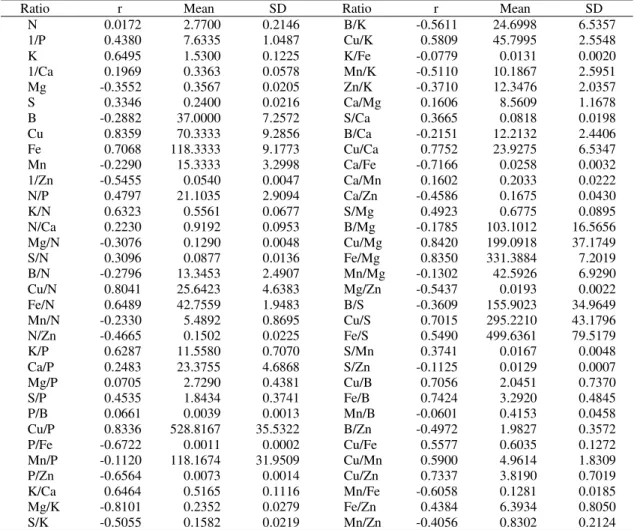
Poncirus trifoliata, as well as correlation coefficient values (r) between each pair of nutrient ratios (A/B or B/A) and yield were calculated and established (Table 4). The pairs of nutrients with r values over 0.5, irrespective to sign, are K, Cu, Fe, 1/Zn, K/N, Cu/N, Fe/N, K/P, Cu/P, P/Fe, P/Zn, K/Ca, Mg/K, S/K, B/K, Cu/K, Mn/K, Cu/Ca, Ca/Fe, Cu/Mg, Fe/Mg, Mg/Zn, Cu/S, Fe/S, Cu/B, Fe/B, Cu/Fe, Cu/Mn, Cu/Zn, and Mn/Fe.
It is important to point out that, for all three rootstochs in spite of different regression equations, INB was highly correlated with yield, which decreased with the increase of nutritional imbalance (Figure 1A, 1B e 1C). This is a strong evidence that
the method used to calculate DRIS indices and, therefore, INB, took into consideration the right criteria, especially the selection of specific standard populations for each scion/rootstoch combination.
According to previous investigations by other authors, calculated norms can be as much representative as more specific high- and low-yield populations are selected. Databases to be used for calculation of DRIS norms may have variable size, according to the method (Letzsch & Sumner, 1984), and may not be directly related to the quality of the standards (Walworth et al., 1988). Possibly, more general DRIS norms may result in lower diagnosis efficiency. The high quality of the observations must be the main characteristic in searching and choosing the database, as oppose as quantity.
In this work, ‘Valencia’ sweet orange, older than six years and with yield above 40 ton ha-1, was the
selected population to optimize DRIS efficiency. The establishment of DRIS norms was based on restricted databases, but extremely uniform and with high quality, varying from 12 to 19 observations.
Considering the significant influence of the soil and climatic conditions, scion and rootstock variety, this work shows that DRIS norms for citrus must be calculated for specific conditions, when higher correlation between INB and yield is achieved. These results were also found by Nick (1998), calculating DRIS norms in coffee. Therefore, general DRIS norms (Rodriguez et al., 1997; Santos, 1997), in spite of being more extended, may present less application when applied in specific conditions such as those of the present work.
The establishment of DRIS norms was made within specific populations, with segregation by rootstock, leaf sampling and harvest year. Simulation of DRIS norms involving populations grouped by several leaf sampling and harvest years (1994 through 1998) did not result in high correlation between INB and yield (Mourão Filho et al., 2002). The most reasonable explanation for this fact could be the great influence of climate on flower bud induction and the different degree of incidence of diseases, such as Postbloom Fruit Drop
(Colletotrichum gloesporioides) throughout the
‘Valencia’ sweet orange groves according to rootstocks was not carried out by Rodriguez et al. (1997), in Venezuela, who worked with Cleopatra mandarin and Volkamer lemon, as rootstocks. In the present work, this procedure was a high-priority.
Another important factor to be discussed refer to the yield of the standard (high-yield) population. The criterion to select the standard population must be specific to establish adequate norms in each case. Therefore, the results of the present work do not agree with previous research works, in which the standard population cut-off limit must be strict (Letzsch & Sumner, 1984; Beverly & Worley, 1992;
Raghupathi & Bhargava, 1999), but do agree with those in which the standard population was defined by more variable and arbitrary criteria (Nick, 1998).
Conclusions
1. Indexes of nutritional balance (INB), calculated from established norms, present high correlation with yield for all three scion/rootstock combinations.
2. DRIS norms defined in this work are applicable, since leaf samples are collected in non fruiting terminals and the groves are irrigated.
Table 4. Mean and standard deviation (SD) of DRIS norms for ‘Valencia’ sweet orange on Poncirus trifoliata, and correlation coefficient (r) between each nutrient ratio pair (A/B or B/A) and yield. Mogi Guaçú, SP, Brazil. 1994.
Ratio r Mean SD Ratio r Mean SD
N 0.0172 2.7700 0.2146 B/K -0.5611 24.6998 6.5357
1/P 0.4380 7.6335 1.0487 Cu/K 0.5809 45.7995 2.5548
K 0.6495 1.5300 0.1225 K/Fe -0.0779 0.0131 0.0020
1/Ca 0.1969 0.3363 0.0578 Mn/K -0.5110 10.1867 2.5951
Mg -0.3552 0.3567 0.0205 Zn/K -0.3710 12.3476 2.0357
S 0.3346 0.2400 0.0216 Ca/Mg 0.1606 8.5609 1.1678
B -0.2882 37.0000 7.2572 S/Ca 0.3665 0.0818 0.0198
Cu 0.8359 70.3333 9.2856 B/Ca -0.2151 12.2132 2.4406
Fe 0.7068 118.3333 9.1773 Cu/Ca 0.7752 23.9275 6.5347
Mn -0.2290 15.3333 3.2998 Ca/Fe -0.7166 0.0258 0.0032
1/Zn -0.5455 0.0540 0.0047 Ca/Mn 0.1602 0.2033 0.0222
N/P 0.4797 21.1035 2.9094 Ca/Zn -0.4586 0.1675 0.0430
K/N 0.6323 0.5561 0.0677 S/Mg 0.4923 0.6775 0.0895
N/Ca 0.2230 0.9192 0.0953 B/Mg -0.1785 103.1012 16.5656
Mg/N -0.3076 0.1290 0.0048 Cu/Mg 0.8420 199.0918 37.1749
S/N 0.3096 0.0877 0.0136 Fe/Mg 0.8350 331.3884 7.2019
B/N -0.2796 13.3453 2.4907 Mn/Mg -0.1302 42.5926 6.9290
Cu/N 0.8041 25.6423 4.6383 Mg/Zn -0.5437 0.0193 0.0022
Fe/N 0.6489 42.7559 1.9483 B/S -0.3609 155.9023 34.9649
Mn/N -0.2330 5.4892 0.8695 Cu/S 0.7015 295.2210 43.1796
N/Zn -0.4665 0.1502 0.0225 Fe/S 0.5490 499.6361 79.5179
K/P 0.6287 11.5580 0.7070 S/Mn 0.3741 0.0167 0.0048
Ca/P 0.2483 23.3755 4.6868 S/Zn -0.1125 0.0129 0.0007
Mg/P 0.0705 2.7290 0.4381 Cu/B 0.7056 2.0451 0.7370
S/P 0.4535 1.8434 0.3741 Fe/B 0.7424 3.2920 0.4845
P/B 0.0661 0.0039 0.0013 Mn/B -0.0601 0.4153 0.0458
Cu/P 0.8336 528.8167 35.5322 B/Zn -0.4972 1.9827 0.3572
P/Fe -0.6722 0.0011 0.0002 Cu/Fe 0.5577 0.6035 0.1272
Mn/P -0.1120 118.1674 31.9509 Cu/Mn 0.5900 4.9614 1.8309
P/Zn -0.6564 0.0073 0.0014 Cu/Zn 0.7337 3.8190 0.7019
K/Ca 0.6464 0.5165 0.1116 Mn/Fe -0.6058 0.1281 0.0185
Mg/K -0.8101 0.2352 0.0279 Fe/Zn 0.4384 6.3934 0.8050
References
BEVERLY, R. B. Modified DRIS method for simplified nutrient diagnosis of ‘Valencia’ oranges. Journal of Plant Nutrition, New York, v. 10, p. 1401-1408, 1987. BEVERLY, R. B.; STARK, J.C.; OJALA, J. C.; EMBLETON, T. W. Nutrient diagnosis of ‘Valencia’ oranges by DRIS. Journal of the American Society for Horticultural Science, v. 109, p. 649-654, 1984. BEVERLY, R. B.; WORLEY, R. E. Preliminary DRIS diagnostic norms for Pecan. HortScience, Alexandria, v. 27, p. 271, 1992.
CASTLE, W. S.; TUCKER, D. P. H.; KREZDORN, A. H.; YOUTSEY, C. O. Rootstocks for Florida citrus. Gainesville: University of Florida, 1993. 92 p.
CERDA, A.; NIEVES, M.; MARTINEZ, V. An evaluation of mineral analysis of Verna lemons by DRIS. Communications in Soil Science and Plant Analysis, New York, v. 26, p. 1697-1707, 1995.
CRESTE, J. E. Uso do DRIS na avaliação do estado nutricional do limoeiro Siciliano. 1996. 120 f. Tese (Dou-torado em Nutrição Vegetal) - Universidade Estadual Paulista, Botucatu, 1996.
HALLMARK, W. B.; BEVERLY, R. B. Review: an update in the use of the diagnosis and recommendation integrated system. Journal of Fertilizer Issues, Manchester, v. 8, p. 74-88, 1991.
HANLON, E. A.; OBREZA, T. A.; ALVA, A. K. Tissue and soil analysis. In: TUCKER, D. P. H.; ALVA, A. K.; JACKSON, L. K.; WHEATON, T. A. (Ed.). Nutrition of Florida citrus trees. Gainesville: University of Flori-da, 1995. p. 13-16. ( SP, 169).
JONES, W. W. Proposed modifications of the diagnosis and recommendation integrated system (DRIS) for interpreting plant analyses. Communications in Soil Science and Plant Analysis, New York, v. 12, p. 785-794, 1981.
LETZSCH, W. S.; SUMNER, M. E. Effect of population size and yield level in selection of diagnosis and recommendation integrated system (DRIS) norms. Communications in Soil Science and Plant Analysis, New York, v. 15, p. 997-1006, 1984.
LOPES, A. S. Manual internacional de fertilidade do solo. 2. ed. Piracicaba: Potafos, 1998. 177 p.
MOURÃO FILHO, F. A. A.; AZEVEDO, J. C.; NICK, J. A. Funções e ordem da razão dos nutrientes no estabe-lecimento de normas DRIS em laranjeira ‘Valência’. Pes-quisa Agropecuária Brasileira, Brasília, v. 37, n. 2, p. 185-192, fev. 2002.
NICK, J. A. DRIS para cafeeiros podados. 1998. 86 f. Dissertação (Mestrado em Nutrição Vegetal) - Escola Su-perior de Agricultura Luiz de Queiroz, Piracicaba, 1998. RAGHUPATHI, H. B.; BHARGAVA, B. S. Preliminary nutrient norms for ‘Alphonso’ mango using diagnosis and recommendation integrated system. Indian Journal of Agricultural Sciences, New Delhi, v. 69, p. 648-650, 1999.
RODRIGUEZ, O.; ROJAS, E.; SUMNER, M. Valencia orange DRIS norms for Venezuela. Communications in Soil Science and Plant Analysis, New York, v. 28, p. 1461-1468, 1997.
SANTOS, W. R. dos. Avaliação do equilíbrio nutricional dos macronutrientes em citros com diferentes aduba-ções. 1997. 112 f. Dissertação (Mestrado em Nutrição Vegetal) - Escola Superior de Agricultura Luiz de Queiroz, Piracicaba, 1997.