Growth of champa fruit under agroecological conditions
of Miraflores, Boyacá, Colombia
Helber Enrique Balaguera‑López(1), Aníbal Herrera Arévalo(2) and Daniel Cortés‑Moreno(2)
(1)Universidad Pedagógica y Tecnológica de Colombia, Facultad de Ciencias Agropecuarias, Grupo de Investigaciones Agrícolas, Campus Universitario, Avenida Central del Norte, Tunja, Colombia. E‑mail: enrique_balaguera@yahoo.com (2)Universidad Nacional de Colombia, Facultad de Agronomía, Campus Universitario, Carrera 45 no. 26‑85, Bogotá, Colombia. E‑mail: aoherreraa@unal.edu.co, dacortesmo@gmail.com
Abstract – The objective of this work was to analyze the growth of champa fruit (Campomanesia lineatifolia) as a function of growing‑degree days (GDD) in the municipality of Miraflores, in Boyacá, Colombia. Thirty trees were selected at random, and 100 flowers in full bloom were marked in each tree. From the 26th day
after flowering until harvest, 10 samples were taken every 15 days to determine the fruit parameters and growth rate. Temperature was recorded to calculate the GDD. From flowering until harvest, 1,489.1 GDD were accumulated over 145 days. Dry and fresh matter mass of pulp, seed, and total fruit were fitted to a logistic growth model, and three growth stages (S1, S2 and S3) were defined. In the S1, growth was slow, and the relative growth remained nearly stable, whereas the absolute growth rate (AGR) increased slowly. In the S2, maximum growth was observed. In the S3, which corresponds to maturation, dry mass increased gradually, and the AGR decreased, while the fresh pulp and total mass did not cease to increase. The polar and equatorial diameters increased linearly, while the volume followed an exponential model. Champa fruit show a simple sigmoid growth curve.
Index terms: Myrtaceae, growth rate, tropical fruits.
Crescimento de frutos de gabiroba em condições agroecológicas
de Miraflores, Boyacá, Colômbia
Resumo – O objetivo deste trabalho foi analisar o crescimento de frutos de gabiroba (Campomanesia lineatifolia) como função de graus‑dia de crescimento (GDC) no Município de Miraflores, Boyacá, Colômbia. Trinta árvores foram selecionadas aleatoriamente, e 100 flores totalmente maduras marcadas em cada árvore. A partir do 26o dia após o florescimento até a colheita, 10 amostras foram colhidas a cada 15 dias, para determinar
os parâmetros de crescimento dos frutos e a taxa de crescimento. A temperatura foi registrada para calcular o GDC. Do florescimento até a coleta, 1.489,1 GDC foram acumulados em 145 dias. As massas de matéria seca e fresca de polpa, sementes e total de frutos foram ajustadas a um modelo logístico de crescimento, e três estágios de crescimento (S1, S2 e S3) foram definidos. No S1, o crescimento foi lento, e o crescimento relativo permaneceu quase estável, enquanto o crescimento absoluto aumentou lentamente. No S2, foi observado o máximo crescimento. No S3, que corresponde à maturação, a massa de matéria seca aumentou gradualmente, ao passo que o crescimento absoluto diminuiu, e as massas fresca e total da polpa continuaram a aumentar. Os diâmetros polar e equatorial aumentaram linearmente, enquanto o volume seguiu um modelo exponencial. Os frutos de gabiroba apresentam uma curva sigmoidal simples de crescimento.
Termos para indexação: Myrtaceae, taxa de crescimento, frutas tropicais.
Introduction
Growth is a holistic, explanatory, and integral approximation intended to encompass plant form and
functions (Hunt, 2003). In fruit destined for the fresh
fruit market, studies of fruit growth are generally based on the measurements of fruit diameter and fresh weight
(Minchin et al., 2003). In these studies, growth curves
of the transverse diameter as a function of time are most
commonly employed (Casierra Posada & Cardozo, 2009) and have the advantage of being easily measured,
nondestructive, and amenable to measurement throughout the whole growth period. These curves are
useful not only for defining the progression of growth during the cycle under specific weather conditions,
but also for projecting the harvest‑weight of the fruit
Accordingly, the analysis of growth is a quantitative approximation for understanding the growth of a plant or of a population of plants under natural or controlled environmental conditions, and may be carried out by
two distinct methods. The first method is based on empirical mathematical functions fitted to the observed
growth data and employing data‑smoothing techniques, while the second employs equations proposed for the physiological/biochemical mechanisms believed to be involved in fruit growth (Opara, 2000). Minchin et al.
(2003) used the first method to determine the final
weight of kiwi fruit, Actinidia deliciosa (A. Chev.) C.F.
Liang & A.R. Ferguson, and stated that the recorded
observations were used to select the most appropriate descriptive function.
Dry matter measurement at defined time intervals
permits the determination of the rates that explain the dynamics of growth in fruit, and the main rates are the absolute growth rate (AGR) and the relative growth rate (RGR). AGR describes the changes of size per unit of time, while the RGR describes the rate of size
variation per unit of initial size (Hunt, 1990). Fruit growth is commonly analyzed by fitting curves that
allow the calculation of AGR and RGR. These curves facilitate the prediction of fruit size and the temporal
identification of critical stages, and may aid in the optimization of crop management (Godoy et al., 2008)
in order to minimize quality variation in fruit destined for national and export markets.
Temperature controls the developmental rate of many organisms, which require the accumulation of a certain amount of heat to go from one stage of their
life cycle to another. According to Rodríguez & Flórez (2006), the measurement of this accumulated heat is
known as physiological time, and is expressed in units called growing‑degree days (GDD). This thermal sum is among the methods most frequently used to relate temperature to plant development.
A great variety of fruit species of the Myrtaceae family, which have a great economic importance, occurs in the tropics. These include guava (Psidium guajava L.), feijoa [Acca sellowiana (O. Berg) Burret], and several species of the genus Campomanesia
(Cañizares et al., 2003; Rodríguez et al., 2006; Álvarez‑Herrera et al., 2009; Silva et al., 2009),
including champa (Campomanesia lineatifolia Ruiz &
Pav.). The latter is a fruit tree that produces a highly perishable and climacteric berry (Balaguera, 2011)
with a pleasant, sweet and tangy flavor, and enjoys
a good acceptance by consumers (Balaguera et al.,
2009). These characteristics make it a promising
market competitor with other, already established fruit
(Álvarez‑Herrera et al., 2009).
Although champa is widely cultivated in the Boyacá department, in Colombia (Balaguera et al., 2009),
investigations of its behavior are few. Several studies indicate that its fresh‑ and dry‑mass accumulation follow a simple sigmoid curve. At harvest, fruit weighs
approximately 25 g, and has an equatorial diameter
of approximately 4 cm (Álvarez‑Herrera et al.,
2009; Balaguera et al., 2009; Balaguera, 2011). Fruit development from flowering to harvest is reported to last approximately 160 days (Balaguera et al., 2009),
although this time may vary with weather conditions (Balaguera, 2011). Despite these reports, fruit growth, seed and pulp have not been analyzed for dimensional increments or respective growth rates as a function of thermal time. Taken together, these analyses would allow the timely scheduling of activities, such as harvesting and other cultivation operations, to partially prevent the high loss of fruit that occurs during the harvest and postharvest.
The objective of this work was to analyze the
growth of champa (Campomanesia lineatifolia) fruit
as a function of growing‑degree days (GDD) in the
municipality of Miraflores, in Boyacá, Colombia.
Materials and Methods
The experiment was carried out from March to
August 2009 in the El Mango farm, Ayatá village, in the municipality of Miraflores, Boyacá department, Colombia, at 5º11'40"N, 73º08'44"W and 1,432 m
altitude. The experimental site has an annual precipitation varying from 2,000 to 3,000 mm, occurring in a monomodal period between April and September. Mean temperature during the study was
22.3°C, with an average minimum and maximum of 19.2 and 27.9°C, respectively, and an average relative humidity of 80.1%. According to the Holdridge life zone, Miraflores belongs to the premontane moist
forest. The investigation phase was conducted in
Thirty champa trees (unknown cultivar) of
approximately 10 years of age, spaced at 8x8 m, were randomly selected. In the middle third of each tree, 100 individual flowers in full bloom were marked with
silicone rubber. Ten samplings were done during the
research, starting 26 days after flowering (DAF); in
each sampling, 10 fruit were harvested at random from
each tree. Sampling was done every 15 days, except
for the last which took place seven days after the ninth sampling.
The thermal time as the accumulation of GDD, was
calculated after flowering using the formula of Almanza et al. (2010): GDD = ((Tmax + T min)/2 ) ‑ Tbase, in which: Tmax is the maximum daily air temperature; Tmin is the minimum daily air temperature; and Tbase
is the temperature at which the metabolic process of champa is minimal. The Tbase for guava, which is
12°C (Salazar et al., 2006) was used. This decision
was made due to the absence of reports on the base temperature of champa fruit.
In each sample, fresh mass of seeds, edible part
(pulp plus cortex), and total fruit were determined
to within 0.001 g using a precision balance V 1000 model, (OHAUS, Barcelona, España). Dry mass was
determined in the same samples following drying at
75°C to a constant weight. The polar and equatorial
diameters were determined with a digital caliper to
within a precision of 0.01 mm. Fruit volume (cm3) was
estimated by water displacement after submergence in a graduated cylinder. The AGR and RGR were determined by functional analysis following the
method of Carranza et al. (2009).
A descriptive analysis was performed to determine the means and standard errors. Each of the variables was plotted against the physiological time (GDD) and chronological time (days), and the most appropriate
statistical model was determined using SAS 9.2 software (SAS Institute, Cary, NC).
Results and Discussion
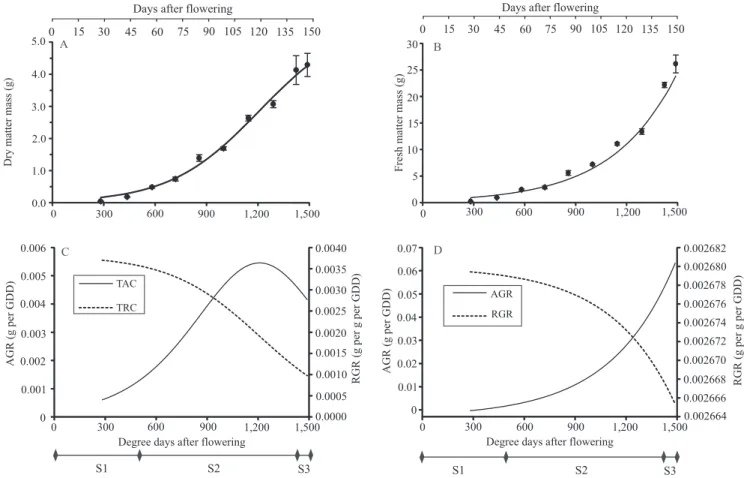
From flowering until harvest, there were a total of 1,489.1 GDD in 145 days (Figure 1). For the same zone (Miraflores, Boyacá), Balaguera et al. (2009) reported a duration of 160 days. This considerable difference, according to Castro Neto & Reinhardt (2003), may be
attributed to variations in the plant growth cycle and, consequently, to the length of the reproductive and fruit
growth periods. This effect highlights the importance of expressing the growth and development of champa fruit in terms of physiological time, given that in the tropics, temperature is the environmental variable
that exerts the most influence on crop development
by its action on the enzymatic reactions that directly or indirectly mediate the developmental processes
(Normand & Léchaudel, 2006).
As the ambient temperature falls, plant development rates have been reported to also decline to a low
temperature limit at which development ceases. In
contrast, as the temperature rises, the development rates rise to an optimal temperature, after which they decline and eventually cease at their maximum development
temperature (Trudgill et al., 2005). This observation
indicates that the temperatures that prevailed during the present study were more favorable for fruit development so that the development cycle was shortened compared
with that reported by Balaguera et al. (2009). The
champa developmental period in comparison with the ones of other Myrtaceae show that it is greater than that reported for Eugenia stipitata McVaugh (araza) of
8.5 weeks (Hernández et al., 2007), and similar to that of feijoa, for which Rodríguez et al. (2006) found that fruit of clones 41 (Quimba) and 8‑4 required 154 and
147 days, respectively.
Dry mass accumulation indicates that champa fruit
undergo a simple sigmoid growth (Figure 1), fitting
a logistic growth model (Table 1), in accordance
with the findings of Álvarez‑Herrera et al. (2009) and Balaguera et al. (2009) for the same species. This sigmoid curve, which is characteristic of fleshy
fruit (Opara, 2000), has also been encountered in E. stipitata (Hernández et al., 2007), feijoa (Rodríguez
et al., 2006), and Campomanesia pubescens (DC.)
O. Berg (guabiroba) (Silva et al., 2009). In contrast,
in guava, the accumulation of the fresh and dry mass
follows a double sigmoid curve (Cañizares et al.,
2003), indicating that not all Myrtaceae have the same growth pattern.
The three phases of fruit growth are shown in
Figure 1. In the S1, there is a low rate of growth from fruit formation until 582.1 GDD (54 DAF), at which point fruit mass reached 0.48±0.03 g, indicating a
low‑material content, due to the process of cell division
which is predominant in this phase (Opara, 2000). In
the S2, dry mass grew in a continuous and considerable
gain. In this phase, the predominant processes are fruit filling and possibly a decline in respiration. Finally, the maturation phase, S3, occupied only 66.3 GDD and ended at 1422.8 GDD (145 DAF), when fruit dry mass was 4.29±0.36 g, which was a lower value than the 5.21 g reported by Balaguera et al. (2009) for this
fruit.
The increase of champa fruit dry mass may be explained by the formation of proteins, sugars, and other substances accumulated during fruit development.
Castro Neto & Reinhardt (2003) stated that the
accumulation of dry mass might be a consequence of the higher contribution of photosynthesis associated with the translocation of dry matter from other parts of the plant to the fruit, with the remobilization of previously photosynthesized photoassimilates accounting for 40
to 50% of the fruit weight.
The AGR showed a slow increase during the first
growth phase and, subsequently, increased rapidly to
its maximum of 0.00545 g GDD at 1208.5 GDD. AGR then decreased until harvest (Figure 1). Thus, the
maximum growth rate occurred during the second development phase, which agrees with observations in E. stipitata (Hernández et al., 2007) and feijoa
(Rodríguez et al., 2006). AGR behavior showed only
one maximum, as is typical for fruit with a simple sigmoid growth, such as apple (Yuri et al., 2011), but differs from fruit with a double sigmoid behavior, in which the AGR shows two maxima (Almanza et al., 2010).
The RGR fell continuously up to 582.1 GDD, but slowly at 0.00348 g per g per GDD and, subsequently, declined drastically until harvest (Figure 1). This
corroborates the sigmoidal growth of champa fruit and
agrees with the findings of Casierra‑Posada et al. (2007)
for tomato. However, the RGR decrease in champa was slower during the initial stage of development, due to the longer duration of fruit growth.
The AGR is an indicator of the sink potential
of fruit (Hunt, 2003). In agreement with this idea, Casierra Posada & Cardozo (2009) comment that is
important to apply agricultural operations to improve dry matter accumulation in fruit at the highest AGR
because fruit are most sensitive to influences, such as
foliar fertilization, water supply, and the availability of light, during this period. The AGR is a growth index
that expresses efficiency, as the rate of size increases
in units of size and time, and, for fruit, it indicates the gain obtained as a sink, given that most of the fruit photoassimilates are provided by the leaves, and a smaller part by the photosynthesis of the fruit itself
during its green stage (Casierra Posada & Cardozo, 2009).
Champa fruit fresh mass was fitted to a logistic model (Table 1); however, no cessation of fresh‑mass
accumulation in the ripening phase was apparent. This situation was also observed in feijoa (Rodríguez
et al., 2006). At harvest, fruit reached 26.13 ± 1.69 g (Figure 1). During the first stage, the increase of fresh
mass was low, due to the elevated cell division which took place in this period, which began before anthesis
and continued until the first days of fruit set. Cell
division is stimulated by the action of phytohormones
associated with pollination (Nacif, 1991). Cell elongation occurs next, influenced by the cell wall
plasticity and by turgor pressure of the cells, which lead
to a pronounced expansion of volume and mass. In this
process, several hormones are reported to potentially
be implicated in fruit growth, with auxins playing a
major role (Campbell & Reece, 2007). However, the
curve was not asymptotic, possibly due to the continued accumulation of photoassimilates and water (Grange,
1996) in the final growth stage of the fruit.
Champa fruit moisture content was 83.4% at
harvest, which was slightly greater than that reported
by Balaguera et al. (2009), but lower than the 88.8%
moisture of fruit of Campomanesia phaea (O. Berg) Landrum (Vallilo et al., 2005). This value is characteristic of fruit of the Myrtaceae family, which
are mostly fleshy and succulent (Biffin et al., 2010). Fresh mass behavior was confirmed with the
AGR, which did not show a typical bell shape but rose continuously throughout the growth period with
0.00565 g GDD at the end of S1, and 0.0636 g GDD at harvest (Figure 1). The RGR fell continually, but its decrease was more pronounced after 582.1 GDD. At the beginning, the RGR was 0.00267 g per g per GDD, and at the harvest, it was 0.00266 g per g per GDD (Figure 1D). According to Carranza et al. (2009),
the RGR expresses the dry‑mass increase in the plant (in this case, in the fruit), in a given time interval, with respect to the initial value of the produced and accumulated dry mass. Thus, the RGR tends to decrease during growth.
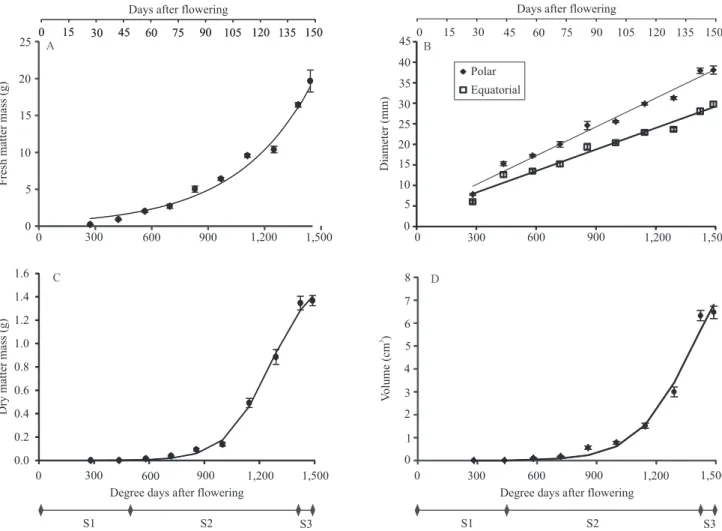
Fresh and dry masses of the edible part showed a behavior that fitted a logistic growth model (Table 1). Fresh mass of the edible part showed a gradual rise up to 2.04 ± 0.13 g at 582.1 GDD, and, thereafter, the
increment was continuous and considerable up to the harvest, at which point there was an accumulation of
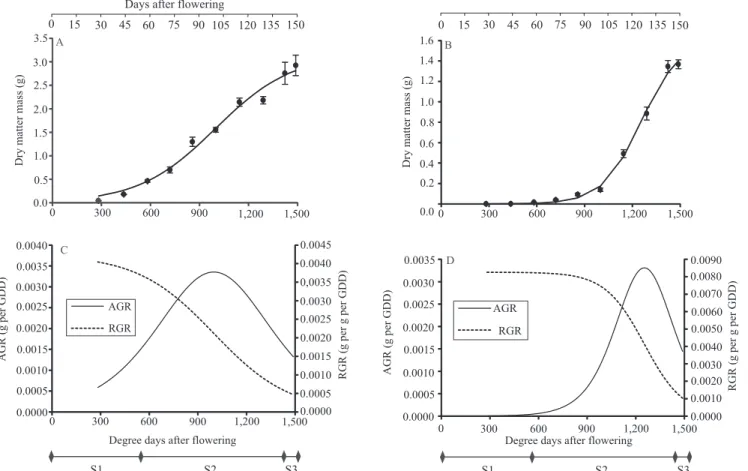
19.66 ± 1.49 g (Figure 2). Dry mass of the edible part
showed a simple sigmoid behavior that was corroborated
by the AGR and RGR (Figure 3), accumulating slowly until 582.1 GDD and, later, accumulating rapidly up to 1422.8 GDD, after which it continued to increase at a slower rate until harvest. For fresh mass, the edible part represented 72% and the dry mass 68%; these
values indicated that fruit growth depends mainly on the growth of the meso‑ and exocarps. Álvarez‑Herrera
et al. (2009) reported values of 60% for this species.
The gain in the fresh and dry mass of the seeds showed a sigmoidal behavior that was in agreement with a logistic model. These masses were notably low
until 999.4 GDD (Figures 2 and 3), coinciding with a
gradual increase in the AGR and a stable behavior of
the RGR. According to Castro et al. (2004), this phase
Table 1. Fitted equations for the parameters of growth of
champa fruit in function of the accumulation of degree days, under the agroecological conditions of Miraflores, Boyacá, Colombia.
Parameter Model R2
Fresh fruit mass Y = 4363.6/1 + e 0.00268*(GDD 3130.5) 0.97
Dry fruit mass Y = 5.7283/1 + e 0.00381*(GDD 1208.6) 0.99
Fresh pulp mass Y = 9960,6/1 + e 0.00241*(GDD 4088.4) 0.97
Dry pulp mass Y = 3.1651/1 + e 0.00424*(GDD 998.2) 0.99 Fresh seed mass Y = 9.9938/1 + e 0.00711*(GDD 1382.7) 0.98
Dry seed mass Y = 1.6030/1 + e 0.00826*(GDD 1253.2 0.98 Equatorial diameter Y = 0.023x + 3.175 0.98
Polar diameter Y = 0.017x + 3.039 0.97
Figure 2. Behavior of pulp fresh matter mass (A), diameters (B), fresh matter mass of seeds (C), and volume (D) during the
growth of champa fruit (Campomanesia lineatifolia), in function of the accumulation of degree days, under the agroecological conditions of Miraflores, Boyacá, Colombia, 2009. Vertical bars indicate standard error (n=10). Stages of development: S1, cell division; S2, cell elongation; S3, maturation.
corresponds to cell division, and during this stage, the histodifferentiation and morphogenesis of the seed accompany extensive cell divisions by the unicellular zygote, with the resulting cells differentiating to form the embryo. The second phase of development was
that of accelerated growth ending at 1422.8 GDD (138 DAF), a phase characterized by the accumulation of both endosperm reserves and water (Castro et al.,
2004). During this phase, the AGR reached its highest
point (1248.19 GDD) with 0.0033 g GDD, and the RGR showed its greatest decrease (Figure 3). Thereafter, growth was again slow until 1489.1 GDD, reaching its maximum values at 6.47 ± 0.28 g and 1.37 ± 0.04 g for the fresh and dry mass, respectively (Figures 2 and
3). During this phase, the vacuoles shrank as storage
compounds accumulated, and dry matter weight increased, while the seed development ended in a phase of preprogrammed desiccation characterized by a loss
of fresh mass (Castro et al., 2004), however, this latter
phase was not observed in champa fruit.
Seeds represent 28% of fruit fresh mass and 32% of
dry mass. These values indicate the high proportion of the seeds in relation to the edible part. Álvarez‑Herrera
et al. (2009) found values of approximately 40% for
both masses for this species, which, combined with their values for the edible proportion, indicate that genetic,
weather, and management factors may influence the
exceeded the PD, a characteristic corresponding to a round, slightly oblate berry. ED showed 0.023 mm GDD increase, while that of PD was 0.017 mm GDD.
At harvest, ED was 38.1 ± 0.99 mm, and PD was 29.8 ± 0.67 mm (Figure 2). In contrast to this result,
in E. stipitata, the fruit diameter fitted a logistic model
indicating a simple sigmoid growth (Hernández et al.,
2007), while in guava, fruit diameter was shown as
a double sigmoid (Mercado‑Silva et al., 1998). In
Campomanesia pubescens, these dimensions were in
keeping with a quadratic function (Silva et al., 2009). In contrast, Bertin et al. (2003) stated that the diameter
increase results from an accelerated cell multiplication, as a consequence of continuous division located in the meristematic regions, leading to an increase in the number of fruit tissue layers. An increase in fruit size
has been reported to be due to the influx of solutes and
water into the cell vacuoles, which provide the necessary
space for solute storage and exert pressure against the cell walls that causes turgor, resulting in the stretching
of the tissue (Gamarra Rojas & Medina 1997).
Champa fruit volume showed an exponential
behavior, characterized by a gentle increase up to
719.2 GDD, and an accelerated rise up to a value of 28.44 ± 1.79 cm3 at harvest (Figure 2).
Among the factors that significantly contribute to
the increase of fruit volume are growth regulators, such as gibberellins, which are responsible for
cellular expansion (Campbell & Reece, 2007). In contrast, Casierra‑Posada et al. (2007) state that
fruit have a high‑sink potential, meaning that they take from the plant a range of substances which they transform and convert into their components, namely, molecules with complex structures that are essentially different from those which the plant obtains from the medium.
Conclusions
1. Total duration from flowering to fruit harvest is 1489.1 GDD in 145 days, with three stages of development: S1, with a slow growth, which ends at 582.1 GDD; S2, with a rapid growth phase and the highest value of AGR, ending at 1422.8 GDD; and S3,
which corresponds to the ripening phase.
2. Dry and fresh matter masses of champa fruit and
seeds show a simple sigmoid growth behavior that fit a logistic growth model; at harvest, fresh and dry matter masses are 26.13±1.69 and 4.13±0.45 g, respectively.
3. The equatorial and polar diameters increase
linearly with GDD; the equatorial diameter is always
greater than the polar diameter, which characterizes
champa fruit shape as a slightly flattened round berry. 4. Fruit volume increases exponentially, with a notably rapid growth during the final phase of
development.
Acknowledgments
To the Universidad Nacional de Colombia, for financial support; to the Universidad Pedagógica y Tecnológica de Colombia and the “Jóvenes Investigadores Virginia Gutiérrez” program of the Departamento Administrativo de Ciencia, Tecnología e Innovación de Colombia, for financing H.E.
Balaguera.
References
ALMANZA, P.J.; QUIJANO‑RICO, M.A.; FISCHER, G.; CHAVES, C.B.; BALAGUERA‑LÓPEZ, H.E. Physicochemical characterization of ´Pinot Noir` grapevine (Vitis vinifera L.) fruit during its growth and development under high altitude tropical conditions. Agronomía Colombiana, v.38, p.173‑180,
2010.
ÁLVAREZ‑HERRERA, J.G.; GALVIS, J.A.; BALAGUERA‑LÓPEZ, H.E. Determinación de cambios físicos y químicos durante la maduración de frutos de champa
(Campomanesia lineatifolia R. & P.). Agronomía Colombiana,
v.27, p.253‑259, 2009.
BALAGUERA, H.E. Estudio del crecimiento y desarrollo
del fruto de champa (Campomanesia lineatifolia R & P) y
determinación del punto óptimo de cosecha. 2011. 152p. Tesis
(Maestría) ‑ Universidad Nacional de Colombia, Bogotá.
BALAGUERA, H.E.; ÁLVAREZ, J.G.; BONILLA, D.C. Crecimiento y desarrollo del fruto de champa (Campomanesia
lineatifolia Ruiz & Pavón). Revista UDCA Actualidad y
Divulgación Científica, v.12, p.113‑123, 2009.
BERTIN, N.; GÉNARD, M.; FISHMAN, S. A model for an early stage of tomato fruit development: cell multiplication and cessation of the cell proliferative activity. Annals of Botany, v.92, p.65‑72,
2003.
BIFFIN, E.; LUCAS, E.J.; CRAVEN, L.A.; DA COSTA, I.R.; HARRINGTON, M.G.; CRISP, M.D. Evolution of exceptional species richness among lineages of fleshy‑fruited Myrtaceae.
Annals of Botany, v.106, p.79‑93, 2010.
CAMPBELL, N.A.; REECE, J.B. Biología. 7.ed. Madrid:
Panamericana, 2007. 1532p.
CAÑIZARES A.; LAVERDE, D.; PUESME, R. Crecimiento y desarrollo del fruto de guayaba (Psidium guajava L.) en Santa Bárbara, Estado Monagas, Venezuela. Revista UDO Agrícola, v.3, p.34‑38, 2003.
CARRANZA, C.; LANCHERO, O.; MIRANDA, D.; CHAVES, B. Análisis del crecimiento de lechuga (Lactuca sativa L.) ´Batavia`
cultivada en un suelo salino de la Sabana de Bogotá. Agronomía
Colombiana, v.27, p.41‑48, 2009.
CASIERRA POSADA, F.; CARDOZO, M. Análisis básico del crecimiento en frutos de tomate (Lycopersicon esculentum Mill. cv. Quindío) cultivado a campo abierto. Revista Facultad Nacional
de Agronomía, Medellín, v.62, p.4815‑4822, 2009.
CASIERRA‑POSADA, F.; CARDOZO, M.; CÁRDENAS‑ HERNÁNDEZ, J.F. Análisis del crecimiento en frutos de tomate
(Lycopersicon esculentum Mill.) cultivados bajo invernadero.
Agronomía Colombiana, v.25, p.299‑305, 2007.
CASTRO NETO, M.T.; REINHARDT, D.H. Relações entre parâmetros de crescimento do fruto da manga cv. Haden. Revista
Brasileira de Fruticultura, v.25, p.36‑38, 2003.
CASTRO, R.D.; BRADFORD, K.J.; HILHORST, H.W.M. Desenvolvimento de sementes e conteúdo de água. In: FERREIRA, A.G.; BORGHETTI, F. (Ed.). Germinação: do básico ao aplicado.
Porto Alegre: Artmed, 2004. p.51‑67.
GAMARRA ROJAS, G.; MEDINA, M. Growth of the yellow passion fruit. Fruits, v.52, p.16‑26, 1997.
GODOY, C.; MONTERUBBIANESI, G.; TOGNETTI, J. Analysis of highbush blueberry (Vaccinium corymbosum L.) fruit growth with exponential mixed models. Scientia Horticulturae, v.115,
p.368‑376, 2008.
GRANGE, R. Crecimiento del fruto. En: AZCÓN‑BIETO, J.; TALÓN, M. (Ed.). Fisiología y bioquímica vegetal. Madrid:
Interamericana ‑ McGraw‑Hill, 1996. p.449‑462.
HERNÁNDEZ, M.S.; MARTÍNEZ, O.; FERNÁNDEZ‑TRUJILLO, J.P. Behavior of arazá (Eugenia stipitata Mc Vaugh) fruit
quality traits during growth, development and ripening. Scientia
Horticulturae, v.111, p.220‑227, 2007.
HUNT, R. Basic growth analysis: plant growth analysis for
beginners. Boston: Unwin Hyman, 1990. 112p.
HUNT, R. Growth analysis, individual plants. In: THOMAS, B.; MURPHY, D.J.; MURRAY, D. (Ed.). Encyclopedia of applied
plant sciences. Londres: Academic Press, 2003. p.579‑588.
index and ripening changes of guavas produced in central México.
Postharvest Biology and Technology, v.13, p.143‑150, 1998.
MINCHIN, P.E.H.; RICHARDSON, A.C.; PATTERSON, K.J.; MARTIN, P.J. Prediction of final weight for Actinidia chinensis
‘Hort1 6A’ fruit. New Zealand Journal of Crop and Horticultural
Science, v.31, p.147‑157, 2003.
NACIF, S.R. Ontogenia e crescimento do fruto do
maracujá‑amarelo (Passiflora edulis var. flavicarpa). 1991.
60p. Dissertação de Mestrado – Universidade Federal de Viçosa, Viçosa.
NORMAND, F.; LÉCHAUDEL, M. Toward a better interpretation and use of thermal time models. Acta Horticulturae, v.707, p.159‑165, 2006.
OPARA, L.U. Fruit growth measurement and analysis.
Horticultural Reviews, v.24, p.373‑431, 2000.
RODRÍGUEZ, M.; ARJONA, H.E.; CAMPOS, H.A. Caracterización fisicoquímica del crecimiento y desarrollo de los frutos de feijoa (Acca sellowiana Berg) en los clones 41 (Quimba) y 8‑4. Agronomía Colombiana, v.24, p.54‑61, 2006.
RODRÍGUEZ, W.; FLÓREZ, V.J. Comportamiento fenológico de tres variedades de rosas rojas en función de la acumulación
de la temperatura. Agronomía Colombiana, v.24, p.247‑257,
2006.
SALAZAR, D.M.; MELGAREJO, P.; MARTÍNEZ, R.; MARTÍNEZ, J.J.; HERNÁNDEZ F.; BURGUERA, M. Phenological stages of the guava tree (Psidium guajava L.). Scientia Horticulturae, v.108, p.157‑161, 2006.
SILVA, E.P. da; VILAS BOAS, E.V. de B.; RODRIGUES, L.J.; SIQUEIRA, H.H. Caracterização física, química e fisiológica de gabiroba (Campomanesia pubescens) durante o desenvolvimento. Ciência e Tecnologia de Alimentos, v.29,
p.803‑809, 2009.
TRUDGILL, D.L.; HONEK, A.; LI, D.; VAN STRAALEN, N.M. Thermal time – concepts and utility. Annals of Applied Biology, v.146, p.1‑14, 2005.
VALLILO, M.I.; GARBELOTTI, M. L.; OLIVEIRA, E.; LAMARDO, L.C.A. Características físicas e químicas dos frutos do cambucizeiro (Campomanesia phaea). Revista Brasileira de
Fruticultura, v.27, p.241‑244, 2005.
YURI, J.A.; GONZÁLEZ TALICE, J.; VERDUGO, J.; POZO, A. del. Responses of fruit growth, quality, and productivity to crop load in apple cv. Ultra Red Gala/MM111. Scientia Horticulturae, v.127, p.305‑312, 2011.