BJRS
RADIATION SCIENCES
08-01 (2020) 01-18ISSN: 2319-0612 Accepted: 2019-11-11
Dosimetric evaluation of electron beam Monte Carlo
isodoses distribution based on thermoluminescent
dosimetry
Gonçalves
aF.R., Vianello
aE.A., Viamonte
aA., Viegas
aC.C.B.
a Instituto Nacional de Câncer José Alencar Gomes da Silva, 20230-130, Rio de Janeiro, RJ, Brazil
ABSTRACT
Electron beams are applied in radiotherapy treatments where superficialized doses are desirable as well as deeper tissues sparing. Monte Carlo method has been recently implemented in the TPS as the algorithm for electron beam isodoses calculation at the National Institute of Cancer in Brazil. This work comprises an additional method of evaluation of the isodoses generated by the TPS, considering the irradiation of a non-flat surface. A 6-Gy electron beam breast irradiation was planned and delivered to an anthropomorphic phantom into which 36 capsules with TLD100 were inserted. The TLD calibration curve was performed from 100 cGy to 700 cGy. In an overall analysis, eMC algorithm isodose distribution results agreed with TLD measured doses. 75% of measured data met the 5% accuracy criteria, which can be considered in good agreement with the recommended uncertainties involved in a radiotherapy treatment. Considered all collected data, 8 TLDs received extremely low doses and due to tissue attenuation of the electron beam, the TLD measurements might have additional uncertainties. If these data are not taken into account, 100% of the measured doses, considering the uncertainties, meet the 5% accuracy criteria. About the 3 methods for isodose smoothing available in the eMC algorithm, the low level of dose smoothing option provides the best matching with measured data, consisting of the most reliable option. Considering the AAPM recommendations eMC algorithm offers an accurate solution for isodoses calculation, within a 5% accuracy.
1. INTRODUCTION
In radiotherapy, electron beams usually find applications in the treatment of superficial tumors, such as in some head and neck cancers, chest wall irradiation for breast cancer, gynecomastia, lip cancers, skin cancers, either epithelial or cutaneous T-cell lymphoma, and nodes boosts[1].
In recent years, there has been a significant improvement in the calculation algorithms, regarding both its accuracy and calculation time. In routine practice, monitor units for electron beam treatments can be either calculated manually or by commercial commissioned softwares. Pencil beam (PB) is widely known and a relatively simple algorithm used for calculating and visualizing isodose distributions. It is based on the Fermi-Eyges solution to the electron transport equation in which one considers multiple scattering of a pencil beam and, due to its simplifications, it cannot accurately estimate doses in systems with heterogeneities and air cavities, as well as with other perturbations like backscatter from high-density structures such as bones[2]. Considering its limitations and inaccuracy in some scenarios, pencil beam dose calculation is rarely performed in some institutions [1].
Due to advances in dose engines, nowadays some treatment planning systems (TPS) are able to accurately estimate dose distribution for electron beams with more sophisticated algorithms. Monte Carlo simulations take into account both phantom and radiation source characteristics, simulating a great number of particle histories, following them since their source through air and human tissues to where they scatter and deposit energy. Considering the sum of all small amounts of energy depositions in the irradiated volume, a 3-dimensional dose distribution can be created and it provides an accurate alternative for calculating dose distributions. Although, it takes a long time to perform the calculation, which is an important practical limitation. A remarkable solution is the Macro-Monte Carlo (MMC) method, that allows a significant improvement in dose calculation time; it is based on the Monte Carlo technique with a local-to-global approach: it works with a pre calculated database of probability distribution functions. This database contains information of simulations of the transport of incident electrons of different energies through small spheres of diverse materials and sizes likely to be needed for the macro Monte Carlo calculation. Using these
data, the step calculation for primary particles is significantly reduced and the calculation time becomes shorter [3].
The Eclipse TPS employs a fast implementation of the Macro Monte Carlo (MMC) method for electron dose calculations. This algorithm in Eclipse offers 3 different smoothing options: no smoothing, 2D Median and 3D Gaussian. The latter 2 options can be applied with low, medium or strong smoothing level. The 2D Median dose smoothing method takes the value of a pixel as the medium value of the pixels around it on a slice and it has been shown to remove the real dose gradient in inhomogeneous phantoms [4]. The 3D Gaussian smoothing uses standard 3D convolution methods, convolving the dose distribution with a 3D Gaussian. The standard deviation for low, medium and strong levels smoothing is equal to 0.5, 1 and 1.5 times of grid size, respectively.
MMC has been shown that it outperforms pencil beam algorithms in inhomogeneous phantoms[1]. Regarding different topologies, it has been shown that for some clinical-similar scenarios, eMC can tackle the topology problem within an accuracy of 3% and up to 6% for the lowest energies encountered[5]. For these studies in vitro measurements, different dosimeters have been employed: ionization chambers, diodes, thermoluminescent dosimeters.
Thermoluminescent dosimeters (TLD) based on LiF:Mg,Ti, also known as TLD100, have been widely employed in health and medical physics dosimetry, for both photon and electron beams, due to its simplicity, great spatial resolution and its ability to be used for integrating dose over large periods of time without the need of a bias supply[6]. It has been successfully employed in a Brazilian postal system of photon beams evaluation conducted by the National Institute of Cancer since 2003[7]. TL dosimetry has shown good repeatability and reproducibility levels with a confidence level of 95%[8].
Nevertheless, for electron beams the TLD response per unit dose is energy-dependent, making the use of TLD inherently more complicated than for photons[6,9]. Despite this fact, it has been successfully used for evaluation of pencil beam algorithm (PBA), pencil beam redefinition algorithm (PBRA)[10] and Eclipse electron Monte Carlo algorithm (eMC)[11]. Evaluation of eMC has also been performed in water using p-type silicon diode detectors and different setups to consider both tissue inhomogeneities and surface irregularities. eMC calculated data and the measured doses matched to within 2% relative to the normalization dose[12].
At the National Cancer Institute (INCA, Rio de Janeiro, Brazil), the eMC algorithm has been recently implemented in the TPS. There has been observed a great discrepancy in some cases, with complex geometry and/or considerable inhomogeneities, comparing the manual calculation and the monitoring units given by the algorithm, in the order of 10-15%. So this work consists of a complementary method of algorithm evaluation, taking into account not only point doses, previously evaluated as recommended by the AAPM[13], but the isodoses distribution generated by the algorithm. The 3D Gaussian smoothing option was chosen for this study and the its 3 possible levels were analyzed and compared to the measured doses.
2. MATERIALS AND METHODS
A breast irradiation with a single dose of electron beam radiotherapy (6 Gy) was planned and delivered to a female anthropomorphic chest phantom. The chest phantom has 36 dosimetry holes in the breast, divided into 3 layers as shown in Figure 1. All holes were filled with LiF:Mg,Ti thermoluminescent dosimeters (TLD100). The TLD powders were encapsulated in 3 mm diameter polystyrene cylinders with different heights depending on the layer (1st layer: 20 mm, 2nd layer: 23 mm, 3rd layer: 17 mm).
Figure 1: Transversal view of the female anthropomorphic chest phantom. The breast is divided into 3 layers of different heights. The top 2 layers were filled with 8 TLD each and the bottom layer
The phantom was CT scanned with the 36 TLDs and 2 additional TLDs were placed on the chest to take this dose into account. The planning was made considering a hypothetical treatment area comprising the 1st layer of the breast. Subsequently the TLDs were subjected to irradiation of a 6 MeV electron beam from a Trilogy® linear accelerator (Varian Medical Systems, Palo Alto, CA, USA), with fixed source to surface distance (SSD) of 100 cm, 10 cm x 10 cm electron beam applicator. The prescribed dose percentage was 80%, plan normalization value was 100% and no normalization method was chosen. The field normalization method was standard inverse square law normalization and the field dose was normalized 100% to the maximum dose and was smoothed on the field central axis. These settings resulted on a total of 729 monitoring units (MU). The linac is calibrated to deliver 1 cGy/MU.
It is known [14] that extended SSD does not have a significant effect on the buildup region of the depth-dose curve for 6-MeV electron beam and the depth dose curves seems to be very similar for the different SSD for 6 MeV electron beam. The effect of extended SSD is more pronounced for higher energies electron beams.
At INCA, over 95% of electron beam treatment irradiation is performed using the 10 cm x 10 cm electron applicator, so this study was conducted with this applicator size, and with SSD 100 cm. Other electron applicator sizes will be considered for further studies, as well as other energy electron beams and extended SSD.
To establish a calibration curve, ie. a relation between the irradiated dose and the counts measured by the TLD reader, some TLDs were calibrated using a water phantom at the reference depth for the 6 MeV beam, i.e 1.34 cm, SSD 100 cm, in the range of 100 cGy to 700 cGy, with steps of 100 cGy. To assure they have been exposed to the desired doses, an absolute dosimetry, following the TRS-398[15], with a parallel plate chamber (from PTW, model Markus Advanced) in a water phantom was performed at the AL right before the irradiation.
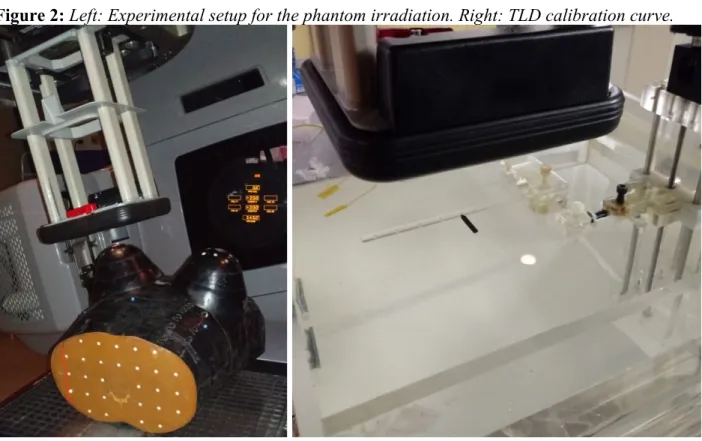
Figure 2 shows both the experimental setup for the phantom irradiation and for the irradiation of the TLDs in water to obtain the calibration curve.
The breast phantom irradiation procedure was repeated 4 times and each TLD capsule content was divided into at least 5 samples for reading, in the case of the smaller ones, and up to 7 samples, for the big ones. Therefore, an estimate dose for each TLD was obtained considering the average dose of at least the 20 obtained values.
For comparison purposes in this work, the dose distribution was calculated through Eclipse TPS (Varian Medical Systems, Palo Alto, CA, USA), version 13.6, using Electron Monte Carlo algorithm, version 13.6.23, and the dose estimation of each TLD was taken as the mean dose.
The TLD readouts were performed 7 days after each irradiation in a PCL3 (Fimel, France) reader. All procedures of this work were conducted at INCA - National Cancer Institute, Rio de Janeiro, Brazil.
Figure 2: Left: Experimental setup for the phantom irradiation. Right: TLD calibration curve.
3. RESULTS AND DISCUSSION
The calibration was performed comparing the obtained TLD readings to the set dose-corresponding MU right after the absolute dosimetry procedure.
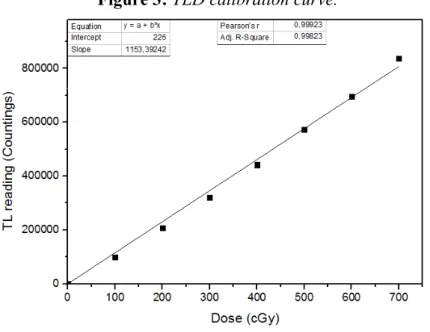
Figure 3 shows the calibration curve and the best fit to the measured points (R² = 0.99823). As one always get a background from the PCL3 reader, the fit was performed adjusting the 0 cGy dose to match the background.
Figure 3: TLD calibration curve.
Dose estimation in this study is quite challenging once there are uncertainties due to both the dose gradients involved and the positioning.
For the calibration curve, seven readings were done from each TLD capsule and the value for each dose point was taken as the mean of these readings. The uncertainty was taken as the arithmetic mean of the mean standard deviations distribution for the four TLDs irradiated with the same dose.
Considering the breast irradiation, for each TLD a high resolution structure was drawn in the CT image at their corresponding positions. The dose distribution was estimated through the eMC algorithm and the mean dose value for each structure was taken as the reference for comparison purposes. As shown in Figure 4, the TLDs are in regions of steep gradients.
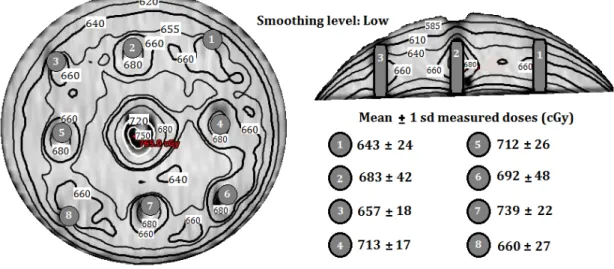
Figure 4: Isodose distribution for the 1st layer, using the low level 3D Gaussian smoothing. All
doses of the isodose lines are in cGy. The TLDs are shown in grey with their number code in white. At left, beam eye view taken at half height of the layer. At upper right, transversal view of the 1st
layer.
Figure 5: Isodose distributions for the 2nd layer, using the low level 3D Gaussian smoothing. All
doses of the isodose lines are in cGy. The TLDs are shown in grey with their number code in white. At left, beam eye view taken at half height of the layer. At upper right, transversal view of the 2nd
layer.
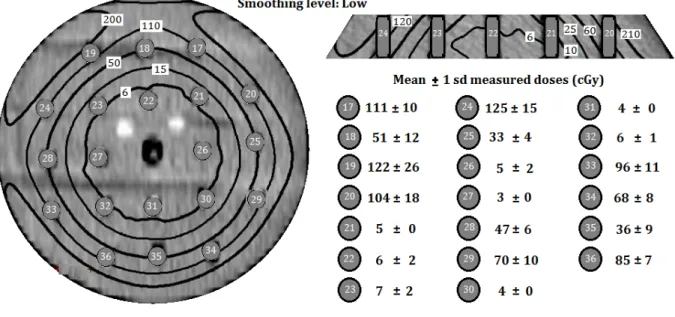
Figure 6: Isodose distributions for the 3rd layer, using the low level 3D Gaussian smoothing. All
doses of the isodose lines are in cGy. The TLDs are shown in grey with their number code in white. At left, beam eye view taken at half height of the layer. At upper right, transversal view of the 3rd
layer.
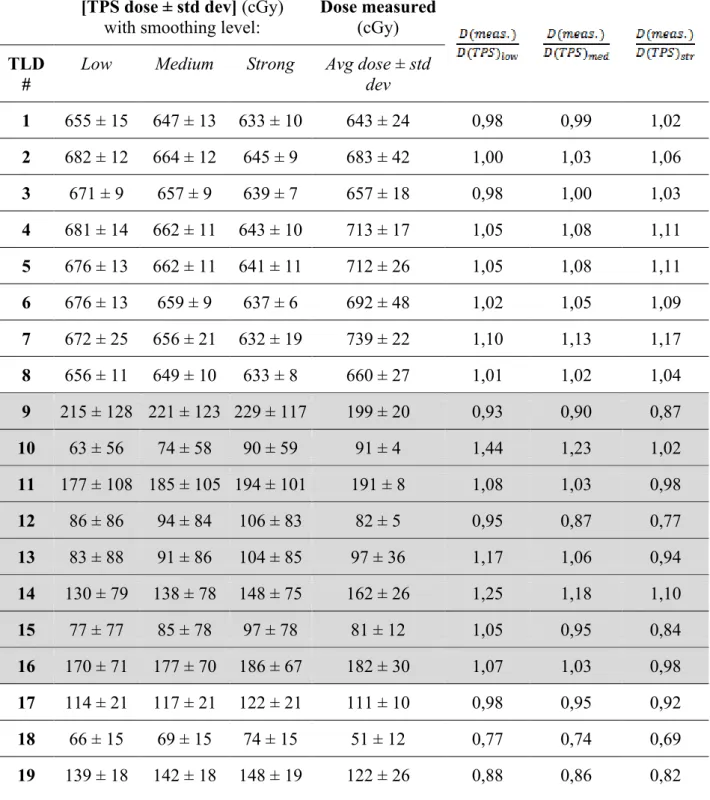
According to the Varian algorithms reference guide [3], choosing a strong level of dose smoothing may cause the deterioration of the shape of the dose distribution in the high gradient areas, although it does not define the acceptable range of gradients for which it may be used. For this analysis, one can compare the estimated dose for a low level of smoothing and also the medium and the strong levels. Table 1 shows the results of the 3 options of dose smoothing level mean doses for each TLD and the average dose of the four measurements taken, as well as their relation.
Table 1: TPS mean doses, in cGy, for each TLD with different smoothing levels, average doses of the performed measurements for each TLD and their relation to the predicted TPS doses. The 1st
layer contains from TLD#1 to TLD#8, 2nd layer contains from TLD#9 to TLD #16 and 3rd layer from TLD#17 to TLD#36.
[TPS dose ± std dev] (cGy)
with smoothing level: Dose measured (cGy)
TLD
# Low Medium Strong Avg dose ± std dev
1 655 ± 15 647 ± 13 633 ± 10 643 ± 24 0,98 0,99 1,02 2 682 ± 12 664 ± 12 645 ± 9 683 ± 42 1,00 1,03 1,06 3 671 ± 9 657 ± 9 639 ± 7 657 ± 18 0,98 1,00 1,03 4 681 ± 14 662 ± 11 643 ± 10 713 ± 17 1,05 1,08 1,11 5 676 ± 13 662 ± 11 641 ± 11 712 ± 26 1,05 1,08 1,11 6 676 ± 13 659 ± 9 637 ± 6 692 ± 48 1,02 1,05 1,09 7 672 ± 25 656 ± 21 632 ± 19 739 ± 22 1,10 1,13 1,17 8 656 ± 11 649 ± 10 633 ± 8 660 ± 27 1,01 1,02 1,04 9 215 ± 128 221 ± 123 229 ± 117 199 ± 20 0,93 0,90 0,87 10 63 ± 56 74 ± 58 90 ± 59 91 ± 4 1,44 1,23 1,02 11 177 ± 108 185 ± 105 194 ± 101 191 ± 8 1,08 1,03 0,98 12 86 ± 86 94 ± 84 106 ± 83 82 ± 5 0,95 0,87 0,77 13 83 ± 88 91 ± 86 104 ± 85 97 ± 36 1,17 1,06 0,94 14 130 ± 79 138 ± 78 148 ± 75 162 ± 26 1,25 1,18 1,10 15 77 ± 77 85 ± 78 97 ± 78 81 ± 12 1,05 0,95 0,84 16 170 ± 71 177 ± 70 186 ± 67 182 ± 30 1,07 1,03 0,98 17 114 ± 21 117 ± 21 122 ± 21 111 ± 10 0,98 0,95 0,92 18 66 ± 15 69 ± 15 74 ± 15 51 ± 12 0,77 0,74 0,69 19 139 ± 18 142 ± 18 148 ± 19 122 ± 26 0,88 0,86 0,82
20 128 ± 17 134 ±18 142 ± 19 104 ± 18 0,81 0,78 0,73 21 8 ± 1 9 ± 2 11 ± 2 5 ± 0 0,59 0,52 0,42 22 5 ± 0 6 ± 0 6 ± 1 6 ± 2 1,12 0,93 0,95 23 7 ± 1 9 ± 1 11 ± 2 7 ± 2 0,99 0,77 0,64 24 117 ±17 122 ± 17 129 ±18 125 ±15 1,07 1,03 0,97 25 44 ± 10 48 ± 10 53 ± 10 33 ± 4 0,74 0,68 0,62 26 5 ± 0 6 ± 0 6 ± 0 5 ± 2 0,96 0,80 0,85 27 5 ± 0 6 ± 0 6 ± 0 3 ± 0 0,69 0,57 0,61 28 46 ± 10 49 ± 10 54 ± 10 47 ± 6 1,02 0,96 0,87 29 77 ± 11 80 ± 11 86 ± 12 70 ± 10 0,91 0,88 0,81 30 7 ± 1 7 ± 1 9 ± 1 4 ± 0 0,53 0,53 0,42 31 6 ± 0 5 ± 0 6 ± 0 4 ± 0 0,59 0,71 0,64 32 7 ± 1 8 ± 1 11 ± 2 6 ± 1 0,79 0,69 0,52 33 102 ±13 107 ± 14 114 ± 15 96 ± 11 0,95 0,90 0,84 34 76 ± 9 80 ± 9 87 ± 10 68 ± 8 0,89 0,85 0,78 35 46 ± 7 49 ± 7 55 ± 8 36 ± 9 0,78 0,73 0,66 36 79 ± 10 84 ± 11 92 ± 12 85 ± 7 1,08 1,02 0,93 As the TLDs on the 3 layers of the phantom breast receive doses with different orders of magnitude and different dose distributions, as can be seen on Figure 7, one would better analyze them separately.
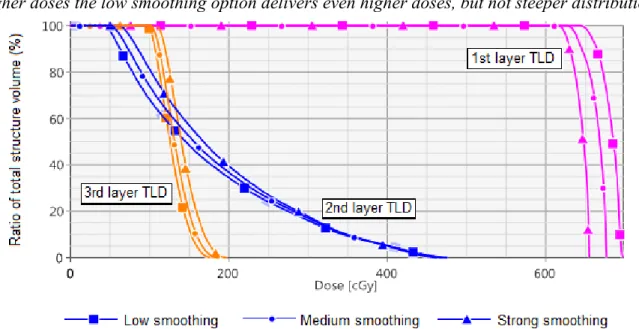
Figure 7: Dose volume histogram (DVH) showing the different dose distribution for one TLD located on the 1st layer, one TLD located on the 2nd layer and one TLD located on the 3rd layer. For
smaller doses, the low level of smoothing produces dose distributions with lower doses, while for higher doses the low smoothing option delivers even higher doses, but not steeper distributions.
For the 1st layer, which comprises from TLD #1 to TLD #8 and is a region with steep dose
gradients, most calculated relations of “Dose(measured)/Dose(TPS)” are within an error of ±5%, considering the uncertainties involved, as shown in Figure 8.
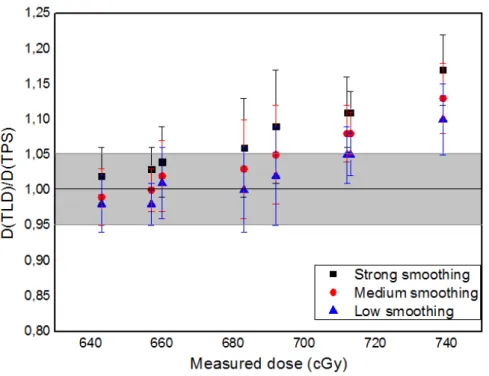
Figure 8: Relation between estimated TPS dose and average measured dose for the TLDs in the 1st layer of the phantom breast, TLDs #1 to #8.
The colored region represents the range between 1.05 and 0.95. The uncertainties were estimated based on the standard deviation exhibited in the DVH for each TLD mean dose and the one of the measured doses.
In 75% of the measurements the low level of smoothing has given values closer to the ones measured, as expected according to the Varian algorithms reference guide [3], once these TLDs are in a steep gradient region and the strong smoothing is expected to deteriorate the shape of the dose distribution in this kind of cases.
For the 2nd layer TLDs, which comprises from TLD#9 to TLD#16, the dose distribution is quite wide, ie. different parts of the tiny TLD container receives significantly different doses, as shown in Figure 9. This produces a great standard deviation on the estimated TPS dose and also requires the measurement to be made with more caution. For these TLDs, the irradiated powder was premixed in a clean container before being separated in samples for the reading. Despite this special care, a large standard deviation was expected, as shown in Table 1.
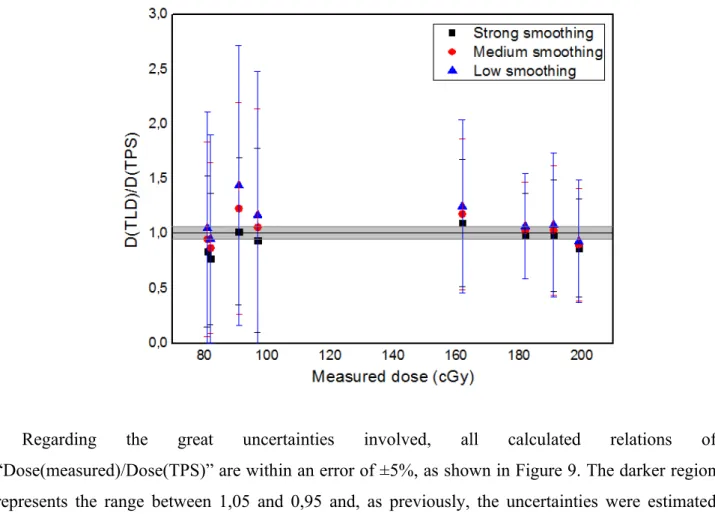
Figure 9: Relation between estimated TPS dose and average measured dose for the TLDs in the 2nd layer of the phantom breast, TLDs #9 to #16.
Regarding the great uncertainties involved, all calculated relations of “Dose(measured)/Dose(TPS)” are within an error of ±5%, as shown in Figure 9. The darker region represents the range between 1,05 and 0,95 and, as previously, the uncertainties were estimated based on the standard deviation exhibited in the DVH for each TLD average dose and the measured ones. In this case, all smoothing levels give very similar results, ie. statistically equivalent.
The 3rd layer comprises from TLD#17 to TLD#36. The central TLDs received quite small doses and the other ones were located in regions receiving a large range of dose along the TLD capsules, producing considerable standard deviations, as previously shown in Table 1.
For this set of TLDs, the low smoothing level also provided the best matching doses, considering the uncertainties (ie. in 73% of analyzed data).
Figure 10: Relation between estimated TPS dose and average measured dose for the TLDs in the 3rd layer, TLDs #17 to #36.
As shown in Figure 10, considering the uncertainties, which were estimated as in the previous cases, only 50% of measured doses were within ±5% of error.
In this case, one also must consider that the tissue between the electron beam and the TLDs can cause the arriving electrons to vary their energy as they reach the capsules and as TL dosimeters are known for having an energy dependence, it may be a source of additional errors. And for these low-dose regions a variation of a couple of cGy of the measured low-dose compared to the planned low-dose is very significant when relatively compared to the tiny calculated doses. But in relation to the prescription dose the variation is quite acceptable.
4. CONCLUSION
It is known that the irradiated surface shape as well as the inhomogeneities of the media involved have a considerable influence in the isodose distribution in the particular case of electron beams. In an overall analysis, eMC algorithm calculated isodose distribution results were in good
agreement with TLD measured doses in an anthropomorphic phantom breast. 75% of measured data met the 5% accuracy criteria, which can be considered in good agreement with the recommended uncertainties involved in a radiation therapy treatment [15]. Considered all collected data, 8 TLDs received extremely low doses and due to tissue attenuation of the electron beam, the TLD measurements might have additional uncertainties not estimated in the present work.
Also, for these low-dose regions, a slightly variation of a couple of cGy in the measured dose compared to the planned dose is quite significant when relatively compared to the tiny calculated doses. But in relation to the prescribed dose the variation is quite acceptable. For example, a region where the calculated dose is 5 cGy and the measurement indicates the dose of 6 cGy would give a 20% variation if one compares as above mentioned, relatively to the calculated dose of 5 cGy. But if one compares this tiny dose to the total irradiation dose of 600 cGy, this region would receive not 0,8% of the prescribed dose (5 cGy) but 1,0% (6 cGy), which is a quite acceptable variation.
If these data of low dose regions are not taken into account, 100% of the measured doses, considering the uncertainties, meet the 5% accuracy criteria.
About the 3 methods for isodose smoothing available in the eMC algorithm, the low level of dose smoothing option provides the best matching with measured data, consisting of the most reliable option. Considering the AAPM guidelines and recommendations [13], the eMC algorithm response matches the tolerance value of 5%.
REFERENCES
[1] ZHANG A, WEN N, NURUSHEV T, BURMEISTER J, CHETTY IJ. Comprehensive evaluation and clinical implementation of commercially available Monte Carlo dose calculation algorithm. J Appl Clin Med Phys, 14(2), p. 127–145, 2013.CEMBER, H. Introduction to health physics, 3rd ed. New York: MCGraw-Hill, 1996.
[2] CYGLER JE, BATTISTA JJ, SCRIMGER JW, MAH E, ANTOLAK J. Electron dose distributions in experimental phantoms: a comparison with 2D pencil beam calculations. Phys Med Biol. 32(9), p. 1073–1086, 1987.
[3] VARIAN MEDICAL SYSTEMS, Inc. Eclipse Photon and Electron Algorithms Reference Guide. Palo Alto, CA, United States of America, 2016.
[4] DING GX, DUGGAN DM, COFFEY CW, SHOKRANI P, CYGLER JE. First macro Monte Carlo based commercial dose calculation module for electron beam treatment planning—new issues for clinical consideration. Phys Med Biol. 51(11), p. 2781–2799, 2006.
[5] LAWRENCE SL, VAN LIESHOUT NHM, CHARLAND PM. Assessment of Eclipse electron Monte Carlo output prediction for various topologies. J Appl Clin Med Phys,16(3), p. 99-106,
2015.
[6] ROBAR V, ZANKOWSKI C, PLA MO, PODGORSAK, EB. Thermoluminescent dosimetry in electron beams: Energy dependence. Med Phys, 23, p. 667-73, 1996.
[7] INSTITUTO NACIONAL DE CÂNCER JOSÉ ALENCAR GOMES DA SILVA. Relatório-Resumo do Serviço de Qualidade em Radiações Ionizantes 2009-2010. INCA: Rio de
Janei-ro, 2012 - Only a Portuguese version is available.
[8] VIEGAS CBB. Dosimetria In Vivo Com Uso De Detectores Semicondutores E Termolumi-nescentes Aplicada Ao Tratamento De Câncer De Cabeça E Pescoço. Master Thesis.
Uni-versidade Federal do Rio de Janeiro, 2003.
[9] HOLT JG, EDELSTEIN GR, CLARK TE. Energy Dependence of the Response of lithium fluoride TLD rods in high energy electron fields. Phys Med Biol, 20, p. 559-570, 1975.
[10] CARVER RL, HOGSTROM KR, CHU C, FIELDS RS, SPRUNGER CP. Accuracy of pencil-beam redefinition algorithm dose calculations in patient-like cylindrical phantoms for bolus electron conformal therapy. Med Phys, 40 (7), 071720, p. 1-11, 2013.
[11] CARVER RL, SPRUNGER CP, HOGSTROM KR, POPPLE RA, ANTOLAK JA. Evaluation of the Eclipse eMC algorithm for bolus electron conformal therapy using a standard verification dataset. J Appl Clin Med Phys, 17(3), p. 52-60, 2016.
[12] BOYD RA, HOGSTROM KR, ANTOLAK JA, SHIU AS. A measured data set for evaluating electron-beam dose algorithms. Med Phys, 28(6), p. 950-958, 2001.
[13] SMILOWITZ JB, DAS IJ, FEYGELMAN V, FRAASS BA, KRY SF, MARSHALL IR, MIHAILIDIS DN, OUHIB Z, RITTER T, SNYDER MG, FAIROBENT L. AAPM Medical Physics Practice Guideline 5.a.: Commissioning and QA of Treatment Planning Dose
Calculations — Megavoltage Photon and Electron Beams. J Appl Clin Med Phys. 16(5),
p.14-34, 2015.
[14] SAW AB, PAWLICKI T, KORB LJ, WU A. Effects of Extended SSD on Electron-beam Depth-dose Curves. Medical Dosimetry, 19 (2), p.77-81, 1994.
[15] IAEA TRS-398. Absorbed Dose Determination in External Beam Radiotherapy: An
International Code of Practice for Dosimetry based on Standards of Absorbed Dose to Water. 2006.