Retrieval Of GammaCell 220 Irradiator Isodose Curves With MCNP Simulations And
Experimental Measurements
R.R. Rodrigues,∗S.E. Grynberg, A.V. Ferreira,†L.C.M. Belo,‡ and P.L. Squair§
Centro de Desenvolvimento da Tecnologia Nuclear (CDTN), Av. Presidente Antˆonio Carlos, 6627 – Caixa Postal 941,
Pampulha, Belo Horizonte, MG, CEP 31270-901, Brasil
R.V. Sousa¶ and R.C.O. Sebasti˜ao∗∗
Universidade Federal de Minas Gerais (UFMG), Instituto de Ciˆencias Exatas – Departamento de Qu´ımica
M.A. Ribeiro††
Centro de Desenvolvimento da Tecnologia Nuclear (CDTN), Av. Presidente Antˆonio Carlos, 6627 – Caixa Postal 941, Pampulha, Belo Horizonte, MG, CEP 31270-901, Brasil and
Universidade Federal de Minas Gerais (UFMG), Instituto de Ciˆencias Exatas – Escola de Engenharia Qu´ımica, Av. Presidente Antˆonio Carlos, 6627, Pampulha, Belo Horizonte, MG, CEP 31270-901, Brasil
(Received on 29 January, 2010)
Gamma irradiator facilities can be used in a wide range of applications such as biological and chemical researches, sterilization of medical devices and products. Dose mapping must be performed in these equipments in order to establish plant operational parameters, as dose uniformity, source utilization efficiency and maximum and minimum dose positions. The isodoses curves are measured using dosimeters or computer simulations. This work evaluates the absorbed dose in the CDTN/CNEN GammaCell Irradiation Facility, using the Monte Carlo N-Particles (MCNP) code.
Keywords: Monte Carlo; GammaCell 220; Isodose; Dosimetry; MCNP
INTRODUCTION
The industrial irradiator GammaCell 220 was originally manufactured by Atomic Energy of Canada Limited (AECL) which is now part of MDS Nordion International. It was de-veloped for high dose rate gamma radiation researches and studies. It can be used in a wide variety of research areas, like food irradiation, geology, medical area, material research, ra-diation effects on biological systems, sterilization of organ-isms and soils, changing and improving properties of poly-mers, and others. This equipment uses60Co doubly
encap-sulated in aluminum and stainless steel tubes, fixed within a lead shield, and the operator is not exposed to the emitted ra-diation. The GammaCell exposure chamber has a cylindrical geometry with 20.3 cm height and 7.5 cm radius. The man-ufacturer’s calibration certificate states a dose rate of (4.43±
0.16)×103 Gy/h on 08/28/1962 in the center of the
expo-sure chamber. Figure 1 shows the isodoses provided by the manufacturer in 1962 [1].
Isodose curves are generally measured using dosimeters distributed throughout the device. This procedure consumes a large amount of dosimeters, irradiation time and man-power [2]. The use of mathematical methods and radia-tion transport codes can reduce significantly this problem, al-though complex and time-consuming codes might be
neces-∗Electronic address:[email protected] †Electronic address:
[email protected] ‡Electronic address:[email protected] §Electronic address:[email protected]
¶Electronic address:[email protected] ∗∗Electronic address:[email protected]
††Electronic address:[email protected]
sary [3,4]. Monte Carlo methods make possible to calculate various parameters like flux, fluence, energy spectra and ab-sorbed dose [1,5-7].
The Monte Carlo code requires an input file with informa-tion such as the geometry specificainforma-tion, descripinforma-tion of materi-als, selection of cross-section reactions, location and charac-teristics of the radiation source, type of answers desired and variance reduction techniques [2,5,8]. The aim of this work is to perform a dose mapping simulation for the CDTN/CNEN GammaCell 220 using this code. The results of the simula-tion will be validated with experimental results obtained by FRICKE and TLD dosimetry.
METHODOLOGY
The MCNP Code
The MCNP is a general-purpose Monte Carlo N-Particle code that can be used for various types of ionizing radia-tions like neutron, photon and electron, among others. An input file created by the user is read by MCNP. It contains informations about the problem in areas such as the geome-try specification; the description of materials and selection of cross-section evaluations; the location and characteristics of the neutron, photon, or electron source; the type of answers or tallies desired; and any variance reduction techniques used to improve efficiency [5].
phe-
FIG. 1: GammaCell 220 certified isodoses.
nomenon is quite large and a powerful computer has to be used for the simulations. The statistical sampling process is based on the selection of random numbers. The code follows each of many particles from a source throughout its life to its death, considering all the probable events like absorption and escape.
It is necessary to associate nuclear data tables with this code. There are nine classes of data tables for MCNP:
• continuous-energy neutron interaction data;
• discrete reaction neutron interaction data;
• continuous-energy photoatomic interaction data;
• continuous-energy photonuclear interaction data;
• neutron dosimetry cross sections;
• neutronS(α,β) thermal data;
• multigroup neutron, coupled neutron/photon, and charged particles masquerading as neutrons;
• multigroup photon;
• electron interaction data [5].
The available tally cards provide these informations: sur-face current; sursur-face flux; track length estimate of cell flux; flux at a point (point detector); track length estimate of energy
deposition; track length estimate of fission energy deposition; and energy distribution of pulses created in a detector. The MCNP Simulations
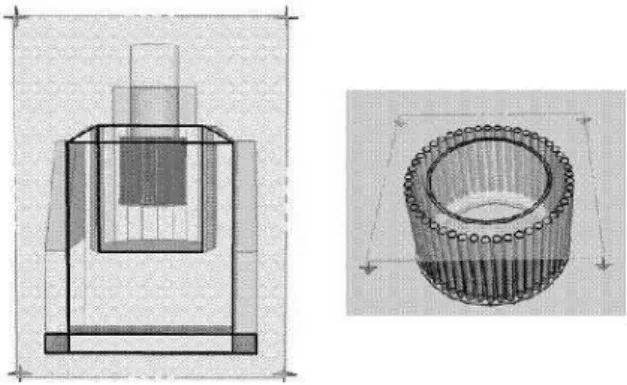
The simulations of the industrial irradiator GammaCell 220 were carried out by the MCNP-4B radiation transport code. The irradiator geometry was simulated as closely as possible to reproduce the experimental setup. Figure 2 shows the sim-ulated geometry.
FIG. 2: Frontal cut-away view of GammaCell 220 and top view of sources.
The input file contains 240 surfaces and 90 cells. There are 5460Co cylindrical sources of 0.3594 cm radius and 24.6276 cm length doubly encapsulated in aluminum and stainless steel tubes. Radioactive decay was taken into account in the simulation, and nickel concentration was introduced in the material definition of the sources. The cylindrical sources are separated from the exposure chamber by an aluminum and stainless steel shell of 0.2 cm thick with 7.5 and 7.7 cm inner radius, respectively. Outside the sources, a structure consti-tuted by a lead shield was designed.
The sources were simulated using thesdef card, where the photon emission starting points are centered in the 54 cylin-ders. The extension and emission spectrum was defined as a Maxwellian distribution, appropriated for this problem, to-gether with the efficiency specification. The two energy peaks of60Co: 1.17321 and 1.332491 MeV with 0.9986 and 0.9998
probabilities were also considered in the simulation.
The tally cards used were F4 (flux in a cell, measured in photons/cm2), being modified by a dose function using thede anddf cards. These tallied quantities, C, can be represented as
C= Z
ϕ(E)f(E)dE (1)
withϕ(E)the energy-dependent fluency andf(E) the product quantities in the cross-section libraries. The ring detectors are positioned at half height and a bigger importance in the central detectors was also adopted.
Experimental Dosimetry
a) Thermoluminescent Dosimetry
Each TLD crystal has approximately 3×3×1 mm3. The sample-holder was loaded with the TLD’s and accommodated in the GammaCell exposure chamber at half height. The set was irradiated with a nominal dose of 4.0 Gy. The nomi-nal dose value in the experiments corresponds to the expected dose calculated with the certificated dose rate and the radioac-tive decay law. The TLD’s analyses were done in a Harshaw TLD reader model 4500. This entire procedure was repeated four times.
FIG. 3: TLD’s sample-holder diagram.
b) Fricke Dosimeter
The Fricke dosimeter is a chemical dosimeter consisting of an aqueous solution of sulfuric acid and ferrous sulfate in the following composition: 1 mM FeSO4+0.8 N H2SO4+
1 mM NaCl. The irradiation of the Fricke solution causes radiolysis of water and as a secondary reaction, oxidize the ferrous ions to ferric ions, which in turn have a strong opti-cal absorption with peaks at wavelengths 224 nm and 304 nm [9]. The Fricke dosimeter is an absolute dosimeter (requires no calibration) and the absorbed dose is determined from the yield of ferrous ions, determined by spectrophotometers. This study used a Shimadzu UV1240 spectrophotometer. The Fricke dosimeters were placed in cylindrical glass containers with internal dimensions of 40 mm in height and 10 mm in di-ameter. Five measurements were performed with the dosime-ters placed in the central portion of the chamber, with nominal doses of 50, 90, 150, 200 and 250 Gy. Subsequently seven-teen samples were irradiated in a circular arrangement at the half height: eight samples were placed at maximum radius of the exposure chamber, other eight in half of the radius, and one in the center. This sample set was irradiated with nominal dose of 160 Gy.
RESULTS AND DISCUSSIONS
Thermoluminescent Dosimetry
The dose results measured using TLD’s are shown in Fig-ure 4. In this representation the doses were normalized in re-lation to the dose measured at the central position. The TLD’s results indicate that along the B direction there is a greater symmetry in the doses distribution than along the A direc-tion. The observed asymmetry was not expected considering the isodose curves supplied by the equipment manufacturer (see Fig. 1).
FIG. 4: TLD experimental doses
FRICKE Dosimetry
The results obtained with the Fricke dosimeters, at the cen-tral volume of the irradiation chamber for different doses are shown in Figure 5. The dependence observed between the evaluated doses and the nominal doses is linear, with evalu-ated values 7% higher than nominal values in average.
FIG. 5: Measured doses for GammaCell 220 with Fricke dosimeters positioned at the center of the exposure chamber
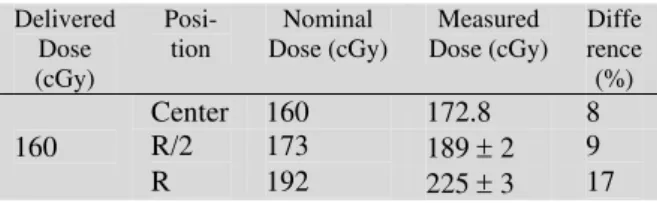
nominal dose of 160 Gy are shown in Figure 6.
FIG. 6: Experimental doses at the plan in the half height of Gamma-Cell 220 exposure chamber for a 160 Gy nominal dose
From Figure 6, it is observed that at the center, the mea-sured dose 172.8 Gy is 8% higher than the nominal dose 160 Gy, which agrees with the results showed in Figure 5. The mean measured values for gamma doses at half radius and radius are (189±2) Gy and (225±3) Gy respectively. These values are 9% and 17% higher than the expected ones (173 and 192 Gy) according to the Certificate and the decay law. These results are resumed at Table 1.
The difference between the expected and the measured doses increases with the radius. This behavior is not well understood yet. It indicates the need of performing further experiments to verify if there is a systematic measurement er-ror or if there is a real difference between the delivered doses and the certified ones.
In the representation of Figure 6 the doses were not normal-ized in relation to the dose measured at the central position. When the normalization is done, the dose delivered at half radius is 109% while the dose at radius is 130%.
Monte Carlo Simulations
Isodose curves simulation of the GammaCell 220 irradiator was performed using ring detectors with 1 cm height, 0.5 cm thickness and variable radius, as presented in Table 2. They were positioned at half height in the exposure chamber and 1×10⁶particle histories were considered in the simulation. The relative doses with respect to the central point are also presented in Table 2.
The accuracy of the MCNP calculations is mainly related to the input and can be verified by the experimental relative errors. For these ring detector positions, the evaluated rela-tive errors in comparison with the GammaCell 220 certified isodoses curves (1962) are presented in Table 3.
A valid confidence interval for dose calculation can be rep-resented by a smaller value of standard deviation, S, and vari-anceSx, which is evaluated in its usual meaning. The variance
TABLE 1: Comparison of nominal doses and measured doses.
Delivered Dose (cGy)
Posi-tion
Nominal Dose (cGy)
Measured Dose (cGy)
Diffe rence
(%)
Center 160 172.8 8
R/2 173 189 ± 2 9
160
R 192 225 ± 3 17
TABLE 2: Ring detector radius and simulated relative doses.
Ring detector radius (cm) Dose (%)
0.25 100
0.75 102
1.25 103
2.75 104
3.25 106
3.75 108
4.25 109
4.75 113
5.75 117
6.25 119
6.75 123
TABLE 3: Certified and Simulated GammaCell 220 isodoses comparison.
Radius (cm) Certified
isodoses - 1962 (%)
Simulated dose (%)
Relative error
(%)
3.00 105 104 0.95
4.55 110 109 0.90
5.81 115 117 1.74
6.90 120 123 2.50
is a convenient parameter to represent statistical accuracy. It was empirically verified in MCNP calculations that it should be less than 0.1 for reliable detectors. This value takes into account the contributions near to the detectors that are usu-ally extremely important and difficult to sample. The vari-ance evaluated for dose curves in each position is acceptable for this problem, being less than 0.05 for all detectors.
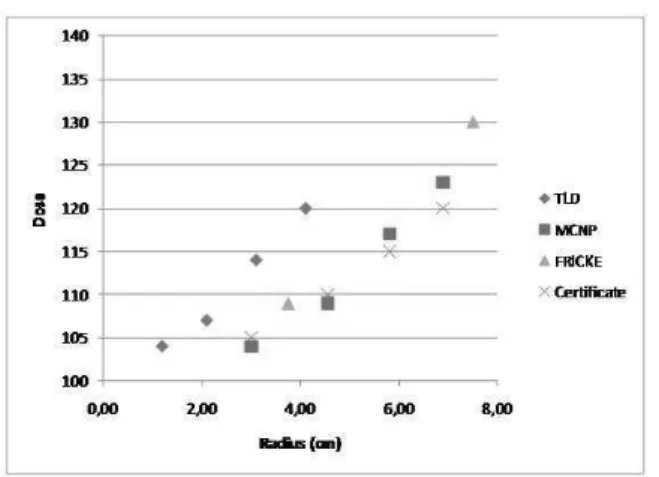
The MCNP simulated results were also compared with the Fricke and TLD results. Figure 7 plots values for the Gamma-Cell 220 certified isodoses from 1962 and the MCNP, TLD’s and Fricke normalized doses in function of the radius.
FIG. 7: GammaCell 220 certified isodoses and the MCNP, TLDs and FRICKE normalized doses in function of the radius
CONCLUSIONS
In this work experimental and simulated isodoses of Gam-maCell 220 was obtained. The simulation was performed using the Monte Carlo methodology and the experimental
curves were obtained by GammaCell 220 Certificate, Ther-moluminescent and FRICKE dosimeters. The simulation re-sults showed a good agreement with the GammaCell 220 cer-tificates, and except in one position (with relative error of 9%), the relative error with the experimental data is less than 3%, indicating that the simulation methodology can be used as a routine predictive tool of irradiation planning.
Dose evaluation is generally referred to a mass of air that occupies the entire chamber of gamma irradiator facilities. This routine does not take into account the peculiarities of each sample, especially with respect to volume, composition and density, which are essential parameters to determine the actual accumulated energy dose. The MCNP code developed here can also contribute in this sense, bringing a significant improvement in the irradiation planning.
Acknowledgments
Work supported by the Minas Gerais State FAPEMIG (Fundac¸˜ao de Amparo a Pesquisa do Estado de Minas Gerais).
[1] M. Sohrabpour, M. Hassanzadeh, M. Shahriari, M. Sharifzadeh, Gamma irradiator dose mapping simulation using the MCNP code and benchmarking with dosimetry.Applied Radiation and Isotopes57, pp. 537-542, 2002.
[2] C. Oliveira, J. Salgado, M. Lu´ısa Botelho, L.M.Ferreira. Dose determination by Monte Carlo – a useful tool in gamma radia-tion process.Radiation Physics and Chemistry57, pp. 667-670, 2000.
[3] G. Pi˜na-Villalpando and D.P. Sloan, Dose distribution studies of a gamma industrial irradiator using a PC code. Radiation Physics and Chemistry52, Nos. 1-6, pp. 563-567, Great Britain, 1998.
[4] C. Oliveira, J. Salgado, M. Lu´ısa Botelho, L.M. Ferreira. Monte Carlo studies for irradiation process planning at the Portuguese gamma irradiation facility.Applied Radiation and Isotopes53, pp. 867-875, USA, 2000.
[5] X-5 Monte Carlo Team.MCNP – A General Monte Carlo N-Particle Transport Code, Version 5. Volume I – Overview and
Theory. Los Angeles National Laboratory, University of Cali-fornia, USA, 2003.
[6] C. Oliveira, J. Salgado. Isodose distributions and dose unifor-mity in the Portuguese gamma irradiation facility calculated us-ing the MCNP code.Radiation Physics and Chemistry61, pp. 791-793, 2001.
[7] Weiss, Douglas E.; Johnson, William C.; Kensek, Ronald P. Dose distributions in tubing irradiated by electron beam: Monte Carlo simulation and measurement.Radiation Physics and Chemistry50, No. 5, pp. 475-485, Great Britain, 1997. [8] C. Oliveira, J. Salgado, A. Ferro de Carvalho. Dose rate
deter-minations in the Portuguese Gamma Irradiation Facility: Monte Carlo simulations and measurements. Radiation Physics and Chemistry58, pp. 279-285, 2000.