EFFECTS OF HYDROPEAKING AND REFUGE CONFIGURATIONS ON THE BEHAVIOUR
OF CYPRINIDS IN EXPERIMENTAL FLUME CONDITIONS
MARIA JOÃO FERREIRA RODRIGUES COSTA
Scientific Advisors:
Ph.D. Isabel Maria Bento de Matos Boavida
Ph.D. António Alberto do Nascimento Pinheiro
Ph.D. Steven J. Cooke
Ph.D. Maria Teresa Marques Ferreira
THESIS PRESENTED TO OBTAIN THE DOCTOR DEGREE IN
RIVER RESTORATION AND MANAGEMENT
2019
EFFECTS OF HYDROPEAKING AND REFUGE CONFIGURATIONS ON THE BEHAVIOUR
OF CYPRINIDS IN EXPERIMENTAL FLUME CONDITIONS
MARIA JOÃO FERREIRA RODRIGUES COSTA
Scientific Advisors:
Ph.D. Isabel Maria Bento de Matos Boavida
Ph.D. António Alberto do Nascimento Pinheiro
Ph.D. Steven J. Cooke
Ph.D. Maria Teresa Marques Ferreira
THESIS PRESENTED TO OBTAIN THE DOCTOR DEGREE IN
RIVER RESTORATION AND MANAGEMENT
Jury:
President: Doutora Manuela Rodrigues Branco Simões, Professora Auxiliar com Agregação, Instituto
Superior de Agronomia, Universidade de Lisboa
Members: Doutor Rui Manuel Vítor Cortes, Professor Catedrático, Escola de Ciências Agrárias e
Veterinárias, Universidade de Trás-os-Montes e Alto Douro
Doutora Maria Teresa Marques Ferreira, Professora Catedrática, Instituto Superior de Agronomia,
Universidade de Lisboa
Doutor Nicolas Lamouroux, Directeur de Recherche, Institut National de Recherche en Sciences et
Technologies pour l’Environnement et l’Agriculture, França
Doutora Maria Filomena de Magalhães, Professora Auxiliar, Faculdade de Ciências, Universidade de Lisboa
Instituições Financiadoras e âmbito:
Programa de doutoramento FCT (River Restoration and Management, FLUVIO)
2019
This thesis should be cited as:
Costa, M.J. (2019). Effects of hydropeaking and refuge configurations on the behaviour of cyprinids in experimental flume conditions. Ph.D. thesis, Instituto Superior de Agronomia, Universidade de Lisboa, Portugal.
i
Resumo
O regime de escoamento é essencial para manter a integridade ecológica dos ecossistemas fluviais. As rápidas alterações de caudal a jusante das centrais hidroelétricas (i.e. hydropeaking) decorrentes das variações do consumo de energia induzem alterações significativas do regime de escoamento. Estas, em conjunto com as alterações morfológicas e de qualidade da água daí decorrentes, afetam as comunidades piscícolas. Estabelecer uma relação de causa-efeito entre a variabilidade do escoamento e a resposta da ictiofauna é desafiante, tornando-se difícil propor medidas de mitigação adequadas. A primeira parte desta investigação consistiu numa revisão bibliográfica para encontrar informação sobre aquela relação. Diversos estudos demonstraram que a variabilidade do escoamento pode representar um potencial stress para a ictiofauna. No entanto, encontra-se por determinar se as alterações fisiológicas correspondem a uma resposta provisória ou permanente. Na segunda parte, os efeitos do hydropeaking e da presença de abrigos foram avaliados num canal experimental para o L. bocagei. Testaram-se diversas situações de hydropeaking, variando o caudal máximo, a frequência de variação e a respetiva duração. Testaram-se abrigos com diferentes geometrias: defletores (alternados ou unilaterais), e estruturas triangulares (pirâmides sólidas ou estruturas em V). Determinaram-se as concentrações de glucose e lactato, as frequências de uso dos abrigos e a atividade no canal. Caracterizaram-se o escoamento e as interações fluído-corpo através de um velocímetro acústico por efeito de Doppler (ADV), e de uma sonda de secção hidrodinâmica dotada de uma linha de sensores de pressão (LLP), procurando representar a linha lateral dos peixes. O comportamento foi diversificado e nem sempre proporcional à severidade do hydropeaking. Os defletores e as estruturas em V proporcionaram zonas de velocidade reduzida. No entanto, a complexidade do escoamento resultante reduziu a capacidade dos peixes para os encontrar. Determinaram-se limites de velocidade que asseguram o repouso do L. bocagei, estabeleceram-se relações entre as respostas e as alterações hidrodinâmicas e propuseram-se recomendações para medidas morfológicas e operacionais para mitigação do hydropeaking.
Palavras-chave
iii
Abstract
Flow regime regulates the ecological integrity of river ecosystems, shaping the structure and function of fish communities. The discharge fluctuations in hydropower plants in response to peak electricity demand (i.e. hydropeaking) result in rapid flow changes in tailwaters. The continued hydropower operations produced morphological, hydraulic and water quality alterations, affecting downstream fish. Fish responses to hydropeaking range from organism to life-cycle event changes. It is challenging to establish a cause-effect relationship between flow variability and a fish response, and to propose adequate mitigation measures. In the first part of this research, a literature review was conducted to find evidence for that relationship. The review showed that flow variability can represent a stressor for fish. However, it remained unclear if the responses were maladaptive. In the second part, the effects of hydropeaking and refuges were assessed for L. bocagei in an indoor flume. A multidisciplinary approach was adopted, where fish responses were combined with a hydraulic characterization. Peak events were tested by manipulating magnitude, peak frequency and duration. The refuges were lateral (meandering and one-sided deflectors) and instream (triangular pyramids and v-shaped) structures, tested along three experimental campaigns. Glucose and lactate (secondary responses), and movement behaviour (whole-animal responses) were assessed. The flow field and fluid-body interactions were characterized by using acoustic Doppler velocimetry and an artificial lateral line probe respectively. The movement patterns of L. bocagei were diverse and not always proportional to the severity of the flow event. Lateral deflectors and v-shaped structures provided low velocity areas. However, the created flow complexity represented an additional constraint for fish, reducing their ability to find them. Flow thresholds that represented the resting state of L. bocagei were identified, and specific movement patterns were related with hydrodynamic changes. Practical recommendations for operational schemes and for the implementation of mitigation measures to hydropeaking were proposed.
Keywords
v
Resumo Alargado
A variabilidade natural do regime de escoamento regula os processos físicos e biológicos que ocorrem no ecossistema fluvial, modelando a estrutura e função das suas comunidades. Devido à força evolutiva deste regime, as espécies que habitam estes ecossistemas desenvolveram características adaptativas para responder a tal variabilidade. Numa perspetiva temporal, a variabilidade intra- e interanual do regime de escoamento exerceu uma forte pressão evolutiva, por exemplo no que se refere a características morfológicas e reprodutivas. Por sua vez, a variabilidade intra-anual exerce uma pressão ecológica, atuando em atividades como a procura de refúgio, busca de alimento ou fuga de predadores. Considerando o papel regulador do regime de escoamento, qualquer perturbação natural ou antropogénica poderá afetar a estrutura das comunidades piscícolas.
A rápida expansão da população humana tem ocasionado uma utilização progressivamente mais intensa dos recursos hídricos. O progresso da agricultura através da irrigação, a melhoria da qualidade de vida através do desenvolvimento de estruturas de abastecimento e tratamento de água, o fornecimento de hidroeletricidade e o controlo de cheias são alguns dos benefícios daí retirados. No entanto, de tal utilização resultou a fragmentação dos ecossistemas fluviais e a redução da sua biodiversidade. A expansão global da produção de energia hidroelétrica é tida como uma das causas mais preocupantes para a sustentabilidade destes ecossistemas e para a resiliência das suas comunidades. A frequente variabilidade dos caudais turbinados nas centrais hidroelétricas (i.e. hydropeaking) para corresponder à variação da procura da energia elétrica ao longo do dia, induz alterações significativas do regime de escoamento a jusante. Estas, em conjunto com as alterações morfológicas e de qualidade da água daí decorrentes, afetam as comunidades piscícolas. As repostas da ictiofauna ao hydropeaking podem-se manifestar em diferentes níveis de organização biológica, como alterações fisiológicas e metabólicas, ou em alterações no recrutamento, crescimento ou reprodução. Estes efeitos foram extensivamente estudados em alguns grupos de ictiofauna (ex. salmonídeos). No entanto, não foi possível determinar uma relação causa-efeito entre a variabilidade do regime de escoamento e uma resposta mensurável, dificultando a conceção de medidas de mitigação adequadas. Em rios afetados por hydropeaking, registaram-se alterações laterais e longitudinais no movimento dos peixes, de maior ou menor amplitude. Outros estudos não constataram qualquer alteração do movimento, ou não foram bem-sucedidos na explicação de determinados padrões do movimento. Na impossibilidade de observar as preferências de habitat dos peixes, estes estudos atribuíram a variabilidade do movimento à potencial disponibilidade de refúgios. Embora os efeitos do hydropeaking tenham sido estudados, não foram propostas medidas de mitigação morfológicas para minimizar as suas consequências.
vi
realizados em instalações experimentais propuseram diferentes tipos de substrato, cobertura, estruturas semelhantes a defletores, ou zonas de descanso, a partir de respostas fisiológicas e da avaliação do comportamento e da performance de salmonídeos. Por outro lado, os efeitos do
hydropeaking e a conceção de medidas de mitigação para ciprinídeos, encontram-se pouco estudados.
No entanto, os ciprinídeos constituem a maior parte das comunidades de peixes da Península Ibérica, o número de endemismos é elevado e devido ao efeito biogeográfico e ao clima maioritariamente mediterrânico, as comunidade de ciprinídeos dos rios Ibéricos apresentam características adaptativas únicas.
Esta investigação dividiu-se em duas partes. Na primeira enquadraram-se os seguintes objetivos principais: (i) encontrar evidência científica para a relação causa-efeito entre a variabilidade no regime de escoamento e a existência de uma reposta mensurável dos peixes; (ii) fornecer conhecimento à comunidade científica para a seleção de respostas fisiológicas a utilizar como biomarcadores em condições de regime de escoamento natural e modificado. Na segunda, os objetivos principais foram: (i) avaliar os efeitos de eventos de caudal-base e hydropeaking na fisiologia e comportamento do L.
bocagei num canal experimental equipado com estruturas artificiais tidas como abrigos; (ii)
conceptualizar geometrias alternativas para a mitigação do hydropeaking; (iii) avaliar a atividade do L.
bocagei na presença e ausência de abrigos; (iv) identificar os eventos de hydropeaking com o maior e o
menor efeito de acordo com as respostas quantificadas; (v) encontrar limites críticos e favoráveis de velocidade e de condições hidrodinâmicas de acordo com as repostas quantificadas e, (vi) propor recomendações para a implementação de medidas morfológicas de mitigação do hydropeaking.
Os estudos analisados para a revisão bibliográfica (capítulo 2) mostraram que a variabilidade natural ou antropogénica do escoamento pode alterar a homeostasia do organismo, manifestada por ajustes fisiológicos. Os estudos analisados demonstraram que existe uma relação entre aquela variabilidade e uma reposta provisória do organismo. No entanto, está por determinar se as alterações fisiológicas correspondem a uma reposta provisória ou permanente. No entanto, estes estudos sugerem que o dispêndio energético associado a estas alterações fisiológicas poderá repercutir-se por exemplo, no crescimento, reprodução e sobrevivência das espécies piscícolas.
A segunda parte desta investigação consistiu numa bateria de experiências realizadas durante três campanhas experimentais (capítulos 3 e 4). Usando uma abordagem multidisciplinar, esta componente da investigação foi realizada num canal experimental localizado no Laboratório de Hidráulica e Ambiente do departamento de Engenharia Civil do Instituto Superior Técnico. Para avaliar o efeito do
hydropeaking, testaram-se diversos eventos variando o caudal máximo, a frequência da variação, a
duração do caudal máximo e a duração total do evento. Os caudais testados (7, 20, 40 e 60 l.s-1) foram integrados nos diferentes eventos consoante as hipóteses formuladas. Para simular condições de
vii
amovível, testaram-se diferentes geometrias para avaliar o seu potencial sucesso como refúgio: defletores (dispostos alternadamente, capítulo 3.1; ou dispostos unilateralmente, capítulo 3.2), e estruturas triangulares (pirâmides sólidas ou estruturas em V, capítulo 4). O escoamento e as interações fluído-corpo foram caraterizados através de um velocímetro acústico por efeito de Doppler (ADV) (capítulo 3) e de uma sonda de secção hidrodinâmica dotada de uma linha de sensores de pressão (LLP), procurando representar a linha lateral dos peixes (capítulo 4) respetivamente. Os resultados obtidos através do ADV foram calibrados num modelo numérico tridimensional (FLOW-3D®). Este permitiu simular outras configurações e caraterizar o escoamento consoante o evento e a estrutura testados. Através da LLP mediram-se as diferenças de pressão entre o corpo da sonda e o fluido. Determinaram-se as concentrações de glicose e de lactato como respostas fisiológicas às condições hidráulicas criadas pela combinação evento-estrutura. Para avaliar os padrões de movimento dos peixes, determinaram-se as frequências individuais e em grupo do uso das estruturas, os sprints e os arrastamentos.
Os modelos FLOW-3D® evidenciaram áreas no interior dos defletores com velocidades <0.1 cm.s-1 para todos os caudais testados. No entanto, foram observadas velocidades de 0.72 cm.s-1 e de 0.68 cm.s-1 para o caudal mais elevado na presença de deflectores alternados e unilaterais, respetivamente. As maiores diferenças de pressão foram registadas a jusante das estruturas triangulares (pirâmides sólidas e estruturas em V), onde se verificou inclusive uma maior complexidade das condições hidrodinâmicas. Mesmo que a pressão registada na área interior das estruturas em V tenha sido menor comparativamente à pressão a jusante das pirâmides sólidas, as condições hidrodinâmicas circundantes foram mais complexas.
Os resultados das experiências demonstraram que o comportamento foi diversificado e nem sempre proporcional à severidade do hydropeaking. Por exemplo aquando da simulação de hydropeaking na presença de estruturas, registaram-se ajustes fisiológicos e uma maior frequência de sprints individuais. Por outro lado, o comportamento de grupo foi mais marcado nos eventos-base e em situações de
hydropeaking sem estruturas. Verificaram-se ajustes de glicose em situações de hydropeaking com
defletores, enquanto os aumentos de lactato foram apenas verificados no evento hydropeaking na presença de estruturas em V. Os modelos FLOW-3D® e os contornos de pressão resultantes da LLP evidenciaram que a área interior dos defletores e das estruturas em V garante características hidráulicas (velocidade) e hidrodinâmicas (pressão frontal média, flutuações frontais médias e pressão assimétrica média) favoráveis ao L. bocagei. No entanto, a complexidade do escoamento resultante do
hydropeaking e da presença do abrigo, reduziu a capacidade dos peixes para usar estas estruturas como
refúgio.
Concluiu-se que os diferentes padrões de comportamento resultaram das condições hidráulicas criadas em simultâneo pelo evento e pela presença das estruturas. A abordagem multidisciplinar adotada
viii
que asseguram o repouso do L. bocagei, e estabeleceram-se relações entre as variáveis de pressão e as respostas fisiológicas e os padrões de movimento do L. bocagei. Finalmente foram propostas recomendações para a conceção de medidas morfológicas e operacionais para mitigar os efeitos do
hydropeaking no L. bocagei.
Palavras-chave
ix
Quero deixar o meu profundo agradecimento a todas as pessoas que estiveram comigo durante esta odisseia.
Agradeço à Isabel Boavida, minha orientadora e mentora. A Isabel esteve presente desde que o tema foi idealizado até à escrita da última palavra desta tese. Quero agradecer todo o seu rigor científico, inteligência, entusiasmo, partilha de ideias, e a constante presença durante todo o trabalho experimental. Não posso deixar de agradecer toda a confiança que depositou em mim, mais do que aquela que eu acreditava ter. A sua orientação foi fundamental, e determinou o sucesso deste trabalho. Isabel, OBRIGADA pela tua amizade. Foste o meu farol nos momentos mais difíceis e a minha companhia em experiências que vou guardar para sempre. És uma montanha! Sem ti, este trabalho não teria sido possível.
Agradeço ao Professor António Pinheiro, pela sua orientação e pelo acompanhamento contínuo do meu trabalho. Agradeço a oportunidade que me proporcionou, a motivação que me transmitiu e a confiança que depositou em mim. A constante partilha do seu conhecimento e da sua experiência, o seu rigor científico e a sua exigência foram basilares para o sucesso deste trabalho. Para além de todo o apoio e da sua total disponibilidade, quero agradecer a sua amizade, cuidado e compreensão. A sua voz optimista e calma, e o seu pragmatismo foram fundamentais nos momentos em que o caminho parecia ser difícil.
I am genuinely thankful to P. Eng. Christos Katopodis for envisioning my research topic into the research conducted at the Cooke Lab. Going to Canada, was an once-in-a-lifetime opportunity. I must express my gratitude to Dr. Steven J. Cooke for accepting me as a visiting student at the Cooke Lab, for sharing his incredible ideas and visionary advices. Your scientific contribution and thorough revisions of the research articles were paramount. Thank you for your constant promptness, sympathy and willingness to help. I will always be thankful for all the opportunities you gave me. Dr. Robert Lennox, I am grateful for the time and ideas we shared. Our manuscript reflects that even with the Atlantic Ocean between us, with motivation and effort, these collaborations can be truly rewarding.
À Professora Teresa Ferreira pelo entusiasmo e confiança nos seus doutorandos. A sua paixão pelo FLUVIO é contagiante. Agradeço a sua presença constante, o seu discurso motivador e a inspiração que transmite. O seu contributo científico foi importante para o sucesso deste trabalho.
Um agradecimento muito especial à mestre Vera Almeida pelo valioso contributo que adicionou à investigação. Graças aos resultados das tuas medições através do ADV e do teu modelo numérico foi
x
To the researchers Dr. Jeffrey A. Tuhtan and Dr. Juan Francisco Fuentes-Pérez from the Centre of Biorobotics in Tallinn (Estonia) who brought the lateral line probe to this research. Jeffrey Tuhtan, thank you for triggering my critical thinking and for your valuable contribution to our research article. Juan Francisco, eskerrik asko zure entusiasmo eta kuriositate kutsagarriengatik. Zuri esker, laborategiko lana esperientzia gozagarria izan daiteke. Oso eskertuta nago partekatu ditugun ideiengatik, gure artikuluaren idazketa prozesuan izan duzun pazientziagatik, zure presentziagatik eta, noski, zure diseinu-gaitasunengatik. Mila esker zure laguntasunagatik!
Obrigada Luísa Machado pelos teus conselhos sábios em relação ao tratamento estatístico dos resultados. As longas conversas telefónicas, por Skype, em cafés, e após concertos, foram valiosas para melhor interpretar as respostas dos peixes. Nunca vou esquecer que foste a última pessoa a quem telefonei antes da defesa. Para falar sobre estatística. Obrigada pela tua amizade.
Não posso deixar de agradecer ao mestre Ricardo Branco, do biotério do CIIMAR (o BOGA) pela sua disponibilidade, experiência, simpatia e dedicação. Graças à informação contida nas dezenas de mails que trocámos, conseguimos assegurar a qualidade da água dos tanques e assim garantir o bem-estar dos peixes.
Ao Centro de Investigação CERIS (Civil Engineering Research and Innovation for Sustainability) do Instituto Superior Técnico pelo acolhimento, e também ao CEF (Forest Research Center) do Instituto Superior de Agronomia.
Agradeço à Fundação para a Ciência e Tecnologia, pelo financiamento desta investigação através da bolsa de doutoramento SFRH/BD/52517/2014.
I must acknowledge the support from the European Union’s Horizon 2020. This research has received funding from the European Union’s Horizon 2020 research and innovation programme under grant agreement No 727830.
A todos os funcionários da Secção de Hidráulica, Recursos Hídricos e Ambientais e do IST em geral, pela disponibilidade e simpatia. Um agradecimento muito especial à Dulce Fernandes, por todo o carinho e dedicação que sempre demonstrou. Com a Dulce não há impossíveis! Ao João Caetano, por todo o apoio no trabalho laboratorial e pela sua preocupação. Ao Rui Garcia por garantir que a carrinha para transportar os peixes estava sempre segura. À Joana Pisoeiro, por sempre ter disponibilizado os equipamentos do Laboratório de Ambiente e pela constante simpatia.
xi
companheirismo. Ao José um especial agradecimento pela ajuda nas saídas de campo.
Aos meus colegas e amigos do Instituto Superior Técnico, especialmente ao grupo das pausas para almoços e cafés. Estou-vos eternamente grata por aqueles momentos de debates mais ou menos filosóficos acerca de tudo e de nada. Obrigada Ana Clara, Fátima e Mariana por toda a vossa amizade, carinho e apoio. Este percurso convosco foi muito enriquecedor. Cada uma de vós acompanhou-me de uma forma muito especial e única. Obrigada Ana Margarida pela tua força, otimismo e amizade. Obrigada Ana Quaresma pelo teu sotaque do norte, pelo carinho, conselhos e partilha de conhecimento. Obrigada Pedro Sanches por toda a tua ajuda no laboratório, pela paciência e pelos bolinhos.
A todos os meus colegas do FLUVIO: Ana Calapez, Ana Machado, Filipe Romão, Gonçalo Duarte, María Diaz-Redondo, Rui Rivaes e Rute Vieira. Vocês tornaram este percurso muito mais agradável. Obrigada pela vossa amizade e pela partilha. Filipe, Ana Calapez, Rui e Rute, obrigada pela ajuda no trabalho de campo. Ana Calapez e Ana Machado, obrigada pelo vosso carinho e sorrisos. Filipe, sem ti a gastronomia não tinha piada! Gonçalo, obrigada pelos teus abraços. María, I feel fortunate to have you as a friend and I treasure all the moments we shared.
A todos os meus amigos, em especial à minha “família” de Lisboa, Bela e Sara. Bela, és montanha, sol e colo para mim. Sara, és generosidade. Judite, obrigada por me acompanhares em todas as etapas desta odisseia, por viveres comigo todas as minhas tempestades e bonanças, e por seres quem e como és. Vera, obrigada por estares sempre comigo e pelas tuas palavras sábias nos momentos certos. Francisco, és o meu sorriso!
Aos meus pais e ao meu irmão por todo o carinho e apoio incondicional. Obrigada por serem uma força da natureza e por me mostrarem que havendo amor e fé, nada nos pode demover. Mãe, obrigada por me ensinar que cada dia é uma vitória, a si devo a capacidade de acreditar. Pai, obrigada por me mostrar a força que temos dentro de nós. O pai é um verdadeiro super-homem! Hélder, obrigada pela tua amizade, pelos sorrisos, pelo carinho, por me ouvires e aconselhares, pelo conforto e descanso da mente, por seres meu irmão. Cristina, obrigada por teres chegado a esta família. Vocês são o meu porto de abrigo.
xiii
Resumo i
Abstract iii
Resumo Alargado v
Agradecimentos ix
Table of Contents xiii
List of Figures xvii
List of Tables xxiii
List of Abbreviations xxv
List of Symbols xxvii
1 Introduction 1
1.1 The natural flow regime 3
1.2 Hydropower production global status and trends 5
1.3 The particular case of hydropeaking 6
1.3.1 Characterization of hydropeaking 7
1.3.2 Experimental approaches to study hydropeaking and its impacts 8
1.3.3 Mitigation measures to hydropeaking 8
1.4 Physiological and behavioural responses of fish 10
1.4.1 Fish responses to hydropeaking 13
1.5 Characterization of the hydrodynamic environment 14
1.5.1 Classical characterization 14
1.5.2 Biomimetic characterization 15
1.6 The Iberian barbel 17
1.7 Thesis motivation 18
1.8 Main objectives 19
1.9 Methodological approach 21
1.10 Thesis structure 22
2 Finding cause-effect relationships between flow variability and fish responses 25 2.1 Is there evidence for flow variability as an organism-level stressor in fluvial fish? 27
2.1.1 Abstract 28
2.1.2 Introduction 29
2.1.3 Research approach 31
2.1.4 Findings in flow variability-stress responses 32
xiv
2.1.8 Conclusions 44
2.1.9 Future research directions 45
2.1.10 Acknowledgements 48
2.1.11 References 49
3 Responses of Iberian barbel to simulated hydropeaking: the role of lateral refuges 61 3.1 Do artificial velocity refuges mitigate the physiological and behavioural consequences of
hydropeaking on a freshwater Iberian cyprinid? 63
3.1.1 Abstract 64
3.1.2 Introduction 65
3.1.3 Materials and methods 67
3.1.4 Results 74 3.1.5 Discussion 82 3.1.6 Conclusions 87 3.1.7 Acknowledgements 88 3.1.8 Funding 88 3.1.9 References 89
3.2 The potential of lateral refuges for Iberian barbel under simulated hydropeaking conditions 97 3.2.1 Highlights 98 3.2.2 Abstract 98 3.2.3 Introduction 99 3.2.4 Methods 101 3.2.5 Results 108 3.2.6 Discussion 113
3.2.7 Prospects and applicability 117
3.2.8 Acknowledgements 118
3.2.9 References 119
4 Defining mitigation measures to hydropeaking supported by fluid-body interactions 127 4.1 Fish under pressure: examining behavioural responses of Iberian barbel under simulated
hydropeaking with instream structures 129
4.1.1 Abstract 130 4.1.2 Introduction 131 4.1.3 Methods 134 4.1.4 Results 143 4.1.5 Discussion 150 4.1.6 Conclusions 153
xv
5 General discussion 165
5.1 Research overview and discussion 167
5.2 Research limitations 176
5.3 Practical applicability of the research 177
5.4 Final remarks 178
5.5 Future research 180
6 References 183
xvii
Figure 1.1 The natural flow regime. a) The five components of flow regime – magnitude, frequency duration, timing, rate of change – and, b) the cascading indirect (white arrows) and direct (black arrow) effects on the ecological integrity of the fluvial ecosystem. Adapted from Poff et al. (1997). 4
Figure 1.2 The evolutionary and ecological effects of inter- and intra-annual variability of flow regime.
Adapted from Lytle and Poff (2004). 4
Figure 1.3 Parameters to characterize rapid flow fluctuations. a) Flow ratio: the high flow divided by the low flow; b) Rate of change: change in the water level divided by the time of that change; c) Duration: time between two peaks in the hydrograph, Frequency: how often peaking occurs (between the arrows); Timing, when peak events occur. Adapted from Harby and Noack (2013). 7
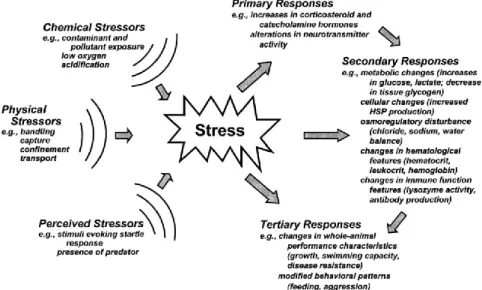
Figure 1.4 Fish responses to stressors. External physical, chemical and other perceived stressors act on the fish organism resulting in physiological changes and other associated effects. These are grouped as primary, secondary and tertiary or whole-animal responses. The primary and secondary responses may directly affect secondary and tertiary responses, respectively (indicated by the responses arrows).
Adapted from Barton (2002). 10
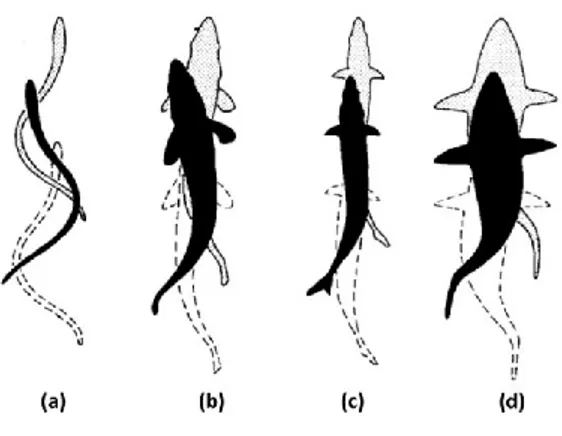
Figure 1.5 Swimming modes and swimming progression illustration associated with body and caudal fin swimming movements from (a) anguilliform, (b) subcarangiform, (c) carangiform and (d) thunniform
mode. Adapted from Sfakiotakis et al. (1999). 12
Figure 1.6 ADV equipment used for the experiments in this research. a) down-looking probe and head details [adapted from Nortek (2004) and Sellar et al. (2015)] and ; b) the ADV equipment being used in
the experiments during this research. 15
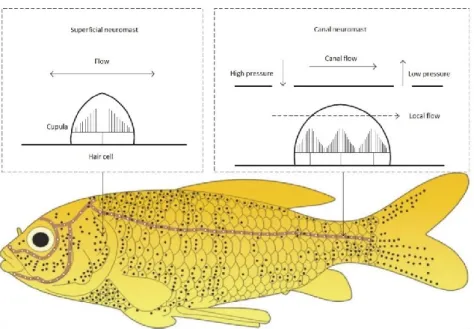
Figure 1.7 Lateral line (light brown line) and neuromasts (black and white dots) of a fish. Black dots and white dots represent approximate distributions of superficial and canal neuromasts respectively.
Adapted from Liu et al. (2016). 16
Figure 1.8 Iberian barbel, Luciobarbus bocagei Steindachner, 1864. Photograph taken during the
experiments conducted at the Laboratory of Hydraulics, IST. 18
Figure 2.1 Temporal trends according to types of flow regime investigated. Manipulated – the research was conducted in laboratory conditions where flow was manipulated either in tanks, flumes or respirometers; Modified – the research was conducted in natural or controlled conditions that simulated altered flow regimes; Natural – the research was conducted in the natural environment under
xviii
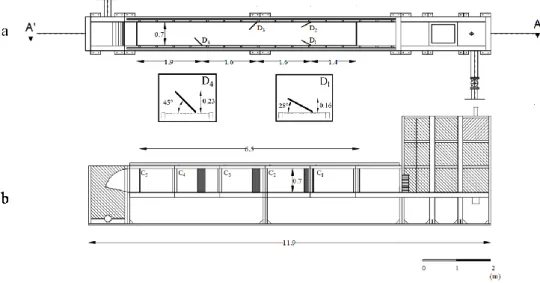
Figure 2.2 Temporal trend according to fish sub-organismal primary (I) and/or secondary (II) responses. From the 58 collected articles (black bars), 31 quantified a sub-organismal response, primary (I) and/or secondary (II), related to a flow feature variability (white bars) and of those, 19 found causality between flow variability (natural or modified) and a sub-organismal response (grey bars). 34 Figure 2.3 Number of assembled articles according to studied response type. (I) Primary response to stress; (II) Secondary response to stress; (III) Tertiary response to stress. 35 Figure 3.1 Top (a) and lateral (b) view of the indoor experimental flume with representation of the artificial refuges (deflectors: D1 to D4) and behaviour observation areas (C1 to C5). D1=D2 and D3=D4 in
terms of opening angle relatively to the flume wall. 68
Figure 3.2 Hydropeaking events tested (SgUR, single up-ramping; SgUDR, single up- and down-ramping; StUR, step up-ramping; RpUDR, repeated up- and down-ramping) with indication of the duration (minutes) for each hydropeaking event (vertical black arrows; (30+20) for SgUR, (30+20+20) for SgUDR and StUR and (30+20+20+20+20) for RpUDR). The horizontal black arrows indicate the discharges tested (Qbase= 7 l.s-1, Q20 = 20 l.s-1 and Q60 = 60 l.s-1). The first 30 minutes (A) correspond to the acclimation period of L. bocagei in the flume. The mean time (± SD) for up- and down-ramping was 28.12 ± 1.86′,
corresponding to an up-ramping rate of 0.55 cm.s-1. 70
Figure 3.3 Velocity magnitudes for the tested discharges: base-flow (7 l.s-1) and peak-flows (20 and 60 l.s-1). C1 to C5 represent the five observation areas (results obtained with FLOW-3D®). 72
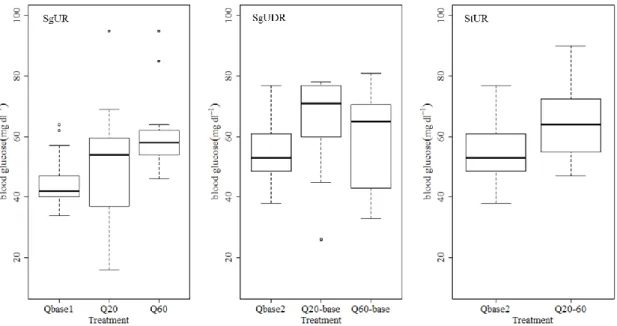
Figure 3.4 Boxplot indicating the variation of blood glucose levels (mg.dl-1) between the treatments of the single up-ramping (SgUR), single up- and down-ramping (SgUDR) and step up-ramping (StUR) events.
76 Figure 3.5 Boxplot indicating the variation of blood glucose levels (mg.dl-1) for the different hydropeaking event durations: 20 (Q20) vs. 40 minutes (Q20-base) for the 20 l.s-1 discharge (a), and 20 (Q60) vs. 40 (Q60-base) vs. 80 minutes (RQ60-base) for the 60 l.s-1 discharge (b). 76
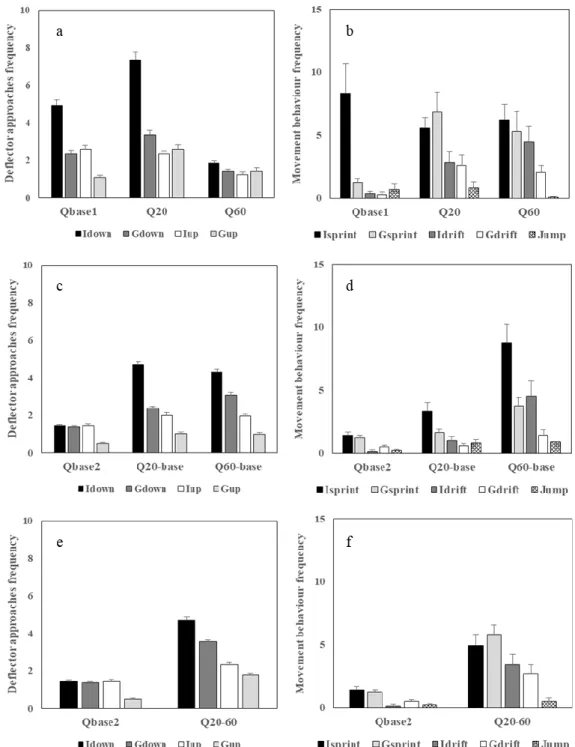
Figure 3.6 Mean (+ SE) frequency of occurrences for each behaviour metric referring to deflector approaches and movement behaviour respectively, for (a) and (b) single up-ramping (SgUR), (c) and (d) single up- and down-ramping (SgUDR), and (e) and (f) step up-ramping (StUR) hydropeaking events. 78 Figure 3.7 Mean frequency of occurrences for each behaviour metric referring to deflector approaches (a) and movement behaviour (b), for each 20 minutes duration flow stimulus (P1 vs. P2) of the 40
xix
Figure 3.8 Mean (+ SE) frequency of occurrences for each behaviour metric referring to deflector approaches for the treatments with 60 l.s-1 peak discharge: Q
60 (SgUR, 20 minutes), Q60-base (SgUDR, 40
minutes) and RQ60-base (RpUDR, 80 minutes). 81
Figure 3.9 Mean frequency of occurrences of each movement behaviour, i.e. sprints (Isprint and Gsprint), drifts (Idrift and Gdrift) and jumps (Jump), for each 20 minutes timespan flow stimulus (P1, P2, P3 and P4), and for the 60 l.s-1 discharge treatments: Q
60 (single up-ramping), Q60-base (single up- and
down-ramping), and RQ60-base (repeated up- and down-ramping). 81
Figure 3.10 Top (a) and lateral (b) view of the indoor experimental flume. The dimensions (m) and
behaviour observation areas (C1 to C5) are represented. 102
Figure 3.11 Representation of the top view of the flume with the refuge (deflector) configuration tested. The position of the deflectors in the flume (m) and a detail of their dimensions (m) are shown. (Di, i = 1
to 3). 103
Figure 3.12 Flow events tested in experiments 1 and 2. In experiment 1 two hydropeaking events were tested in the presence of deflectors: E1HP1D, consisting of a single-step event, and E1HP2D, consisting of a two-steps event, and a base-flow event (E1BF1D). In experiment 2, one hydropeaking event was tested for the presence and absence of deflectors respectively: E2HP3D and E2HP3ND, consisting of a repeated single-step event, and a base-flow event (E2BF2D). (A) Acclimation period. (T1 to T5) correspond to the periods of time of movement behaviour observation. (Blood sampling) indicates the
time when blood was collected for physiological analysis. 104
Figure 3.13 Mean flow velocity fields for 7 and 60 l.s-1 obtainedwith FLOW-3D®. The numerical models were calibrated according to previous velocity field measurements obtained with an ADV for the same flow discharges. C1 to C5 correspond to the observation areas. 108
Figure 3.14 Boxplots with the variation of blood glucose (mg.dl-1) and lactate (mM) levels for L. bocagei subjected to the events from experiments 1 and 2. Experiment 1: E1HP1D, E1HP2D and E1BF1D correspond to the single-step, two-steps and base-flow events tested for the presence of deflectors respectively; Experiment 2: E2HP3D, E2HP3ND and E2BF2D correspond to the repeated single-step event in the presence, absence and the base-flow events respectively. The asterisk corresponds to the
mean value of the physiological indicator of each event. 109
Figure 3.15 Mean frequency (± SEM) of deflector use (Iuse and Guse) and flume swimming activity (Isprint, Gsprint, Idrift and Gdrift) of L. bocagei in experiment 1. E1HP1D, E1HP2D and E1BF1D
xx
Figure 3.16 Mean frequency (± SEM) of deflector use (Iuse and Guse) and flume swimming activity (Isprint, Gsprint, Idrift and Gdrift) of L. bocagei in Experiment 2. E2HP3D and E2HP3ND: repeated single-step event in the presence and absence of deflectors respectively. E2BF2D: base-flow event in the presence of deflectors. T1 to T5: periods of time of observation of movement behaviour. 112 Figure 4.1 Summary of the experimental setup. A) Top view of the flume and test configurations (R0, R1 and R2). B) Plan of the setup with dimensions, grid of hydrodynamic measurements, and observation zones (C1 to C5). C) Depth and discharge of the studied hydrodynamic events. 137
Figure 4.2 Classification of the behaviour metrics. (A and B) - Individual (Iref) and group (Gref) structure use; (C and D) – Individual (Imiddle) and group (Gmiddle) passage by the structures using longest distance between the structure and the flume wall; (E and F) – Individual (Iwall) and group (Gwall) passage by the structures using the shortest distance between the wall and the structure. (G and H) Individual (Idrift) and group (Gdrift) drifts. (I and J) Individual (Isprint) and group (Gsprint) sprints. Plus (+) and minus (-) signs represent the swimming direction of L. bocagei, as positive and negative rheotaxis
respectively. These metrics were used for all configurations. 140
Figure 4.3 Lateral line probe (LLP). NACA025 body shape, showing the locations of the differential
pressure sensors (1-6), and the absolute pressure sensor (7). 141
Figure 4.4 Boxplots with the variation of (A) blood glucose (mg.dl-1) and (B) lactate (mM) levels for L. bocagei. R1BF and R2BF - Base flow event in the presence of solid triangular pyramids and v-shaped
structures respectively; R0HP, R1HP and R2HP – Hydropeaking event in the absence of structures, presence of solid triangular pyramids and presence of v-shaped structures respectively. The letters correspond to the post-hoc test results. The circles correspond to the mean value of the physiological
response for each treatment. 144
Figure 4.5 Correspondence Analysis (CA) biplots for the instream structure use (A) and swimming activity in the flume (B). The biplots illustrate the spatial distribution of behaviour according to each flow event. The axes labels indicate the proportion (%) that explains the spatial distribution of the events. R1BF and R2BF - Base flow event in the presence of solid triangular pyramids and v-shaped structures respectively; R0HP, R1HP and R2HP – Hydropeaking event in the absence of structures, presence of solid triangular pyramids and presence of v-shaped structures respectively. 144 Figure 4.6 Mean frequency (n) of each behaviour metric for each event. A) Structure use (Iref and Gref), path chosen to cross the structures (Imiddle, Gmiddle, Iwall, Gwall). B) Flume swimming activity (Isprint, Gsprint, Idrift and Gdrift). R1BF and R2BF - Base flow event in the presence of solid triangular pyramids
xxi
Figure 4.7 Distribution of mean front pressure (p12) for all configurations and both discharges scenarios considered (7 and 60 l.s-1). The reader is referred to Appendix (Supplement 2) to look at the contour
representation of this figure. 147
Figure 4.8 Distribution of mean front fluctuations (p'12) for all configurations and both discharges considered (7 and 60 l.s-1). The reader is referred to Appendix (Supplement 3) to look at the contour
representation of this figure. 148
Figure 4.9 Distribution of mean pressure asymmetry (p1 6 ) for all configurations and both discharges scenarios considered (7 and 60 l.s-1). The reader is referred to Appendix (Supplement 4) to look at the
xxiii
Table 2.1 Fish responses to stress analysed in this review (adapted from Barton 2002), designated sub-categories and examples of studied responses found in the collected literature. 32 Table 2.2 Studies that analysed a specific flow feature and quantified a stress response. Flow features were separated according to natural or modified flow regime. Studies performed under controlled conditions simulated natural and/or modified flows. Flow features and stress indicator thresholds are indicated. (I), (II), (III) - Primary, Secondary and Tertiary stress-axis responses, respectively. (s.d.) Standard deviation; (Hct) Hematocrit; (SMR) Standard metabolic rate; (MEL) Metabolic Energy Loss; (GSH) Glutathione; (SOD) superoxide dismutase;(HSI) Hepatosomatic index; (TBF) Tail beat frequency. 43 Table 3.1 Description of the tested hydropeaking events. The treatments changed according to the tested discharges: base-flow (Qbase= 7 l.s-1) and peak-flow (Q20 =20 l.s-1 and Q60 = 60 l.s-1), and according to the sequences of 20 minutes discharge stimulus and total event duration. Before each hydropeaking event there was an acclimation period where L. bocagei were subjected to a 7 l.s-1 discharge for 30
minutes 70
Table 3.2 ADV results for longitudinal velocity and mean water depth for the tested discharges of 7, 20 and 60 l.s-1, at 5 cm depth. The upstream and downstream velocities were collected in the downstream area of C1 and the upstream area of C5, respectively, where the ADV was fixed. The velocity magnitude is defined as , where corresponds to the longitudinal (x-axis), the transverse
(y-axis) and the vertical (z-(y-axis) velocity directions. 75
Table 3.3 Single up-ramping (SgUR) results for the pairwise comparisons between peak (Q20 = 20 l.s-1 and Q60 = 60 l.s-1) and base (Qbase1 = 7 l.s-1) flow treatments, according to deflector approaches and flume movement behaviour, using the Kruskal-Wallis test with a Nemenyi post-hoc test for pairwise contrasts.
Significant results (α= 0.05) are indicated in bold. 79
Table 3.4 Single up- and down-ramping (SgUDR) and step up-ramping (StUR) results for the pairwise comparisons between peak (Q20-base, Q60-base and Q20-60) and base (Qbase2) flow treatments for each behaviour according to deflector approaches and movement behaviour, using the Kruskal-Wallis test with a Nemenyi post-hoc test for pairwise contrasts. Significant results (α= 0.05) are indicated in bold. 79 Table 3.5 Comparisons between total hydropeaking event duration for 20 and 60 l.s-1 respectively. The comparisons were performed to test for differences between treatments for each deflector approach and movement behaviour metric, using the Kruskal-Wallis test with a Nemenyi post-hoc test for
xxiv
Table 3.6 Flow events tested. The events changed according to: the tested discharges (base-flow, 7 l.s-1; peak-flow, 40 l.s-1 and 60 l.s-1), the sequences of discharges, peak-type event, peak frequency, presence of a base-flow, and deflector presence or absence. Before each hydropeaking event there was an acclimation period where L. bocagei were subjected to a 7 l.s-1 discharge for 30 minutes. 104
Table 4.1 Pressure-based variables form LLP measurements used in this study. Definition of mean pressure and mean pressure fluctuations are included to clarify the mathematical definition of the variables used for this study. n: number of data points in a measurement; i: index of the sensor. 142
Table 4.2 Summary of the physiological and behavioural responses of L. bocagei according for each event tested. Only the more pronounced fish responses with statistically significant differences are shown, demonstrating the unique fish response patterns according to each hydrodynamic event. 146 Table 4.3 Minimum (Pa) and mean ± SD (Pa) LLP derived pressure variables. The minimum pressure values (Pa) for mean front pressure (p12), mean front pressure fluctuations (p'12) and mean pressure asymmetry (p1 6 ) refer to the results observed in the three rectangles measured behind the structure, Mean ± SD (Pa) refer to the pressure values observed in the flume (excluding structure area) for events
xxv
3D Three-dimensional
A Acclimation
ADV Acoustic Doppler Velocimetry ANOVA Analysis of Variance
BF Base-flow event
C Compartment
CA Correspondence Analysis
CEN European Committee for Standardization (Comité Européen de Normalisation) CEF Forest Research Center
CERIS Civil Engineering for Research and Innovation for Sustainability
CN Canal Neuromast
D Deflector
E Experiment
EMG Electromyogram
FCT Portuguese Foundation for Science and Technology (Fundação para a Ciência e para a Tecnologia)
G Group
HP Hydropeaking
HPI Hypothalamo-pituitary-interrenal
I Individual
ICNF Institute for Nature Conservation and Forests (Instituto da Conservação da Natureza e das Florestas)
INAG National Water Institute (Instituto da Água) IST Instituto Superior Técnico
LLP Lateral line probe
xxvi ODBA Overall dynamic body acceleration
P Period
PMCMR Pairwise Multiple Comparisons of Mean Rank Sums PVC Polyvinyl chloride
R0, R1, R2 Structures (refuges)
RpUDR Repeated up- and down-ramping
SD Standard deviation
SEM Standard error of the mean SgUDR Single up- and down-ramping SgUR Single up-ramping
SN Superficial Neuromast
StUR Step up-ramping
T Time
TL Total length
xxvii
i pressure sensor number, cross-wall number or scenario number
j position number in a data array or prim number
l position of a pair of sensors
m total number of sensors
n total number of data in an array
i
p mean pressure in sensor i
'i
p mean fluctuations in sensor i (Pa) 12
p mean front pressure (Pa)
1 6
p mean pressure (Pa)
12
'
p mean front fluctuations (Pa)
1 6
'
p mean fluctuations (Pa)
p probability value (also used P depending on the journal criteria)
, , longitudinal, transversal and vertical instantaneous velocity components x, y, z longitudinal, transversal and perpendicular to the flume bottom coordinates Q discharge or flow rate (m3/s)
W Wilcoxon rank-sum test
α significance level
p12 mean front pressure asymmetry
p1 6 mean pressure asymmetry
p'12 mean front fluctuations asymmetry
p'1 6 mean fluctuations asymmetry
1
1
Introduction
“There is a mystery about rivers that draws us to them, for they rise from hidden places and travel by routes that are not always tomorrow where they might be today. “
3
1.1 The natural flow regime
The physical and biological processes that occur at each spatial component of the river system (Frissell et al., 1986) and between its dimensions (Ward, 1989) affect the whole river network. This hierarchical organization of river ecosystems strengthened the ecological relevance of this research because the impact of rapid flow changes in lower levels of spatial and ecological organization, would likely scale up to higher levels of the river network.
All events of a fish life-cycle occur in the riverbed. As stream dwellers, fluvial fish depend on the physical and biological processes that occur in the riverbed to successfully complete diel activities (foraging, escaping predators, and finding refuges) and life-cycle events (reproductive migrations, spawning, growth, and recruitment). During these diel and life-cycle events there are inherent movement behaviour changes that occur along the river network and generate distinct fish assemblages (Allan and Castillo, 2007; Poff et al., 1997). Flow plays a determinant role for the success of diel activities, its natural variability is a cue for life-cycle events, and its long-term temporal character determined evolutionary traits (Bunn and Arthington, 2002; Lytle and Poff, 2004). Poff et al. (1997) discussed, for the first time, the critical role of natural flow regime to sustain the ecological integrity of the river ecosystem. The natural flow regime framework postulates that its temporal variation shapes the mosaic of the physical habitat and regulates the structure and function of riparian and aquatic communities (Bunn and Arthington, 2002; Poff et al., 1997). The primary components of flow regime are: magnitude (or flow ratio), frequency, duration, timing and rate of change (Figure 1.1). These act at different spatial and temporal scales, regulating short- and long-term river ecosystem processes (Freeman et al., 2001; Gasith and Resh, 1999; Lytle and Poff, 2004).
4
Figure 1.1 The natural flow regime. a) The five components of flow regime – magnitude, frequency duration, timing, rate of change – and, b) the cascading indirect (white arrows) and direct (black arrow) effects on the ecological integrity of the fluvial ecosystem. Adapted from Poff et al. (1997).
Natural flow disturbances are intrinsic to healthy river ecosystems (Lytle and Poff, 2004). Floods and droughts are integral for the structure of freshwater communities acting across a range of spatial and temporal scales. As a consequence, fish species have evolved adaptive traits enabling them to survive, exploit and depend on these disturbances (Lytle and Poff, 2004). The natural flow regime has an intrinsic predictability. Its natural inter-annual variability has exerted strong selection pressure at the evolutionary scale (Figure 1.2). Thus, it has defined specific traits in fish species related with biology (e.g. age at reproduction; Lytle and Poff, 2004; Resh et al., 1988), behaviour (e.g. timing of spawning migration), physiology (e.g. tolerance for thermal regime) and morphology (e.g. body shape) (Enders et al., 2009). On the other hand, the intra-annual flow variability exerts low selection pressure, and forces aquatic species to adapt, acting at the ecological scale (Lytle and Poff, 2004; Resh et al., 1988) (Figure 1.2).
Figure 1.2 The evolutionary and ecological effects of inter- and intra-annual variability of flow regime. Adapted from Lytle and Poff (2004).
The selection strength of flow variability is particularly prominent in the river ecosystems of the Iberian Peninsula. The majority of these ecosystems are characterized by a Mediterranean climate (Ferreira et
5
al., 2007b; Gasith and Resh, 1999). This results in a strong intra-annual variability in the flow regime, with high flow periods during winter and limited water availability during summer (Gasith and Resh, 1999). Thus, the ichthyofauna of these highly variable systems has evolved evolutionary and ecological traits (e.g. rapid growth rates, high fecundity, or early sexual maturity and spawning) enabling them to adapt to this strong flow variability (Ferreira et al., 2007b). However, the continued modifications of the natural flow variability of Mediterranean rivers have disrupted the river continuum as Vannote et al. (1980) described it. In a short-term fish species are forced to adapt, however in a long-term the effects of flow modifications may become cumulative and result in biodiversity loss (Allan and Castillo, 2007). This natural flow regime framework represented a major advance for the scientific community and for both freshwater managers and users because it emphasized the major role of flow regime for freshwater biota. By understanding the fundamental principles of natural flow variability, it would be possible to predict the ecological consequences of altering any flow component, and act towards a more naturalized river flow (Arthington et al., 2006; Poff et al., 2003). However, it is challenging to translate this knowledge into management strategies that not only comply with human demands but assure the resilience of the freshwater ecosystem (Arthington et al., 2006; Naiman et al., 2002)
1.2 Hydropower production global status and trends
From the beginning of the 20th century onwards, hydropower production has expanded as an important source of electricity. Hydropower was the largest source of renewable electricity generation in 2017, contributing to 16.4% (out of 24.5%) for the global production of renewable energy (IHA, 2018). Due to the increasing demand for an energy source that responds to societal needs for cost-effective electricity (Yüksel, 2009), hydropower is now the fastest growing end-use of energy (IHA, 2018). In addition, hydropower with reservoirs is the only renewable energy with storage possibilities (Harby and Noack, 2013; IHA, 2018). Thus, hydropower production will continue to expand (IHA, 2018; Zarfl et al., 2015). Although the positive aspects of hydroelectricity are emphasized in the International Hydropower Association report (IHA, 2018), they have to be interpreted with caution. The environmental impacts of the artificial and rapid flow fluctuations in downstream rivers (Harby and Noack, 2013) and the consequent habitat degradation and biodiversity loss (Nilsson et al., 2005) were not analysed for this report.6
1.3 The particular case of hydropeaking
The effects of rapid flow fluctuations downstream of hydropower plants were firstly reviewed by Cushman (1985). In this review, the first evidence of the impacts of rapid and artificial flow changes on fish dates back to 1955, where the population of stocked rainbow trout was assessed in the tail-water below a hydroelectric dam (Parsons, 1955). Cushman (1985) firstly refers to “hydro-electric peaking” as the operational manoeuvres that occur in the hydropower plant in response to the electricity demand to control the large and rapid (within minutes) changes in the discharge by powering-on or -off the hydro-turbines, resulting in rapid flow changes in tailwaters (Cushman, 1985). Less than a decade after, Moog (1993) alarmed for the necessity to quantify the ecological impacts of peak hydropower and to propose management solutions to minimize them. By that time, the relevance that was given to the impact of the short-term flow fluctuations to river ecosystems was alarming and already considered as “one of the most serious disturbances of regulated riverine ecosystems” (Moog, 1993). If by that time the concern for this problematic was emerging, today it is an urgent matter. Presently, these rapid and artificial flow fluctuations caused by sub-daily to weekly energy demand are generally referred to as “hydropeaking”.
A recent review study addressed the global trends of hydropeaking in riverine plants from 1994 to 2016 (Bejarano et al., 2018). From the 165 articles that were analysed by using the keyword “hydropeaking” as a search string, more than half were published between 2012 and 2016 (Bejarano et al., 2018). This illustrates the recent growing importance of this topic and the awareness of the scientific community to study it. The impacts of hydropeaking have been mostly studied for freshwater fauna, where fish and macroinvertebrates’ studies contributed to 43 and 14% respectively (Bejarano et al., 2018). From 2010 onwards, other topics related with river hydrology, hydraulics and management solutions have been introduced (Bejarano et al., 2018). This trend is probably supported by the recent advances in computing power and landscape information (Hauer et al., 2017). These are decisive to accurately model the hydrodynamics of rivers affected by hydropeaking, and to project future scenarios accordingly (e.g. Hauer et al., 2014, 2013).
In free-flowing rivers the fluctuations in daily flows change according to: precipitation, evapotranspiration, infiltrations or snowmelt, and catchment-scale characteristics (e.g. drainage area, land use or slope) (Lundquist et al., 2002). These variations may be small in comparison to the variability at yearly time-scales. However, they affect the physical and biological processes of freshwater ecosystems (Biggs et al., 2005). Rivers affected by hydropeaking incur comparably higher dramatic flow changes in both daily and yearly timescales (Bejarano et al., 2018; Bunt et al., 1999; Zimmerman et al., 2010). The continued long-term hydropower plant operations result in strong morphological, hydraulic and water quality alterations including: bank and soil erosion and continuous shifts in the sediment transport processes (Greimel et al., 2018; Hauer et al., 2017, 2013; Moog, 1993; Schmutz et al., 2015),
7
changes in water level, flow velocity, water turbulence and bed shear stress (Shen and Diplas, 2010), and in water temperature (Bakken et al., 2016; Zolezzi et al., 2011), dissolved gas concentrations (Bejarano et al., 2018; Calles et al., 2007; Pulg et al., 2016) or turbidity (Bice et al., 2013; Bunt et al., 1999).
1.3.1 Characterization of hydropeaking
The discharge fluctuations occurring downstream the hydropower plant in response to the electricity demand create distinct phases of hydropeaking: 1) low base discharge, corresponding to no electricity production; 2) increasing discharge, or up-ramping, where electricity production rapidly increases; 3) continuous high peak discharge, where the demand for energy peaks; 4) decreasing discharge, or down-ramping, corresponding to the shutdown of the turbines (Bruder et al., 2016). These operations generate irregular changes in the components of flow regime, specifically: the flow ratio, rate of change, frequency, duration, and timing (Figure 1.3).
Figure 1.3 Parameters to characterize rapid flow fluctuations. a) Flow ratio: the high flow divided by the low flow; b) Rate of change: change in the water level divided by the time of that change; c) Duration: time between two peaks in the hydrograph, Frequency: how often peaking occurs (between the arrows); Timing, when peak events occur. Adapted from Harby and Noack (2013).
The characterization of these components is the basis to quantify the impacts of hydropeaking and to recommend guidelines to mitigate its consequences (Bejarano et al., 2018; Bruder et al., 2016; Harby and Noack, 2013). In hydropeaking conditions, it is frequent that one or more of these flow regime components exceed the ranges of the natural flow regime, creating the most severe impacts (Harby and Noack, 2013).
Hydropeaking results in highly variable sub-daily discharge fluctuations, with highly frequent peaks during the day. The common statistics used to define the extent of hydrologic alteration in relation to the natural flow regime, are based on daily-averaged flow records (e.g. Richter et al. 1996). This methodology fails to capture the variability that characterizes short-term flow fluctuations. Thus, to understand hydropeaking it is necessary to characterize the changes in magnitude, frequency, rate of change, duration and timing in a sub-daily scale (Meile et al., 2011). In recent years, sub-daily flow metrics have been proposed to characterize hydropeaking and to quantify its impacts, with temporal
8
scales ranging from 15 (Sauterleute and Charmasson, 2014), 30 (Zolezzi et al., 2011) , and 60 minutes (Alonso et al., 2017; Bevelhimer et al., 2015; Carolli et al., 2015; Meile et al., 2011).
1.3.2 Experimental approaches to study hydropeaking and its impacts
The study of hydropeaking and its impacts depends on whether the objective is to characterize the daily and sub-daily rapid flow fluctuations, to quantify the impacts of hydropeaking in the physical and biological processes of the affected river ecosystem, or to conceptualize mitigation measures. The research approaches can be generally grouped in: in situ, experimental flume and numerical modelling studies. These approaches can be used solely or combined.
In situ studies are usually selected to quantify the effects of hydropeaking on fish assemblages (Vehanen
et al., 2005), and on specific life-cycle events (e.g. alteration of migratory cues, survival, rearing or growth). In in situ studies, the manipulation of flow is rarely possible (but see Krimmer et al., 2011) because it is impractical and costly for hydropower plant managers. One of the most reported disadvantages of in situ studies is the overlapping effects of other physical and biological variables that are difficult to isolate (Harby and Noack, 2013). In experimental flume studies (indoor or outdoor) it is possible to examine smaller scale behaviour (e.g. substrate preferences or social interactions). The main advantage of experimental flume studies is the possibility to control external variables and flow changes. However, it is commonly difficult to simulate the rapid flow fluctuations in the same order of magnitude and rate of change as in some regulated rivers due to limitations that are inherent to the facility (Harby and Noack, 2013). In addition, it is often very difficult to reproduce natural conditions of substrate, hyporheic flow, and sediment dynamics. Numerical modelling studies have been increasingly used to characterize hydropeaking and to propose morphological mitigation alternatives (Boavida et al., 2015; Hauer et al., 2017, 2014). These present valid tools to predict potential scenarios, or to develop conceptual frameworks to serve as grounds for hydropeaking studies (Bruder et al., 2016; Young et al., 2011; Zimmerman et al., 2010).
With in situ experiments the highest realism is achieved, in experimental flumes it is possible to control the factors under examination and to replicate the same flow conditions (Woodward et al., 2010), and with numerical models it is possible to project hypothetical flow conditions (Almeida, 2014; Hauer et al., 2014; Ribi et al., 2014). Ideally, the hydropeaking problematic should be addressed using a combination of the available approaches to strengthen the findings and to propose management recommendations (Harby and Noack, 2013).
1.3.3 Mitigation measures to hydropeaking
The mitigation measures to hydropeaking can be categorized in three types: operational, morphological and structural (Person, 2013; Person et al., 2014). Operational measures aim at adjusting
9
the flow regime downstream the power plant by adapting the operational scheme to be more suitable for biota; morphological measures aim at improving the river morphology towards a more naturalized state by the utilization of river engineering techniques; and structural measures aim at smoothing the impact of the magnitude and rate of change of the discharges during hydropeaking by the construction of hydraulic structures (Bruder et al., 2016; Harby and Noack, 2013; Person, 2013; Person et al., 2014).
Operational measures involve the adaptation of the production scheme to reduce the impacts for downstream biota. The most frequently and relevant suggested changes in the operation include: (i) smoothing the extreme changes in magnitude, rate of change, frequency and timing of peak (Bruder et al., 2016; Clarke et al., 2008); (ii) create a step-wise discharge increase (i.e. a pre-surge) (Bruder et al., 2016); (iii) attenuating the ramping rate because it should mimic a rapid natural flow increase (Auer et al., 2017; Clarke et al., 2008), and (iv) reducing or increasing the minimum flows during critical spawning, rearing and recruitment (Casas-Mulet et al., 2014; Clarke et al., 2008; Pragana et al., 2017). Although operational measures seem an adequate solution, it is challenging to find a trade-off between the economic outcome for the hydropower industry and the ecological benefits (Jager and Smith, 2008; Pragana et al., 2017), in addition to the technical difficulty associated with powering-on and –off the hydro-turbines (Harby and Noack, 2013).
The morphological measures involve the addition of artificial or natural structures in the river bed, or the modification of the river channel and floodplain to reduce the negative impacts of hydropeaking (Harby and Noack, 2013; Person, 2013). Enhancing river morphology adds heterogeneity which ensures refuge availability. However, it also interacts with the changes in the hydraulic conditions associated with hydropeaking (Casas-Mulet et al., 2015a; Vanzo et al., 2016). Schwartz and Herricks (2005), encourage the use of the whole floodplain to perform riverine interventions to effectively promote downstream habitat enhancement for freshwater biota. These may include the re-introduction of side-channels (Hauer et al., 2014; Schwartz and Herricks, 2005) that also assure the lateral connectivity during low flow. Experimental flume-based research has proposed morphological measures to mitigate hydropeaking consequences. For example, lateral refuges (Ribi et al., 2014), substrate heterogeneity (Chun et al., 2011), and alternative cover structures (velocity refuge, visual isolation and overhead cover) (Vehanen et al., 2000) have been studied as refuge alternatives for salmonids during hydropeaking events. With the increasing availability of discharge time-series data and robust hydraulic modelling software, it is also possible to simulate the river hydromorphology and its hydrodynamic conditions (Vanzo et al., 2016), and to create hypothetical scenarios based on fish preferences (Boavida et al., 2017, 2015). By studying these hypothetical scenarios it was possible, for example, to identify beneficial and inadequate morphological measures regarding the geometry of lateral refuges (Almeida et al., 2014) and the form of channel bars on the stranding risk of fish during hydropeaking (Hauer et al., 2014).
10
Structural measures may include the construction of retention volume structures (e.g. basins or caverns) that temporarily store the discharge peak, attenuating its release in the downstream river system (Bruder et al., 2016; Harby and Noack, 2013). The construction of these structures requires land or river corridor allocations, and demands a thorough evaluation of the economic-ecological benefits. By allowing that a pre-surge state is reached before the maximum discharge is released, these structures assure a gradual adaptation of the downstream biota (Meile et al., 2011; Parasiewicz et al., 1998; Person et al., 2014).
1.4 Physiological and behavioural responses of fish
There is a vast body of research on how fish respond to flow variability (Poff and Zimmerman, 2010). Most of it focuses on ecological responses, such as changes in fish assemblages, which are commonly related with alterations in movement patterns (Murchie et al., 2008). To quantify the effects of simulated hydropeaking in L. bocagei and to evaluate the potential of structures as velocity refuges, it was necessary to level down to organism-level responses. The rationale behind this choice was related with the ecological relevance of identifying a mechanistic link between a flow disturbance and the occurrence of a stress response. A stress response is considered an adaptive mechanism that enables fish to cope with any real or perceived stressor with the objective to maintain the homeostatic state (Barton, 2002). In this sense, a stressor can be any external disturbance that threatens the homeostatic state and triggers a complex suite of adaptive responses to regain it, which is the stress response per se (Chrousos, 1998; Wendelaar Bonga, 1997) (Figure 1.4).
Figure 1.4 Fish responses to stressors. External physical, chemical and other perceived stressors act on the fish organism resulting in physiological changes and other associated effects. These are grouped as primary, secondary and tertiary or whole-animal responses. The primary and secondary responses may directly affect secondary and tertiary responses, respectively (indicated by the responses arrows). Adapted from Barton (2002).