My risk assessment estimates a medium risk for Verizon. High barriers to new entrants, market is an oligopoly with products homogeneus
Low Medium High
Table 1: Risk Assessment Source: Author
2015 2016 2017 2018
Service 34% 33% 32% 32%
Wireless equipment revenues 37% 35% 34% 33%
Other 81% 72% 77% 78%
Total Wireless Revenues 36% 35% 34% 34%
Consumer Markets 33% 34% 34% 47%
Enterprise Solutions 16% 17% 17% 23%
Partner Solutions 8% 9% 9% 12%
Business Markets 9% 9% 10% 13%
Other 6% 0% 0% 0%
Total Wireline Revenues 19% 19% 19% 18% Wireless and Wireline Revenues 30% 29% 28% 28%
Table 2: Market Share Source: Bloomberg 1. RESEARCH SNAPSHOT
Buy is my recommendation for Verizon Communications Inc. (Vz), using a discount cash flow method get a price target of USD 67,38 at the end of 2019, representing an upside potential of 19,87% comparing with the last closed price of 2018, USD 56,22.
The wireless segment is the principal driver of Verizon and telecom market in United States (US), at the end of 2018 Verizon had 34,05% of wireless market share in US, making Verizon the leader in the market. For the other side, Verizon has 17,86% of Wireline market share, therefore there is a significant difference between both market shares, the Wireless segment revenues at the end of 2018 represent 162% of Wireline revenues.
Wireless segment is divided in Service, Wireless equipment and Others, Service revenues are the main source of revenue for the segment, but in the future and despite that service will continue to be the main key, it’s expected a slow decrease on Service and on Other revenues, for Wireless equipment it is expected a CAGR of 7,11% between 2018 and 2022F.
The telecom industry is prepared to face the 5th Generation (5G), this technology it is based on the actual 4G Long Term Evolution (LTE), but with much more speed and data quality, it will be the key driver for the implementation of Internet of Things (IoT), that will allow having more electronic devices connected to internet, from household appliances to other devices.
Verizon strategy is to become the first company in the US with wireless and wireline 5G connectivity, increase his revenues from Wireless equipment, as it is expected that Wireless equipment revenues in US will grow a CAGR of 11% from 2018 to 2022F, mainly due IoT, Verizon will invest to give fiber-optic a multi-use so can support both wireless and wireline services.
Leonardo Marques ([email protected])
Master in Finance
VERIZON
BUY
Medium risk
October 2019
United States
2019YE Price Target of USD 67,38; Upside potential of 19,87%; Medium Risk; Recommendation BUY2 Table 3: Vz Relevant M&A
Source: Author, Company Website 2. BUSINESS DESCRIPTION
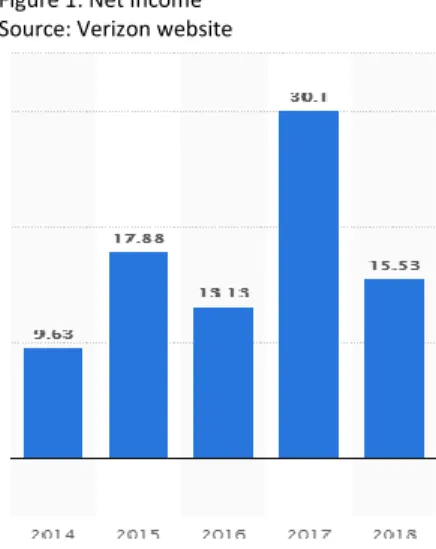
Verizon Communications Inc. (VZ), is an American Telecom company, founded on June 30, 2000 resulted by the Merge between Bell Atlantic Corp. and GTE Corp., is today one of the largest Telecom companies in the World, with big presence in United States, where Verizon has approximately one third of Telecom market share, its headquarter is located in New York City and is listed in S&P 500, made part of New York Stock Exchange, since his foundation, at the end of 2018 Verizon had around 144 500 employees and Net Income of 16 039 Million Dollars.
Time chronology
Bell Telephone, mother company of Verizon was created on 1877 by Alexander Bell in Boston with the propose of holding potential valuable patents, principally related with phones, with this at 1885 AT&T is incorporated as long line division of American Bell with the goal of build distance telephone network and then at 1899 AT&T become the face of Bell Systems on restructure that was made. These companies start developing their services during the twentieth century, In June 1934 was created the Federal Communication Commission (FCC), as the communication regulator establishing rules for the communication market. With this in November 1974 US Department of Justice filed an antitrust suit against AT&T alleging anticompetitive practices, AT&T was accused of using monopoly profits from Western Electric subsidiary to cross-subsidize the costs of its network. The result of this case in January of 1984 was divestiture, where AT&T relinquishes the control of local phone companies. Bell Atlantic and NINEX, two of these companies, had become independent and start merging services until the end of the twentieth century, resulting in a final merge of 23 Billion USD in February of 1997, name Bell Atlantic Corp.
In April 2000 Verizon Wireless was founded when Vodafone Air Touch and Bell Atlantic Corp. merger their Wireless services creating one the largest Wireless provider company in the US with more than 24 million customers. Later, at June 2000 Bell Atlantic Corp. and GTE Corp. get a full merge to create Verizon Communications, and began trading on New York Stock Exchange.
Verizon Communications, in February 2014 acquire Vodafone part, 45% Indirect Interests in Verizon Wireless for 130 Billion USD and get the full control of Verizon Wireless.
Verizon Business Division
At the end of 2018, Verizon's new CEO, Hans Vestberg, decided to reorganize his business division to create three main business segments. Target of this reorganization is to organize company division’s by type of consumer served instead of the type of service provided, this segmentation was defined by Vestberg with “logical and natural step in order to leverage all the best assets we have in Verizon, which is the network, the distribution, and our brand”.
Verizon Home/Consumer, led by Ronan Dunne, includes the consumer segment of company’s wireless and wireline business, main target for this segment is US families requiring home services.
Company
Year
Amount paid
(Million USD)
MCI 2006 779
Cybertrust 2007 Not disclosed Rural Cellular 2008 2 660 Alltel 2009 22 200 Terremark 2011 1 400 Spectrum Licences 2011 3 600 Hughes Telematics 2012 612
Intel Media 2014 Not disclosed
AOL 2015 4 400
XO’s fiber optic 2016 1 800
Volicon 2016 Not disclosed
Telogics 2016 930
Fleetmatics 2016 2 400
Yahoo 2017 4 480
Figure 1: Net Income Source: Verizon website
Figure 2: Significant balance sheet strength Source: Verizon annual report 2018
3 Figure 3: Vz Revenues by segment
Source: Verizon annual report 2018 Verizon Media Group, led by Guru Gowrappan, include company business of
Oath, mother company of AOL acquired in 2015, is specialized in digital content advertising, and Yahoo, full acquired in 2017 is a web portal with diversified services, like email address service, search engine, news service, share of videos and advertising. The target for this segment is anyone that is looking for media, news, entertainment, gaming or commerce content.
Verizon Business, led by Tami Erwin, focuses on providing connectivity and telecom services, like Verizon Telematics, including wireless and wireline for businesses and enterprises for small, medium and large organizations, it´s also responsible for governmental contracts.
As Reported
Verizon reports his financial information on annual report focused on three segments, Wireless, and Wireline as core business and Corporate and Other. Wireless segment provides wireless communications equipment and services including data services to consumer, business and government customers across the US on postpaid basis where customer is billed one month in advance, and on prepaid basis with customer paying in advance. Wireline provides communication products and enhanced services, including video and data, networking solutions, security and managed network services, local and distance voice services, these products are provided to consumers in U.S as well as to carriers, businesses, and government customers mainly in US. Corporate and Other, this segment includes Media and telematics businesses, under Oath brand responsible to manage Yahoo and AOL assets acquired, other businesses, investments, corporate expenses, pension, and other employee benefits, interest and financial expenses. Company Strategies
Customer, today customers are savvier and expect more from companies than ever before, they want personalized and instant experiences, this is having a great impact on the kind of products and services Verizon needs to deliver, for this, Verizon managers are putting a much greater focus on understanding customer needs. Verizon is involving their customers on the development process of their products listening to all feedback received and make quick improvements based on client general feedback.
Financials and Employees, from a finance perspective, Verizon expect to increase revenue based on the new business division model presented, which will also impact the way Verizon is organized, and a new reorganization is already in place to satisfy this new model.
5G, Verizon wants to be the first company in the US market with both fixed and mobile versions of 5G technology, in 2018 Verizon already has 4 regions covered with broadband service.
Society, Verizon is very committed to society, as will be further explained in management corporate topic, Verizon assumes strong position to provide better future for our next generations with environmental, social diversity and inclusion measures present on Verizon today’s priorities.
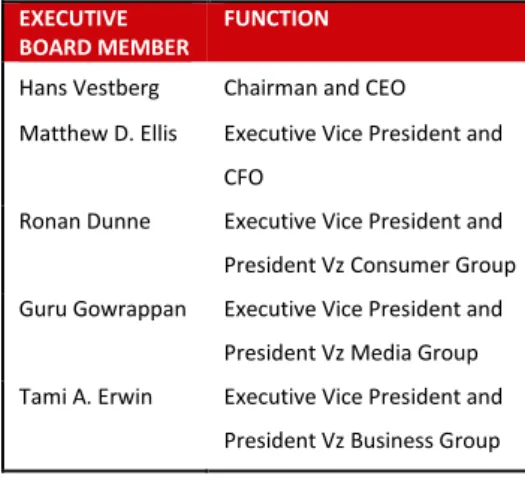
4 Table 4: Vz Executive Board
Source: Author, Verizon website
Table 5: Board of Directors Source: Author, Vz website 3. MANAGEMENT AND CO RPORATE GOVERNANCE
Corporate Governance
Executive board
Verizon executive board is composed by 15 executive members, including
Hans Vestberg is actual Chairman and CEO of Verizon Commination Inc.
since September 2018, replacing Lowell C. McAdam. Hans Vestberg has
joined Verizon in April 2017 and served as chief technology officer and
president of Global Networks, he had is formation on University of
Uppsala, Sweden, in 1991. Before joining Verizon Hans Vestberg was CEO
of Ericsson for six years, he also was a founding member of the
International Telecommunications Union (ITU).
Board Directors
Verizon have an internal board of Independent directors divided into 4
different committees, Audit, Corporate Governance and Policy (CGP),
Finance and Human Resources (HR), each committee oversees the
management of company risks that fall within its unique areas of
responsibility and has a written charter that defines the specific
responsibilities of each committee. Verizon's independent lead director is
Clarence Otis Jr, he says Verizon Board is committed to maintaining the
highest standards of corporate governance, guided by Verizon core values
of integrity, responsibility, and accountability in all they do.
Independent directors meet at least two times year and the
non-employee Directors of Board meet at least three times a year in executive
sessions, any director has the right to call a meeting or executive session,
at least 1 executive session access process and effectiveness of board
including opportunities to continue and orientation for new directors. In
one executive session, the Board receives HR committee’s report on CEO
performance and compensation
The lead director is elected by independent members at the prior annual
meeting of shareholders, lead shall act as liaison with Chairman, in
consultation with other Directors, should also chair all executive sessions
of the board and all others where the chairman is not present.
EXECUTIVE BOARD MEMBER
FUNCTION
Hans Vestberg Chairman and CEO Matthew D. Ellis Executive Vice President and
CFO
Ronan Dunne Executive Vice President and President Vz Consumer Group Guru Gowrappan Executive Vice President and
President Vz Media Group Tami A. Erwin Executive Vice President and
President Vz Business Group
Board of Directors COMMITTEE SINCE
Hans Vestberg Chairman and CEO 2018 Clarence Otis Jr. (Lead Director) HR, Audit, Finance 2006 Daniel H. Schulman HR (Chair) 2018 Shelly L. Archambeau Audit, CGP
(Chair)
2013 Mark T. Bertolini HR, Finance
(Chair)
2015 Gregory G. Weaver Finance, Audit
(Chair)
2015 Rodney E. Slater CGP, HR 2010 Kathryn A. Tesija Audit, CGP 2012 Melanie L. Healey HR, CGP 2011
5 Figure 4: Dividends paid (Billion USD)
Source: Verizon website
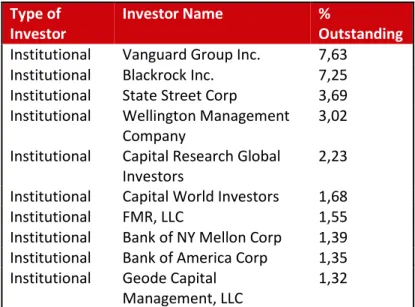
Table 6: Main Verizon Institutional Investors Source: Verizon website
Shareholder
About the shareholder structure, Verizon has 68,38% of Outstanding
shares held by institutional investors, in a total of almost 2850
institutions, where 31,11% are represented by the top 10 Institutions, all
from United States. Inside Managers have a total of 0,03% of outstanding
shares, and the remainder is divided by private and Mutual Fund
investors. From inside, HR committee is responsible for determinate
appropriate compensation structure, to prevent anyone to act in own
interest, then to ensure Verizon has financial ability to execute them,
Financial Committee monitors Verizon capital needs and financial plans.
Any shareholder or interested party may communicate directly with
Verizon board, any director or non-employee, by writing a letter to
Verizon address, then Verizon corporate Secretary will review and
periodically provides the board with copies of all communication that deal
with the functions of the board or its committee.
Corporate Responsibility
Verizon’s mission is to deliver the promise of the digital world by
empowering people to generate innovation and positive change, with this
in mind, Verizon believes that 5G will bring new opportunities to address
the most pressing environmental and social challenges of nowadays,
adopting new goals and commitments and taking a fresh look at all the
ways of technology and people can build a better and more responsible
future.
As Verizon core business is to connect people with each other and the
world around them, they are committed to fostering an inclusive
environment, through diversity and inclusion. It is proud that seven of the
Board Directors are women or black and 59% employees are Asian, Black,
Disability, LGBT, Hispanic, Native American and Veterans.
Type of
Investor
Investor Name
%
Outstanding
Institutional
Vanguard Group Inc.
7,63
Institutional
Blackrock Inc.
7,25
Institutional
State Street Corp
3,69
Institutional
Wellington Management
Company
3,02
Institutional
Capital Research Global
Investors
2,23
Institutional
Capital World Investors
1,68
Institutional
FMR, LLC
1,55
Institutional
Bank of NY Mellon Corp
1,39
Institutional
Bank of America Corp
1,35
Institutional
Geode Capital
Management, LLC
6 Figure 5: CSR targets defined by Verizon Source: Verizon website
Figure 6: CSR student programme results Source: Verizon website
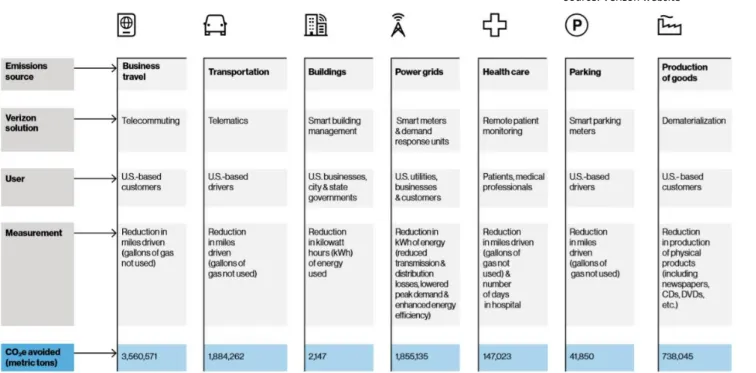
8,2 million Metric tons of CO2 emissions eliminated, equivalent to 1,6 million cars for one year
Figure 7: Verizon CRS enterprise solutions Source: Verizon website
Sustainability and Corporate Social Responsibility (CSR)
CSR defined by Verizon is divided into 3 main topics. Transformative,
related to issues where Verizon is uniquely positioned to have an impact,
like technology solutions and social issues. Strategic, for issues that may
represent risk or opportunity for the business, like climate change or
Employee welfare. At last, Fundamental, issues managed as part of
responsible business practices, like supply chain standards or appropriate
use of digital technology. All these measures behind having a positive
impact on the way people see and use technology, on environmental
politics and on economy, these measures leave Verizon to improve their
technological tools and be a more competitive and advanced company.
For the Transformative, Verizon has launched Innovative Learning school
program, giving students access to technology in the classroom and at
home, preparing the next generation in the US to be globally competitive
and successful. They have contact with augmented reality, virtual reality,
3D design, and printing. The same idea is applied to several partnerships
that Verizon has with many industries, from health care to making driving
safer improving the way they use technology.
On Strategic, from the last 10 years, Verizon decided to adopt strong
sustainable measures and goals to reduce environmental impact and drive
greater efficacy use of resources, at the same time the investment
developing green energies resources have increased. These measures had
already a critical impact, where the goal set in 2009 to reduce carbon
intensity by 50% until 2020 was already accomplished in 2016, and a new
goal to reduce again 50% carbon intensity from 2016 to 2025 is in a good
way, as 28% was already reduced.
At Fundamental area, Verizon is committed to seeking for the
performance of their suppliers at environment, labor, and human rights
practices, on this way, Verizon has a Supplier Code of Conduct with some
rules that suppliers should follow, to assure that all the previous
mentioned is accomplished.
7 Figure 8: Capital Expenditure from Peer Group Source: S&P Global
4. INDUSTRY OVERVIEW AND COMPETITIVE POSITION Economic Outlook
The global economic outlook is favorable, as International Monetary Fund projection, the world GDP projection is to grow around 3,2% in 2019, and United States has a projection of 2,1% GDP growth, followed by an inflation rate of 2%. About the telecom industry, it is expected to have an increase this year with 5G technology creating business opportunities helping increase the revenues on all different segments and projecting the development of IoT business. Since 2015 until the end of 2018, Wireless Revenues in US had an average annual growth of 1,89% and Wireline had an average annual growth of 1%.
Key Drivers of the Industry’s Profitability
The telecom market in the US is growing, the CAGR increased from 2014 to 2018 by 4,4% with Wireless Revenues around 2.69 Billion USD and it is expected to continue growing and have a CAGR of 6,4% and revenues near to 3.45 Billion US at the end of 2022.
The US market is profitable with an average EBITDA margins of 37% and average CAPEX around 13% in 2018. The market consists of 4 main players: AT&T, Verizon, T-Mobile, and Sprint, with T-Mobile growing the most. This is also reflected in its stock price, which tripled within the last 5 years. Estimations are very good, CAGR is expected to increase between 2019 and 2025 by 7%, this growth is explained by IoT and Business to Business (B2B), to support the telecom industry in terms of revenue and infrastructures expansion with new technology.
The business can be divided into wireline and wireless. Verizon and AT&T are the leading carriers in the US in terms of subscriptions, followed by T-Mobile and Sprint. The decline in the revenues from the mature voice business and the potentially softening messaging business is offset by the raising bandwidth-intensive data business. Carriers must focus on their positioning within the market and the composition and needs of their subscriber case. However, based on its growth trajectory, mobile data traffic is already the key driver of traffic across mobile networks and is emerging as the principal growth engine for overall service revenues, as mentioned before are B2B and IoT.
Penetration rates increase, incremental revenue opportunities from the migration to smartphones is likely to diminish. Moreover, while mobile data technology provides carriers with the opportunity to expand their addressable market to a roster of other devices as the IoT is becoming gaining importance. Incremental revenue opportunity per device is likely less than the revenue opportunity from the initial set-up of a new data plan. Therefore, as mobile data penetration gets to the more mature phase of the adoption curve, I believe investors should anticipate the potential for slower service revenue growth. Although telecom companies have been profitable in the past, improvements in pricing, cost and capital efficiency will be needed to maintain such levels in the future. This underlying move from voice to data will alter the industry’s competitive landscape and govern mobile carriers’ decisions. Given the rapid penetration of data access, the next years will be a defining period for the US telecom industry whereby decisions made today will impact whether operators evolve into value-added service providers or simply become access suppliers of a fairly commoditized product.
8 Competitive Environment of the Industry
The market is an oligopoly. The number of sellers is low, the product is relatively homogenous, the entry barriers are high, the pricing power of the firms is not high and the companies are trying to increase market share through non-price competition.
As the US telecommunication companies operate mostly on US territory, macroeconomic trends in the US are significant and the global outlook can be neglected. Fed has raised its interest rates between the begin of 2016 until the end of 2018 from 0,5% to 2,5%, and I expect that the interest rate keeps between 2% and 2,5% until 2022. This will influence the debt service of the companies, as most of its debt is middle and long term. Inflation is expected to settle around its target of 2% at the end of 2019, this is in line with real GDP growth around 2,1% at end of 2019, and the unemployment rate is fluctuating from 3,7% to 4,1% in 2019. Consumer global spending increased 7% from the beginning of 2016 until the end of 2018. However, the telecom industry is overall highly independent of the business cycle.
I expect that demand will increase, people are highly dependent on their smartphones and this trend will even increase as more and more devices will be connected to the internet, the revenues of Wireless equipment have increased 47% between 2016 and 2018. US consumers are currently looking at their devices more than before. However, the business model of most telecom carriers seems to be outdated, traditional telecom business is being replaced by substitute products such as Facebook Messenger, WhatsApp or Viber, and the consumer profile is changing as well.
Carriers can decide between two main strategies: low-cost or product/service differentiation. However, the quality of data and voice services is crucial in the industry. The future and competitiveness of telecom companies are dependent on capital allocation and investment decisions. Carriers will need to upgrade their connectivity infrastructure and invest in IoT devices development. In addition, manual processes will have to be automatized to ensure an efficient cost structure. New technologies will allow carriers to move away from proprietary, hardware-based network equipment to software-based network functions. As a result, further improvements in efficiency and effectivity will be possible.
Figure 9: US Wireless Revenue (In Million) Source: Author, Bloomberg
Figure 10: US Wireline Revenue (In Million) Source: Author, Bloomberg
Figure 11: YoY Wireless & Wireline Revenue Growth Rate Source: Author, Bloomberg
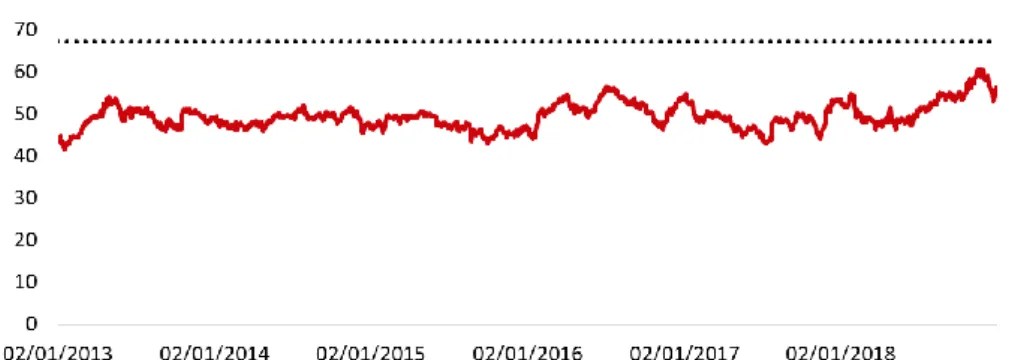
Figure 12: Price per Share of Peer Group, 2013-2018 Source: Author, Bloomberg
9 34% 26% 16% 12% Verizon AT&T T-Mobile Sprint Peer Companies
The four major carriers are classified as a peer group based on their similarity to their principal business activity. The peer group has been found based on information from Bloomberg Market Revenues. In addition, the companies can be classified as non-cyclical (they display relatively low sensitivity to the business cycle and their demand remains relatively stable). Telecommunication companies also have revenues from the sale of electronic products, mostly mobile phones, which are cyclical.
The main players in the US Telecom market are, Verizon, AT&T, T-Mobile, and Sprint. Based on this information the structure of the market becomes clear, T-Mobile is highly growing, and Sprint lost the biggest number of subscribers, which lead to Sprint entering a price war and offering the cheapest post-paid plan for unlimited services.
Currently, Verizon and AT&T can be clearly classified as market leaders and a reference for other companies. They are also the only ones who pay dividends on their stocks.
SWOT industry breakdown
The (US) telecom industry has high entry barriers for new entrants, high levels of capital expenditure and FCFF are needed to invest in R&D, and M&A activity as technology is evolving very fast. However, the industry is also able to offer strong rewards, as the most population is demanding all-time connectivity and this trend will even increase due to the 5G and IoT.
The switch from standard phone services to mobile data plans has resulted in high growth in the past decade for most companies. The next years and months will show if the leading companies will be able to gain even more momentum or if substitute products will gain more importance. The internet connectivity and download speed are becoming more and more important and investments in 5G and fiber networks are crucial, in this area Verizon was the first in the world to launch commercial 5G with residential broadband deployments, and in 2019 will implement mobile 5G. Strategic partnerships and the adaption to consumer profiles will determine future revenues. The US companies are trying to expand their services through offering packages deals, such as combinations with TV services resulting in them penetrating other difficult markets, which are struggling also with substitution products, such as Netflix or Amazon Prime. The US telecom industry is highly complex, and its future is being decided at the moment. The next months will show if companies are able to attract and keep customers. The prices of phone plans are declining to lead to worse financial results per customer for all companies. Further M&A activity in the sector or price wars is possible and could change the SWOT breakdown to a high extent.
Figure 13: Wireless Market Share in 2018 Source: Author, Bloomberg
Figure 14: Dividends paid per share Source: Author, Bloomberg
Figure 15: Total dividends paid (In Million) Source: Author, Bloomberg
10
Verizon
AT&T
T-Mobile
Sprint
Overall
Strength Dividend yield of 4,2% in 2018 Dividend yield of 5,6% in 2018 Highest customer growth
Cheapest postpaid plan for unlimited phone
services Heavy reliance on mobile phones High number of M&A Highest wireless coverage on US territory
Stock price increased by 69% from 2016 to 2018 Increasing Postpaid service demand Lowest Churn Rate The industry is growing in the US 34% market share EBITDA margin 32% in 2018 Weakness A decrease in Operating Income from 2016 to 2018 Debt increase of 46% from 2016 to 2018 resulting in $166B Only 16% of market share Subject to foreign investment regulations in the US High-cost structure
Negative Profit Margin
around 6%
High investments in R&D are needed
The churn rate of 2% and only 12% of market share Opportunity High investments in 5G technologies Increasing
dividends Merger with Sprint Merger with T-Mobile
Fiber and 5G technology Increasing dividends Acquisition of Time Warner in 2018 Increased decision power through the share repurchase
program
Focus on discount services
Single provider of TV, internet and phone
services CAPEX/service revenue High investments in advertising acquisition of licenses and other technology
companies
CAPEX/service revenue is higher
than 16%
the increasing number
of smartphones
Threat
Highest prices in 2019
Sunk costs through
R&D and M&A No dividends No dividends Interest rate risk sunk costs
through R&D and M&A
The merger of T-Mobile with Sprint
Heavy reliance on the 4G network
low investments in advertisement and
R&D
changes in tax and government regulations The merger of T-Mobile with Sprint Defendant in numerous intellectual property lawsuits Substitute products for telecom services
Quality of network
service Table 7: SWOT table of peer group
11 Porter’s Five Forces
The threat of New Entrants: Low
Although the market is still profitable and might attract new entrants the infrastructure required for entering the telecom market is highly cost-intensive, thus, the threat of new entrants is relatively low. In addition, the market is state-regulated which poses additional obstacles for new companies. However, telecom companies, especially Verizon are expanding into other communication sectors, such as television and are aiming to offer all-in-one packages.
Bargaining Power of Suppliers: Moderate
Telecom companies are often facing a single supplier of goods or materials as their technology is often highly specialized. The iPhone serves as a good example for this, Apple decided to build a partnership with AT&T and not Verizon, which gives AT&T a strong advantage in the market. The power of suppliers is decreased for Verizon as they have a dedicated organization, which handles the purchases and negotiations with partners.
Bargaining Power of Buyers: Moderate
A growing customer base is the most important source of growth, to prevent switching telecom companies must adapt to the needs of their customers and often offer special packages for loyalty. Post-paid customers are often locked in a two year contract, therefore, the switching costs to other providers are often high. Companies must act according to their business strategies and satisfy their customers.
The Threat of Substitute Products: High
The telecommunication market is extremely changing. Traditional text messages or voice calls are being substituted by messenger services. The revenue structure for the industry is becoming highly dependent on internet services, companies will have to adapt to new consumer needs to remain sustainable.
Competitive Rivalry: High
There is fierce competition among telecommunications service providers. This is due to the saturation of the market in several different areas the industry operates, including wireless voice. This means that growth comes from customer attrition or defection. The competition among the companies in the industry controls everything from prices to upgrading network.
12 5. INVESTMENT SUMMARY
Recommendation
The final recommendation for Verizon, is to buy, based on a target price of USD 67,38 per share at the end of 2019, using the DCF method through FCFF as a main model, this represents an upside around 20% with Medium risk assessment, I can also conclude that Verizon is currently undervalued, that could be demonstrated with the growth on stock price around 7% since the beginning of 2019 until 20th September 2019.
I believe that the implementation of 5G will have a big impact on company growth for the next coming years, as this represents a big advance on data speed and data quality, it will also boost the IoT growth, both things will have a direct positive impact on Wireless equipment revenues and Wireline revenues.
Company Valuation
Besides DCF model, I also have computed other 3 models as a complement for my research, on DDM model, I have computed the Gordon growth model, with target price of USD 58,90 representing an update around 5%, it’s indicated to companies with constant growth in payment of dividends, this could be looked at a limitation for Verizon, as the growth rate of dividends per share was not constant over the last 5 years used to compute this model. For the multiples approach, I have used an Enterprise and an Equity valuation, for the Enterprise I reach to a target price of USD 71,26 representing an upside of 27% and for the Equity model, I got a price of USD 54,74 representing a decrease of 3%, but for the equity valuation was not possible to use all the 4 companies that fulfilled the peer group, as Sprint got negative earnings per share on 2018 and due to that was excluded from P/E model, making this a strong limitation for the calculations on this model. For the forecast period, I project a growth on EPS, as a result of the expected increase of revenues and to keep the percentual level of direct costs, this guides us to stable profitability ratios and higher profit.
Company Risks
As already observed, telecom industry is a sector that requires a high level of investment, in equipment, licenses, R&D, it’s also exposed to some systematic risks that could bring high losses for Verizon, like environmental events that can destroy wireline equipment’s such as environmental regulations that can be imposed by the governments to reduce radiation from infrastructures. From finance perspective Verizon is highly exposed to US market changes, like interest and tax rates, inflation and recession periods, this dependence from the US market explains Verizon levered beta around 1. Verizon is also exposed to idiosyncratic risks, telecom industry has a very short innovation cycle, with a high pressure to companies release new products and services, at the same time exist a reputation risk, as customers are very demanding with service quality, so Verizon needs to attract and retain qualified people while appropriately manage costs related with employees and employees benefits.
Table 8: Verizon Enterprise Value Source: Author, Company
Enterprise Value USD
Terminal Growth Rate 1,2%
Perpetuity WACC 5,7%
Terminal Value 358 852
NPV of FCFF 56 504
Enterprise Value 415 356
Table 9: Verizon Price Target Source: Author, Company
Price Target USD
Enterprise Value 415 356
Net Debt 2019 105 198
Value of Equity 310 158
Nº of Outstanding Shares 4 142 Equity value per share 75
Small cap discount 10%
Price at the end 2019 67,39 Price at 20th September 2019 60,21
Table 10: Verizon Price Target Source: Author, Company
Price Target by Method USD Growth
DCF 67,39 19,86%
DDM 58,90 5%
EV/EBITDA 71,26 27%
P/E 54,74 -3%
Average without P/E 65,85 17% Price at 31th December 2018 56,22 -Price at 5 July 2019 58,31 4% Price at 20 September 2019 60,29 7%
Figure 16: Verizon EPS Source: Author, Company
13 6. VALUATION
As explained, company valuation was mainly done with the focus on DCF model, as my target is to focus on long term value of the Verizon, this model helps us understand all the finance structure from recent past, present and what I expect, based on several assumptions, for Verizon future.
Revenues
Verizon revenues are aggregated on 3 different segments, as mentioned, Wireless and Wireline are the core business. Wireless, for the forecast period, I expect an increase on this segment revenue supported by the expected demand for equipment’s that support 5G technology as I expect that customers will replace their equipment’s, at the same time it’s expectable that will appear in the market new wireless products, based on IoT growth. Service revenues it’s expected to continue decreasing, following the trend from recent past years, this is explained by a more competitive market, fixing Service Market share 29,6% in 2022. Wireline, this segment mainly focuses on consumer markets and in enterprise solutions, it’s a segment which I expect a slower increase, as the global telecom market nowadays, and in the future, it’s more focused on Wireless connections. I expect an increase in revenues for the consumer group due fiber-based network, supporting high video and data quality services. For the enterprise, the fiber network will also be the base with Verizon allowing companies to communicate with advanced business services. Verizon is also planning to give fiber a multi-use to create opportunities to generate revenues from fiber-based services to support both Wireless and Wireline services, named “Intelligent Edge Network initiative”. Corporate and other, based on my forecast, I expect an increase of the corporate segment for the next coming years, following the trend 2016-2018, Verizon revenues will increase in this segment, responsible for Verizon Media and telematics business, as this segment will have benefits with the emerging IoT market, on 2017 and 2018 Verizon Media has recognized IoT revenues 1,5 and 1,6 USD Billion, means an increase of 52% and 11% YoY respectively.
Eliminations
Verizon earns revenues from contracts with customers, primarily through the provision of telecom and other services and through the sale of Wireless equipment. Verizon has adopted an account standard update (ASU) 2014-06, under topic 606, “Revenue from contract with customers”, was adopted on January first, 2018, this standard update clarifies the principles for recognizing revenue and develops a common revenue standard for the US Generally Accepted Accounting Principles (GAAP), the amount projected for the next years was calculated under a YoY average growth rate, as Verizon has calculated on annual report from 2018 an approach for these amounts from the recent past years.
Figure 17: Verizon Revenues (In Million) Source: Author, Company
Figure 18: Verizon Wireless Revenues (In Million) Source: Author, Company
Figure 19: Verizon Wireline Revenues (In Million) Source: Author, Company
14 Main Costs
Verizon operational costs are mainly distributed by the cost of services, Selling, general and administrative expenses, and, Wireless cost of equipment, they represent 53% of revenues in 2019F. Cost of Services represents 25% revenues in 2019F, it’s related to costs directly attributable to a service, they are salaries and wages, materials and suppliers, contracted services, network access, and transport costs, computer system support and outsourcing service. It’s inputted to all revenue segments. Selling general and administrative, 24% of revenues in 2019F includes salaries and wages not directly attributable to a service or product, debt charges, taxes other than income taxes, advertising, customer billing, call center, and others. Wireless equipment revenue represents 23% of all operation costs if I include D&A, and it’s only related to one segment activity, represent 18% of total revenues and 26% of the Wireless segment in 2019F so, this is the most important cost associated to Verizon. In general, I expect they keep increase following the revenues.
Depreciation and Amortization
Verizon assets subject to depreciation are Property, Plant and Equipment, (PPE), they represent 34% of total assets, after depreciation, the composition of depreciation is 56% from Wireless, 36% from Wireline and 7% from Corporate and Other. They are depreciated on a straight-line basis over the estimated useful life since there is no detailed information about the composition of PPE, it was decided to use an average of YoY grows of accumulated depreciation as measure for depreciation. About the amortization, Verizon has available on annual reports from 2018 the amounts that are expected to be amortized for the next years. Capital Expenditure (CAPEX)
As mentioned before, Verizon and his peers from telecom sector have a high level of Capital expenditure, Verizon CAPEX represents 14% of total revenues in 2019F, it’s mainly used to R&D, adding capacity and density to 4GLTE networks, such as the global implementation of 5G in US market. CAPEX from Wireline, represents 19% of total wireline revenues in 2019F, and it’s expected to keep around this percentage during the forecast justified with an increase on investment on fiber assets, with the purpose to deliver high-speed and data quality to homes and businesses, also, following the program of fiber multi-use explained before, for Wireless the investment on CAPEX in 2019F represents 12% of revenues and will keep this level, with the investment focused on 5G tech and fiber multi-use program.
Wireless Licenses and Goodwill
Acquisition of wireless licenses represents 35% of total assets in 2019F, and it’s the most important intangible asset of Verizon, these licenses are not amortized, they are usually issued for 10 years and subject to renewal by Federation Communications Commission (FCC) at nominal cost, the valuation can be determined by a qualitative approach considering the business enterprise of wireless using market, industry and economic conditions as assumptions, or through a quantitative approach calculating cash flows using potential of
Figure 20: Verizon costs structure from 2018 Source: Author, Company
Table 11: Verizon operational costs (Excluding D&A) Source: Author, Company
2019F 2020F 2021F 2022F
Cost of services 33% 33% 34% 34%
Wireless cost of equipment 23% 22% 22% 21% Selling, general
and administrative expense 31% 31% 31% 31%
Figure 21: Verizon D&A Source: Author, Company
Figure 23: Verizon Wireless licenses and Goodwill Source: Author, Company
Figure 22: Verizon Capital Expenditure Source: Author, Company
15 company with wireless license as only asset. Currently, there are no legal,
regulatory, contractual, and others, factors that limit the useful life of the licenses, but as explained, they are annually tested for impairments. For next coming years it’s expected they keep increase with the implementation of 5G. Goodwill is also an important component of Verizon assets, represent 9% of total assets in 2019F and as wireless licenses, it’s treated as indefinite-lived intangible assets, on Verizon structure, 75% of goodwill is related with Wireless segment, 16% with Wireline and remain 9% with Corporate and Other segment. Oath goodwill impairment in 2018 was related with Verizon Media, included in Corporate and Other segment, as a result of annual impairment test, this was determined due revenues and earnings lower than expected, with an increase on competitive environment for digital products.
Debt
On last years Verizon total debt was between around USD 108 000 Million and USD 117 000 Million, for the next coming years it’s assumed to keep these amounts, but comparing with 2016 mainly due the increase of Verizon Balance structure, as observed, Debt/Equity has decreased from 4,5 in 2016 to 2,07 in 2018 and will be 1,17 in 2022F as result of Verizon plan to reduce his leverage. Net Working Capital (NWC)
During the forecast period, it’s expected that current liabilities will be higher than current assets, giving a negative variance of NWC, this is mainly explained by the increase of payables, with an average growth of 6,8 days year, compared with a collection period average growth 3 days year, payables increase it’s explained with the investment that will be done in 5G tech, IoT and fiber optic that requires more payments.
DCF Valuation & Assumptions
Valuation period used on this model was 4 years, starting in 2019 until 2022, plus a terminal period, both used to calculate the Free Cash Flow to the Firm (FCFF), as below, through EBIT (1-t), D&A, variation on NWC and CAPEX as variables for FCFF, these amounts have been reached as explained.
Figure 24: Verizon Debt Source: Author, Company
Table 13: Verizon FCF table Source: Author, Company
FCFF 2019F 2020F 2021F 2022F Terminal EBIT(1-t) 23 217 23 706 24 731 25 692 25 692 D&A 13 312 14 558 15 144 15 858 15 858 DNWC (1 330) (3 955) (4 416) (4 956) (4 956) CAPEX (18 825) (19 347) (19 945) (20 637) (20 637) FCFF 16 374 14 962 15 514 15 957 15 957 Table 12: Verizon NWC Source: Author, Company
Net Working Capital
2019F
2020F
2021F
2022F
Total ∆ Current Assets
213
(1 913)
(2 141)
(2 407)
Total ∆ Current Liabilities (1 543)
(2 041)
(2 275)
(2 549)
DNWC
(1 330)
(3 955)
(4 416)
(4 956)
16 The Discount Rate used was a result of Weighted Average Cost of Capital
(WACC), which combines the cost of equity (Ke) and for the cost of debt (Kd). Both costs of equity (E) and debt (D) must be pondered upon the weight of each one on the Verizon Balance structure. Verizon WACC calculated for 2019F is 4,34% and it’s expected a WACC of 4,44% in 2022F, this increase is justified by the increment of Equity weight from 24% in 2019F to 32% in 2022F and the cost of equity is higher than the cost of debt. All the components used on WACC, Ke, Bl and Kd that are not calculated through Verizon financial results have been obtained by Aswath Damodaran calculations, expect Interest and Tax rates.
The cost of equity, is the return rate that company investors require when they are investing, it’s composed by a risk-free rate (Rf), a market risk premium (MRP) and Verizon Beta levered (Bl), for 2019F Verizon have a Ke of 8,56% and will decrease during the period until a rate of 7,42% in 2022F, this decrease is also explained by the decrease of Debt/Equity ratio (D/E) as a component of Bl calculation, Verizon Beta (B), is around 0,47 and keeps this value during the forecasted period and tax rate of Verizon is around 27% during the forecast period.
Cost of debt, is the effective rate that Verizon pays on its debt, applying the tax rate (T), 27% to the marginal interest rate (r) 4,1%, these rates will keep the same during the forecast period, but, it will slowly lose effect due the fact debt weight will decrease as explained before.
Enterprise Value (EV) is the result of the sum of Terminal value, that was calculated using a perpetuity growth model, computed using FCFF from the terminal period, a growth rate (g) and a WACC, both different for the terminal period, and Net Present Value (NPV) of each FCFF except the FCFF from terminal period, using WACC initially calculated.
TV = (FCFF * (1 + g) / (WACC - g) NPV FCFF = ∑ FCFF / (1 + WACC)
ⁿ
EV = TV + NPV FCFF Bl = B * (1 + D/E * (1 - T) Ke = Rf + Bl * MRP Kd = r * (1 - T)17 Enterprise EBITDA EV/EBITDA Stock Price Earnings Per Share P/E
Sprint 56798 3136 18 5,82 -0,03
-Verizon 344185 41859 8 56,22 3,76 15
AT&T 388353 54526 7 28,54 2,85 10
T Mobile 65654 12398 5 63,61 3,4 19
Average - - 9,7 - - 15
Dividend Discount Model
Verizon is a company with a large dividend payment history, dividends are paid on quarter basis, in March, June, September, and December, in 2018 was paid a total of USD 2,385 per share (D), representing a YoY growth of 3,17% compared with 2017 and 5,51% compared with 2016.
Model used was Gordon Growth Model, it’s a quantitative method that valuates stock based on the net present value of future dividends, this model it’s appropriate to mature companies with stable growth and leverage, but show us a few limitations, as the growth rate must be constant and the stock price calculated it’s very sensitive to changes in cost of debt less growth rate. For the forecast period, Verizon has a Payout Ratio of 49% year.
Multiples Approach
To get a target price using multiples valuation, I’ve used two different models, one through enterprise value, EV/EBITDA and the other through an equity approach, Price/Earnings (P/E).
For the enterprise model, I’ve reached to a target price of USD 71,26 per share, meaning a potential increase of 27% of the price, comparing with the price from the end of 2018. To reach these numbers, I’ve calculated the EV/EBITDA of each company from peer group, and then, using the average amount multiplied with Verizon EBITDA I’ve reached to Verizon enterprise value by peer group.
For the P/E model, I’ve reached to the average P/E of the peer group, that multiplied by Verizon Earnings per Share (EPS), give us a price target of USD 54,75 meaning a decrease of 3% of the stock price compared with the price at the end of 2018. But for this model, as explained before, it was not used the P/E from Sprint, as they got negative earnings, and for that reason, in specific, this model is limited to my target valuation.
Both valuation approach, dividend and multiples, are a complement for my valuation, as it’s possible to understand, they use few financial information and have limitations, when compared to DCF model that is a model more complete that uses finance information from Balance and Income statements as the main basis, computed with a an average of the cost of equity and debt, at the same time that I have to forecast future financial information, assuming several different assumptions.
Stock Price = D / (Ke – g)
EV/EBITDA USD
Vz EBITDA 2018 41 859 Average Peers EV/EBITDA 9,7 Vz EV by Peers estimate 405 531 Vz Net Debt 110 318 Vz Equity by Peers Estimate 295 213 Shares outstanding 4 142
Price at end 2019 71,26
Price at 20th September 2019 60,21
Table 15: Verizon EV/EBITDA Source: Author, Company, Bloomberg
Table 16: Verizon P/E
Source: Author, Company, Bloomberg
P/E USD
Vz EPS 3,76
Average Peer P/E 14,56
Price at end 2019 54,74
Price at 17th September 60,21
Table 14: Dividend Discount Model Source: Author, Company
Dividend Discount Model USD
Dividend paid 2018 2,385 Cost of Equity 7,4% Growth Rate 3,2% Estimated Dividend 2019 2,46 Price at end 2019 58,90 Price at 20th September 2019 60,21
Table 17: Peer group Enterprise and EBITDA Source: Author, Company, Yahoo Finance
18 7. FINANCIAL ANALYSIS
Summary
Verizon presents a strong financial structure, it is expected that revenues will increase at a CAGR of 3,37% from 2018 to 2022F and gross profit at CAGR of 3,23% for the same period, the expectation is to have a gross margin around 57%. Cost of Goods Sold (Cogs), will grow at a CAGR of 3,56% between 2018 and 2022F, explained with the implementation of 5G that impulse the cost of service and wireless cost of equipment, this growth is offset with a growth average of revenues. Since Verizon will have a significant decrease with D&A, EBIT will increase from 17% in 2018 to 22,7% in 2022F and Net Profit will keep stable around 16% during the forecast period. This stability on the profit margins give Verizon the possibility to keep growing and investing in new products and services, on the forecast period Verizon will have an average of USD 19 689 Million in Capital Expenditure, as mentioned before, leverage will decrease, as debt ratio on 2022F will be 38%, representing a decrease of 6% compared with 2016, this is more evident compared with the D/E ratio that will decrease to 1,17 in 2022F. Payables period and the operating cycle will increase, giving a higher cash cycle, this could bring Verizon liquidity problems, since the cash ratio will be around 0,01 on 2022F, but if I compare with current ratio, 0,82 and quick ratio 0,79 both in 2022F, Verizon will keep a stable coverage of current liabilities with the current assets.
Taxes, for the forecast period, was assumed a fixed annual tax rate of 27% based on Damodaran statements for the United States in 2018. This was assumed mainly due the inconsistent amount of taxes paid/received in previous years, assuming a more defensive forecast approach calculation, it is expected the amount of taxes paid will have a CAGR of 2,89% in 2022F compared with 2016 and CAGR of 20,2% compared with 2018. In 2017 benefits are explained with the Oath goodwill impairment charge that is not deductible for tax purposes.
Return on Equity (ROE), currently Verizon has an ROE of 33% in 2018, this is above the peer group, 27%, during the forecast, ROE of Verizon will decrease to 24% in 2022F, under the peer group average, this decrease it is explained by the growth on equity valuation, with a CAGR of 12,94% between 2018 and 2022F mainly due the increase of retained earnings, compared with net income CAGR of 8,71% for the same period. Verizon Return on Assets (ROA), it will keep stable around 17% year for the forecast period, when both ROE and ROA compared, it is possible to understand that company efficiency it will keep similar during the forecast period, but ROE ratio will decrease as equity weight increase changing the financial structure but keeping similar global returns.
Dividends, it is expected to keep increasing the total dividends paid to investors in 4,6% year, at the same time will increase weighted average shares outstanding by 0,35%, it is expected Dividends per share will grow from USD 2,38 in 2018 to USD 2,80 in 2022F. Using as measure DCF model presented, it is expected a Dividend Yield decrease from 4,24% in 2018 to 3,66% in 2019F explained by the high increase of stock price for 2019F.
Figure 28: Dividends paid from 2016 to 2022F Source: Author, Company
Figure 25: Income Statement Margins Source: Author, Company
Figure 27: ROA vs ROE Source: Author, Company Figure 26: Verizon Taxes paid Source: Author, Company
19 8. INVESTMENT RISKS
Technologic Risk Technological risk (TR)
The fast pace of technological innovation is threatening the competitiveness and position of telecom companies, 5G and fiber technology are expected to become the market standard in 2020, Verizon is well-positioned in this matter, as mentioned before, Verizon wants to be the first company in the US to commercialize both fixed and mobile 5G. In 2018 already had 4 regions covered with 5G broadband service.
Changing consumer/customer demand profile (CP)
Verizon needs to adapt to the new needs of customers to remain a relevant market competitor.
Data protection & cybersecurity (DP)
The lack of data protection and adequate measures against cybersecurity represent a high threat of fines and penalties imposed by regulators and a threat of losing customers. Significant investments in data encryption and robust physical defenses are made by Verizon.
Regulations and Legal New regulations (NR)
Wireless providers must be licensed and the ability of all companies to offer their services could be harmed by adverse actions of the FCC, however, the probability is not very big as it is engaging in deregulation activity.
Taxation changes (TC)
A change on tax rates and benefits applied to telecom industry can have a important impact on Verizon financial structure
Market and business model Interest Rate (IR)
An increase in the Fed rate, can have a significant impact on the debt service. Liquidity Risk (LR)
Market capitalization can be undermined as the balance sheets of telecom companies feature a huge amount of intangible assets, like Wireless licenses and Goodwill.
Currency & commodity price risks (CR)
Core business activities are in the USD, the forex risks are low. Increasing competition (IC)
New developments of wireless companies and broadband internet phone services are taking away market share from telecom companies as new communication systems and devices appear.
Figure 29: Verizon Risk Matrix Source: Author
20 The threat of new entrants (NE)
Market entry is restricted by the Federal Communication Commission (FCC) and companies typically lock customers into 1 or 2-year contracts, which allows for reliable projections about future earnings.
Mergers & acquisitions (MA)
Dropping margins and declining revenues lead to additional M&A activity, telecom companies are protecting their market share through acquiring not only direct competitors but also forming strategic alliances with external partners. The M&A regulations in the US have been softened this year, giving Sprint and T-Mobile more possibilities to enter partnerships. The FCC, the supervisor for M&A, has engaged in a deregulation agenda, opening possibilities for all market participants.
Operational
Natural disasters, armed conflicts, and terrorism (ND)
The threat of terrorism is increasing worldwide with political instability raising in a number of regions. Natural disasters on the US territory are unpredictable and can lead to major damages for the network equipment of Verizon.
Supply chain risks (SC)
Verizon often require specific components that can only be provided by one supplier. Additional challenges can arise during periods of non-forecasted increases in demand if supply chains are not sufficiently resilient.
Sensitivity Analysis
For the sensitivity analyses it was tested a change of 5% per year for the estimated period, this was applied to the cost of service and to the wireless cost of equipment, as in table 18, it is possible to verify that only if the cost for both variables increase 5%, that the target price it will be smaller than the last closed price of 2018 USD 56,22 and for remain scenarios an investment on Verizon shares will continue to be profitable. It is also possible to verify, as expected, that Verizon is more sensitive to a variation on the cost of service compared with the cost of wireless equipment.
For the revenues it was also tested an increase of 5% year between 2019F and 2022F, making the target price increase to USD 97,20, giving an upside potential of 79%, but if the revenues decrease 5% year for the same period, the target price it will be USD 37,57 giving a potential decrease of 33%.
About the discount rate applied to Verizon, if I duplicate the WACC used for the periods between 2019F and 2022F, the target price will decrease from the initial prevision of 67.39 to USD 66,23 this show that Verizon target price is low sensitive to changes in WACC applied.
Table 18: Variation Costs Source: Author, Company
-5% - +5 -5% 80,92 72,6 64,27 - 75,21 67,39 59,07 +5% 70,51 62,18 53,86
Cost of Service
W ir e le ss co st o f e q u ip m e n t21
2016 2017 2018 2019F 2020F 2021F 2022F
Property, plant and equipment 232 215 246 498 252 835 269 210 288 827 308 893 331 187
Less accumulated depreciation (147 464) (157 930) (163 549) (174 716) (187 473) (201 116) (215 743)
Porperty, plant and equipment, net 84 751 88 568 89 286 94 494 101 354 107 777 115 443
Investments in unconsolidated businesses 1 110 1 039 671 666 660 655 650
Wireless licenses 86 673 88 417 94 130 96 824 99 596 102 446 105 379
Goodwill 27 205 29 172 24 614 24 532 24 451 24 370 24 289
Other intangible assets, net 8 897 10 247 9 775 10 679 11 667 12 747 13 926
Non-current assets held for sale 613 0 0 0 0 0 0
Other assests 8 536 9 787 11 717 13 474 15 493 17 816 20 487
Inventories 1 202 1 034 1 336 1 032 1 078 1 129 1 186
Receivables 17 513 23 493 25 102 26 530 28 470 30 620 33 015
Assets held for sale 882 0 0 0 0 0 0
Prepaid expenses and other 3 918 3 307 5 453 4 116 4 043 3 984 3 939
Cash & Equiv. 2 880 2 079 2 745 3 933 2 352 1 232 237
ASSETS 244 180 257 143 264 829 276 280 289 166 302 776 318 550
2016 2017 2018 2019F 2020F 2021F 2022F
EQUITY
Commom stock 424 424 429 429 429 429 429
Additional paid in capital 11 182 11 101 13 437 13 381 13 324 13 268 13 213
Retained earnings 15 059 35 635 43 542 54 324 65 251 76 758 88 734
Accumulated other comprehensive income 2 673 2 659 2 370 2 567 2 567 2 567 2 567
Commom stock in treasury, at cost (7 263) (7 139) (6 986) (6 848) (6 713) (6 581) (6 451)
Deferred compensation - employee stock ownership plans and others 449 416 353 332 313 294 277
Noncontrolling interests 1 508 1 591 1 565 1 613 1 662 1 714 1 768
Equity 24 032 44 687 54 710 65 798 76 833 88 450 100 537
LIABILITIES
Long-term debt 105 433 113 642 105 873 106 958 108 054 109 161 110 279
Employee benefit obligations 26 166 22 112 18 599 15 869 13 540 11 552 9 857
Deferred income taxes 45 964 31 232 33 795 33 525 33 323 33 323 33 323
Other Liabilities 12 245 12 433 13 922 14 790 15 712 16 691 17 731
Debt maturing within one year 2 645 3 453 7 190 7 058 7 380 6 999 7 674
Accounts payable and accrued liabilities 19 593 21 232 22 501 24 196 26 387 28 809 31 502
Other current liabilities 8 102 8 352 8 239 8 087 7 937 7 790 7 646
EQUITY + LIABILIT. 244 180 257 143 264 829 276 280 289 166 302 776 318 550
2016 2017 2018 2019F 2020F 2021F 2022F
Service Revenues and other 108 468 107 145 108 605 110 146 113 871 118 144 123 082
Wireless equipment revenues 17 512 18 889 22 258 24 322 26 530 28 884 31 382
Total Operational Revenues 125 980 126 034 130 863 134 467 140 401 147 028 154 464
Operating Expenses
Cost of services (exclusive of items shown below) (30 463) (30 916) (32 185) (34 037) (36 005) (38 226) (40 792)
Wireless cost of equipment (22 238) (22 147) (23 323) (23 679) (24 126) (24 670) (25 318)
Selling, general and administrative expense (28 102) (28 592) (31 083) (31 634) (33 239) (35 110) (37 302)
D&A (15 928) (16 954) (17 403) (13 312) (14 558) (15 144) (15 858)
Oath goodwill impairment 0 0 (4 591) 0 0 0 0
Total Operational Expenses (96 731) (98 609) (108 585) (102 663) (107 927) (113 150) (119 270)
EBIT 29 249 27 425 22 278 31 805 32 474 33 878 35 194
Equity in losses of unconsolidated businesses (98) (77) (186) (120) (120) (120) (120)
Other income (expense), net (3 789) (2 021) 2 364 2 600 2 860 3 003 3 154
Interest expense (4 376) (4 733) (4 833) (4 700) (4 758) (4 788) (4 862)
Income Before Benefit For Income Taxes 20 986 20 594 19 623 29 585 30 456 31 973 33 365
Benefit for income taxes (7 378) 9 956 (3 584) (7 988) (8 223) (8 633) (9 009)
Net Income 13 608 30 550 16 039 21 597 22 233 23 340 24 357
Net income attributable to noncontrolling interests 481 449 511 590 607 637 665
Net income attributable to to Verizon 13 127 30 101 15 528 21 008 21626 22703 23692
Net Income 13 608 30 550 16 039 21 597 22233 23340 24357
*EBITDA 41 290 42 281 41 859 47 597 49772 51905 54085
Basic Earnings Per Common Share
Net income attributable to Verizon 3,22 7,37 3,76 5,1 5,2 5,4 5,7
Weighted-average shares outstanding (in millions) 4 080 4 084 4 128 4 142 4 157 4 172 4 186
Appendices
Appendix 1: Balance Statement
(In Million)22
2016 2017 2018 2019F 2020F 2021F 2022F
Net Income 13 608 30 550 16 039 21 597 22 233 23 340 24 357
D&A 15 928 16 954 17 403 13 312 14 558 15 144 15 858
Employee retirement benefits 2 705 440 (2 657) (104) (88) (75) (64)
Deferred income taxes (1 063) (14 463) 389 (270) (201) 0 0
Provision for uncollectible accounts 1 420 1 167 980 724 534 395 292
Equity in losses of unconsolidated businesses, net of dividends received 138 117 231 162 162 162 162
Net gain on sale of divested businesses (1 007) (1 774) 0 (927) (927) (927) (927)
Oath goodwill impairment 0 0 4 591 0 0 0 0
Changes in current assets and liabilities,
net of effects from acquisition/disposition of businesses
Accounts receivable (5 067) (5 674) (2 667) (1 428) (1 940) (2 149) (2 395)
Inventories 61 168 (324) 304 (46) (51) (57)
Prepaid expenses and other (660) 27 37 1 337 72 59 45
Accounts payable and accrued liabilities and Other current liabilities (1 089) (459) 1 777 (1 543) (2 041) (2 275) (2 549)
Discretionary employee benefits contributions (186) (3 411) (1 679) (1 331) (1 136) (969) (827)
Other, net (3 099) 676 219 (735) (735) (735) (735)
Cash Flow from Operating Activities 21 689 24 318 34 339 31098 30445 31919 33159
Capital expenditures (including capitalized software) (17 059) (17 247) (16 658) (18 825) (19 347) (19 945) (20 637)
Acquisitions of businesses, net of cash acquired (3 765) (5 880) (230) (3 292) (3 292) (3 292) (3 292)
Acquisitions of wireless licenses (534) (583) (1 429) (2 694) (2 771) (2 851) (2 932)
Proceeds from dispositions of businesses 9 882 3 614 0 4 499 4 499 4 499 4 499
Other, net 1 602 1 640 383 1 208 1 208 1 208 1 208
Cash Flow from Investing activities (9 874) (18 456) (17 934) (19 104) (19 703) (20 380) (21 154)
Proceeds from long-term borrowings 12 964 27 707 5 967 15 086 15 240 15 396 15 554
Proceeds from asset-backed long-term borrowings 4 986 4 290 4 810 5 293 5 526 5 787 6080
Repayments of long-term borrowings and capital lease obligations (19 159) (23 837) (10 923) (17 724) (17 971) (18 214) (18 472)
Repayments of asset-backed long-term borrowings 0 (400) (3 635) (1 350) (1 363) (1 377) (1 391)
Dividends paid (9 262) (9 472) (9 772) (10 225) (10 699) (11 196) (11 715)
Other, net (2 905) (4 439) (1 824) (3 056) (3 056) (3 056) (3 056)
Cash Flow from Financing Activities (13 376) (6 151) (15 377) (11 977) (12 323) (12 659) (13 001)
Increase/decrease in cash, cash equivalents and restricted cash -1 561 -289 1 028 17 -1 581 -1 121 -995
Cash, cash equivalents and restricted cash, beginning of period 4738 3 177 2 888 3 916 3 933 2 352 1 232
Cash, cash equivalents and restricted cash, end of period 3 177 2 888 3 916 3 933 2 352 1 232 237
2016 2017 2018 2019F 2020F 2021F 2022F
Service Revenue 66 580 63 121 63 020 60 687 58 412 56 195 54 033
Wireless equipment revenues 17 515 18 889 22 258 24 322 26 530 28 884 31 382
Other Wireless 5 091 5 501 6 456 7 399 8 479 9 715 11 129
Total Wireless Revenues 89 186 87 511 91 734 92 408 93 421 94 794 96 544
Consumer Markets 12 751 12 777 12 589 12 911 13 131 13 264 13 319
Enterprise Solutions 9 164 9 167 8 840 9 090 9 266 9 376 9 429
Partner Solutions 4 927 4 917 4 692 4 824 4 917 4 976 5 004
Business Markets 3 356 3 585 3 397 3 482 3 541 3 577 3 592
Other Wireline 312 234 242 387 433 484 542
Total Wireline Revenues 30 510 30 680 29 760 30 694 31 289 31 677 31 886
Corporate and Other 7 778 9 387 10 942 12 980 15 398 18 266 21 668
Eliminations (1 494) (1 544) (1 573) (1 614) (1 915) (2 271) (2 694)
Total Revenues 125 980 126 034 130 863 134 467 138 193 142 465 147 404