M
ASTER OF
S
CIENCE IN
FINANCE
M
ASTERS
F
INAL
W
ORK
PROJECT
EQUITY RESEARCH
:
LafargeHolcim, Ltd in the
aftermath of a mega merger
AUTHOR
GONÇALO FERNANDO ARAÚJO DA SILVA
M
ASTER OF
S
CIENCE IN
FINANCE
M
ASTERS
F
INAL
W
ORK
PROJECT
EQUITY RESEARCH:
LafargeHolcim, Ltd in the
aftermath of a mega merger
AUTHOR
GONÇALO FERNANDO ARAÚJO DA SILVA
SUPERVISOR
VICTOR MAURÍLIO SILVA BARROS
iii
Acknowledgements
Being this the last stage of my Master’s degree, I would like to present my sincere
gratefulness to several people that have always help me during this long journey.
First, to my Professor Victor Barros for his supervision and for always being available
for giving me valuable insights, guidance and support during these last months.
Second, to my girlfriend, Emília Rocha, for all the help and motivation and for always
being at my side in the worst and best moments since the beginning of this master.
Third, to all my family and especially my mother, Bernardete Araújo for her
iv
Index
Abstract... v
Resumo ... vi
Disclosure ... vii
Index of Figures ... viii
Index of Tables ... ix
1. Research Snapshot ... 1
2. Business Description ... 2
3. Management and Corporate Governance ... 6
4. Industry Overview and Competitive Position ... 7
5. Investment Summary ... 13
6. Valuation ... 14
7. Financial Analysis ... 17
8. Investment Risks ... 18
Appendix A: Statement of Financial Position ... 22
Appendix B: Income Statement ... 24
Appendix C: Cash Flow Statement ... 26
Appendix D: Key Financial Ratios ... 27
Appendix E: Forecasting Assumptions ... 28
Appendix F: Sales and Costs Breakdown Structure ... 31
Appendix G: LHN Post Merger Global Portfolio ... 33
Appendix H: Cement Market and Future Prospects ... 35
Appendix I: Global Cement Trading ... 36
Appendix J: Aggregates Market and Future Prospects ... 37
Appendix K: Valuation Methodologies ... 38
Appendix L: Discounted Cash Flow Assumptions ... 40
Appendix M: Discounted Cash Flow Analysis ... 41
Appendix N: Dividend Discount Model Analysis ... 42
Appendix O: Comparable Companies ... 43
Appendix P: Multiples Valuation ... 45
Appendix Q: DuPont Identity ... 46
v
Abstract
This work aims to present a company valuation of LafargeHolcim, Ltd elaborated in
agreement with ISEG’s Finance Master’s Work Project. This Equity Research follows
the format recommended by the CFA Institute (Pinto, Henry, Robinson, & Stowe,
2010). We choose LafargeHolcim, Ltd because it came from a merger operation of
two leading companies in the sector, thus presenting additional challenges in the
valuation approach. In addition, the author has previous knowledge and interest in this
industry. This Equity Research is issued considering all the public available
information on the company as of October 1
st, 2016, and therefore any event or
circumstance after this date is not considered in our work. We use the Discounted
Cash Flow method to achieve our final target price. The assumptions considered in
the valuation result from a careful analysis of the company’s data, industry main
drivers and futures market prospects from several sources. Our price target is CHF
59.80 for 2016YE, although subject to inherent risks that need to be considered. Thus,
the final recommendation stands for HOLD, with an upside potential of 13.9% from
vi
Resumo
Este trabalho pretende apresentar uma avaliação da empresa LafargeHolcim, Ltd
elaborado de acordo com o Projeto de Trabalho Final do Programa de Mestrado em
Finanças do ISEG. Esta avaliação segue o formato recomendado pelo CFA Institute
(Pinto, Henry, Robinson, & Stowe, 2010). A escolha da LafargeHolcim, Ltd deriva da
operação de fusão das duas anteriores maiores empresas do setor, adicionando
dessa forma maiores desafios para a avaliação. Adicionalmente, o autor também já
tem conhecimento prévio e interesse pelo setor. Esta avaliação é emitida
considerando toda a informação publicamente disponível até 1 de Outubro de 2016,
e por isso, qualquer evento ou circunstância ocorrida depois desta data não é
considerada no trabalho. A principal metodologia utilizada para aferir o preço-alvo é
através dos Fluxos de Caixa Descontados (DCF). Na avaliação consideramos várias
premissas que resultaram de uma análise cuidada dos dados históricos da empresa,
dos principais determinantes da indústria e perspetivas futuras de mercado de
diversas fontes. O preço-alvo final é de CHF 59.80 para FA2016, contudo com alguns
riscos a considerar. Assim, a recomendação final é de MANTER, com um potencial
vii
Disclosure
In our valuation, we used publicly available information as of October 1
st, 2016.
However, information regarding historical cement market as well as future prospects
for cement and aggregates are taken from specific databases and industry studies
that are only available by the payment of a fee.
The specific database used is CemNet.com which is one of the main sources of
information for the industry, delivering information about historical and future demand
and supply of cement, exports/imports volumes, updated news, among other
publications.
We use the following studies: “Global Cement” published in August 2015 and “World
Construction Aggregates” published in March 2016, both from The Freedonia Group.
This company conducts market research for several industries that are used by
companies as well as the general public. We use information from these surveys, and
thus the development of the mosaic theory under this equity research includes both
viii
Index of Figures
Figure 1 - LHN worldwide presence ... 2
Figure 2 - Lafarge/Holcim financial data ... 2
Figure 3 - Lafarge/Holcim sales by region ... 2
Figure 4 - LHN financial data (FY2015) ... 3
Figure 5 - LHN sales by region (FY2015) ... 3
Figure 6 - LHN % sales and EBITDA margin by product (FY2015) ... 3
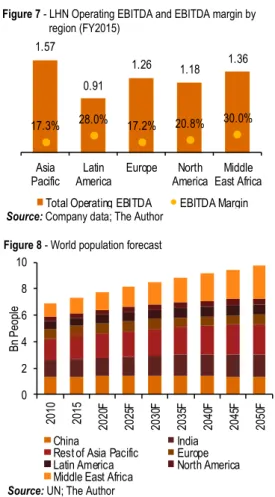
Figure 7 - LHN Operating EBITDA and EBITDA margin by region (FY2015) ... 4
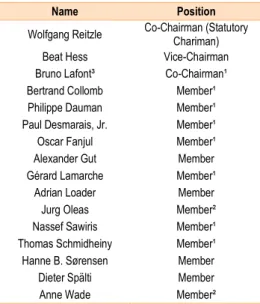
Figure 8 - World population forecast ... 4
Figure 9 - World population living in urban areas ... 4
Figure 10 - Forecast demand for "green cement" ... 4
Figure 11 - Weight of Lafarge and Holcim shareholders in total LHN capital ... 5
Figure 12 - LHN current shareholder structure ... 5
Figure 13 - World GDP forecasts ... 7
Figure 14 - Energy prices forecast ... 7
Figure 15 - Historical and forecast cement prices ... 8
Figure 16 - World cement demand and production ... 9
Figure 17 - Europe cement market prospects ... 9
Figure 18 - North America and USA cement market prospects ... 9
Figure 19 - China cement market prospects ... 9
Figure 20 - India and Rest of Asia-Pacific cement market prospects ... 10
Figure 21 - Latin America and Middle East Africa cement market prospects ... 10
Figure 22 - Historical utilization rates by region ... 10
Figure 23 - World cement trading volumes - 2014 ... 11
Figure 24 - World aggregates demand by regions ... 11
Figure 25 - Extended Porter's five forces ... 12
Figure 26 - LHN vs market index cumulative returns ... 13
Figure 27 - Cement forecasted sales ... 14
Figure 28 - Aggregates and ready-mix forecasted sales ... 14
Figure 29 - LHN Estimated cost structure ... 14
Figure 30 - Present value forecasted synergies ... 14
Figure 31 - LHN Capital expenditures ... 15
Figure 32 - LHN Debt evolution ... 15
Figure 33 - LHN capital structure evolution ... 15
Figure 34 - Forecasted dividend payout ratios ... 16
Figure 35 - Net profit breakdown - 2016F ... 17
Figure 36 - EBITDA, EBIT and Net Income evolution ... 17
Figure 37 - Capital structure ... 17
Figure 38 - Forecasted earnings per share ... 17
Figure 39 - LHN Risk matrix ... 18
Figure 40 - Historical exchange rates ... 18
Figure 41 - Historical 10-year yields ... 18
Figure 42 - LHN Price sensitivity distribution ... 21
ix
Index of Tables
Table 1 - Lafarge/Holcim production capacities – YE2014 ... 2
Table 2 - LHN production capacity (YE2015) ... 3
Table 3 - LHN Expected merger synergies ... 5
Table 4 - LHN Debt rating ... 5
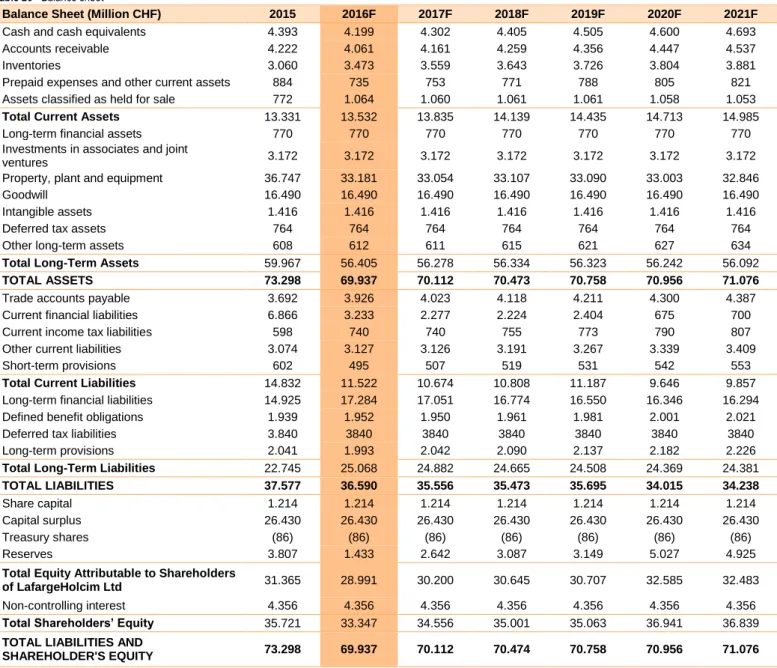
Table 5 - LHN Board members ... 6
Table 6 - LHN Executive Committee ... 6
Table 7- LHN 2015 management compensation ... 6
Table 8 - Cement industry key metrics ... 7
Table 9 - Cement industry concentration rate (YE2015) ... 8
Table 10 - CRH market position after acquisition of LHN assets (YE2015) ... 8
Table 11 - SWOT analysis ... 12
Table 12 - LHN market segmentation analysis... 12
Table 13 - Target price by method ... 13
Table 14 - DCF Valuation ... 13
Table 15 - WACC assumptions ... 15
Table 16 - LHN cost of debt ... 16
Table 17 - Terminal growth rate ... 16
Table 18 - LHN’s peers ... 16
Table 19 - Risk classification ... 19
Table 20 - Sensitivity analysis: Terminal growth rate vs WACC ... 19
Table 21 - Sensitivity analysis: MRP vs Beta ... 20
Table 22 - Sensitivity analysis: synergies; energy expenses and raw materials expenses .. 20
Table 23 - Sensitivity analysis: sales growth ... 21
Table 24 - Sensitivity analysis: discount sales rate ... 21
Table 25 - Monte Carlo statistics ... 21
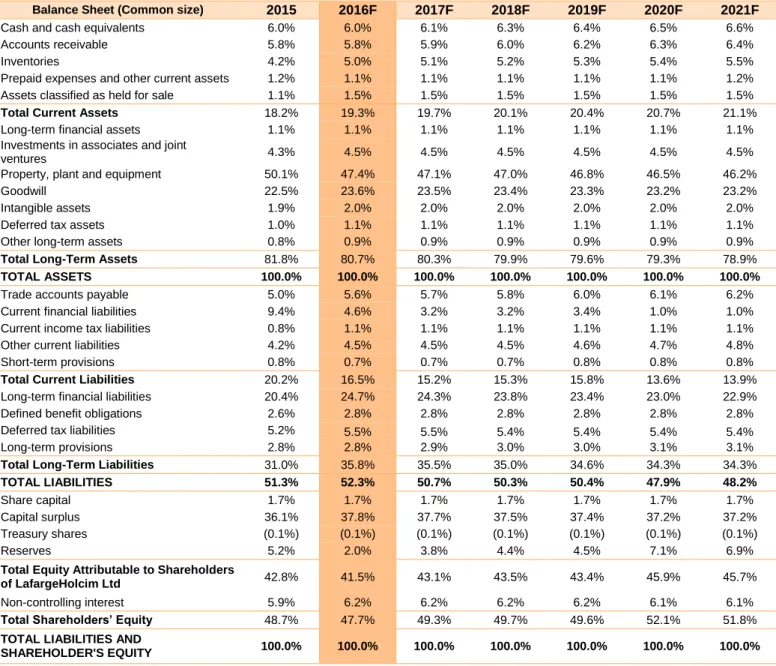
Table 26 - Balance sheet ... 22
Table 27 - Balance sheet - common size ... 23
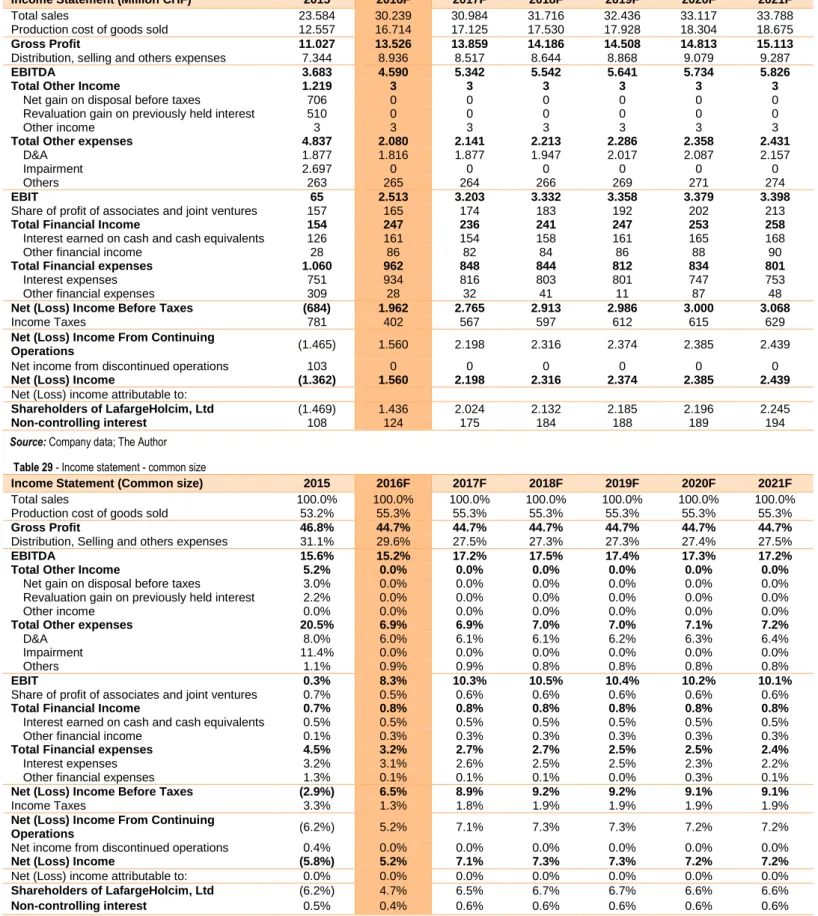
Table 28 - Income statement ... 24
Table 29 - Income statement - common size ... 24
Table 30 - LafargeHolcim Pro Forma Statement of Income for year ended December 31,
2015 ... 25
Table 31 - Cash flow statement ... 26
Table 32 - Key financial ratios ... 27
Table 33 - Income statement assumptions ... 28
Table 34 - Balance sheet assumptions - Assets ... 29
Table 35 - Balance sheet assumptions - Liabilities and Equity ... 30
Table 36 - Forecast cement growth: sector vs LHN ... 31
Table 37 - Detailed LHN sales by region... 31
Table 38 - LHN Detailed cost structure ... 31
Table 39 - LHN Detailed costs ... 31
Table 40 - LHN Detailed sales in volumes and utilization rates ... 32
Table 41 - LHN Ongoing investment projects ... 32
Table 42 - Pre and Post Merger global production facilities ... 33
Table 43 - LHN main divestments assets ... 34
Table 44 - Detailed cement demand, production and utilization rates ... 35
Table 45 - Historical cement trading volumes ... 36
Table 46 - Lafarge/Holcim Cement terminals - 2014 ... 36
x
Table 48 - WACC assumptions ... 40
Table 49 - Detailed LHN Capex ... 40
Table 50 - LHN Loans schedule ... 40
Table 51 - LHN Loans payments schedule ... 40
Table 52 - DCF analysis ... 41
Table 53 - FCFF ... 41
Table 54 - LHN Forecasted EV ... 41
Table 55 - DCF price target ... 41
Table 56 - Three Stage DDM assumptions ... 42
Table 57 - Total dividends paid ... 42
Table 58 - Three Stage DDM price target ... 42
Table 59 - Peers: Initial sample ... 43
Table 60 - Peers: Non-traded/state owned ... 43
Table 61 - Peers: Similar business structure ... 44
Table 62 - Peers: International diversification ... 44
Table 63 - Final peers selection ... 44
Table 64 - Peers multiples 2016F ... 45
Table 65 - LHN price target - Multiples ... 45
1 1. Research Snapshot 20,0 30,0 40,0 50,0 60,0 70,0 80,0
Jul-15 Sep-15 Nov-15 Jan-16 Mar-16 May-16 Jul-16 Sep-16
St oc k Pric e (C HF ) 13.9% upside potential Closing Price (30/09/2016) DCF’s YE2016 Target Price
Our risk assessment derives from the mature nature of LHN business, high barriers for new entrants, limited local competition as well as globally diversified sales.
Analyst’s Risk Assessment
Source: Thomson Reuters; GFS analysis
Source: GFS analysis Source: GFS analysis
Source: GFS analysis
Source: GFS analysis
1. Research Snapshot
(2016YE Price Target of CHF 59.80; 13.9% Upside Potential; Medium Risk; Final Recommendation: HOLD)
Our final recommendation for LafargeHolcim, Ltd stands for HOLD with a YE2016 target price of CHF 59.80 and an upside potential of 13.9% in comparison with the last closing price of CHF 52.50 on September 30th, 2016.
The target price is computed using the DCF approach as the main model. To corroborate this recommendation, we use two other methodologies – the DDM and the Market Approach. The DDM is in line with the DCF recommendation. On the other hand, the Market Approach recommends to Reduce. In our opinion, the latter model’s downside potential arises from differences in size, global capacity and footprint between LHN and its closest competitors. Consequently, in our view, this model represents the least reliable price estimation.
We expect LHN’s sales to grow at 1.97% CAGR between 2016F-2021F, from CHF 29.483 million to CHF 33.788 million. We base our forecasts on industry studies for future demand, current and future cement pricing patterns and rising competition. The exposure of LHN on emerging markets like Asia Pacific will be key drivers for this growth, while it enables the firm to spread the risk of the current fragile European market. Although the company presented a decrease in its total sales by 2016Q2 (-1.1% on a YoY basis), in our view the actions taken by management (e.g. increase cement prices) will start reflecting positive trends in total net sales over the next months. One should highlight that this negative growth is due to the market decline in Brazil, production shortages in Nigeria and weaker cement prices.
Net income should return to positive values of CHF 1.560 million in 2016F after the 2015 year loss, heavily impacted by one-offs from the merger operation costs. LHN’s EBITDA margin is expected to reach 15.2% in 2016F and 17.2% in 2021F, with this grow being sustained by the successful achievement of targeted synergies. Thus, we predict present value of accumulated synergies to reach CHF 4.973 million over the valuation period.
We project net capex to be negative in CHF -1.750 million in 2016F as LHN continues its divestment plan of CHF 3.000 million. Debt restructuring is also one of the main challenges since the company intends to extend its short-term liabilities to longer maturities.
LafargeHolcim
HOLD Medium Risk October 2016 SIX SWISS ExchangeLow Medium High
Market Profile
Closing Price (CHF) 52.50
52-week price range (CHF) 33.29 - 58.30
90 Days average daily volume
(Million) 1.76
Volume as percent of shares
outstanding 0.290%
Shares outstanding (Million) 606.91
Market Capitalization (Bn CHF) 32.041 BV per share 1.670 Free Float 68.08% Institutional Ownership 31.19% Insider Ownership 25.58% Dividend yield 3.17% ROE 3.20% D/E 0.695 P/CF 7.40 P/E 18.31 P/BV 0.96
Valuation Target Price YE2016 Upside/Downside Potential
DCF 59.80 13.9% DDM 58.41 11.3% Multiples 50.98 -2.9% Key Drivers (Bn CHF) 2015 2016F 2021F Total Sales 23.58 30.24 33.79 EBITDA 3.68 4.59 5.83 Net Income -1.36 1.56 2.44 Net Debt 17.40 16.32 12.30 EBITDA/Interest Exp. 4.90 4.91 7.74 Total Assets 73.3 69.9 71.1 Total Liabilities 37.6 36.6 34.2 Total Equity 35.7 33.3 36.8
Change in Sales Growth by Geography (2016F-2021F) -3% -2% -1% 0% 1% 2% 3%
Asia Pacific 52.4 54.9 57.3 59.8 62.3 64.7 67.2
Latin America 57.2 58.0 58.9 59.8 60.7 61.6 62.4
Europe 54.0 56.0 57.9 59.8 61.7 63.6 65.6
North America 55.3 56.8 58.3 59.8 61.3 62.8 64.3
Middle East Africa 56.0 57.3 58.5 59.8 61.1 62.3 63.6
Change in Target Synergies (2016F-2021F)
55% 70% 85% 100% 115% 130% 145% Price Target 47.1 51.3 55.6 59.8 64.1 68.3 72.5 0 1000 2000 3000 4000 5000 6000 7000 8000 41.28 50.79 60.29 69.79 79.30 Frequenc y FCFF Mean (CHF) 60.29 DCF (CHF): 59.80 Current (CHF): 52.50
Notes: The annualized upside potential is 68%. However even with this annual potential,
the short term potential (13.9%) does not justifies a BUY recommendation. Moreover, one of our valuation methodologies points for a Reduce recommendation.
2
2. Business Description
Source: Company data
Source: Companies data; The Author
Figure 1 - LHN worldwide presence
Figure 2 - Lafarge/Holcim financial data
Table 1 - Lafarge/Holcim production capacities – YE2014
15.5 3.3 13.8 19.1 2.3 11.8 0 5 10 15 20 25
Revenue EBITDA Financial Debt
Bn C HF Lafarge Holcim 17% 6% 25% 23% 29% 35% 15% 28% 17% 4% Asia Pacific Latin America Europe North America Middle East Africa Lafarge Holcim
2. Business Description
LafargeHolcim, Ltd (LHN) was founded on July 10th, 2015 as a result of a
mega-merger between the two main players in the construction materials industry: Lafarge
(French) and Holcim (Switzerland). The company headquarter is in Switzerland
and since July 14th, 2015 is listed in the Zurich and Paris stock exchanges. By
FY2015, LHN had operations in 90 countries, a working force of 100.000 employees
and CHF 29.483 and 4.555 million of net sales and operating EBITDA1
respectively.
The original exchange offer was announced on April 7th, 2014 by both companies in
which they agreed to swap 1 Holcim share for 1 Lafarge share. This agreement was approved unanimously by their respective Board of Directors and supported by core shareholders. However, after the announcing deal, both companies’ presented a divergence path in the stock market (Holcim showed a robust growth while Lafarge missed market expectations) leading to a new arrangement by both Boards to reflect the new financial performance. This new plan was set on March 20th, 2015 with a
new trading offer of 9 Holcim shares for 10 Lafarge shares. This latest agreement
indicated that the final operation was more of an absorption of Lafarge into Holcim. By May 8th of the same year, Holcim shareholders approved a wide range of
resolutions which included a capital increase for the exchange offer, the change of the company name from Holcim, Ltd to LafargeHolcim, Ltd, the appointment of new members of the Board and the new compensation systems for the Board and the Executive Management.
Lafarge and Holcim Background: Global leaders in the cement industry Lafarge was founded in 1833 by Joseph-Auguste Pavin de Lafarge in the Ardèche
region – France, where its operations started by exploiting several limestone quarries. The company was publicly traded in the Paris Stock Exchange since 1923 and by FY2014 it was the world largest producer of cement with consolidated sales of EUR 12.000 million, 63.000 employees and presence in 61 countries from all continents.
The firm started its international growth in 1864 when it won a contract to supply hydraulic lime for the Suez Canal in Egypt and soon after, it started developing operations in other African Mediterranean countries like Tunisia and Algeria. By the end of WWII, the company was the leader in cement production in France and North Africa.
In 1956, Lafarge expanded to the American continent, building its first cement factory in Western Canada, followed by a second one in Quebec in 1960. In the subsequent years, the company continued its growth through mergers and acquisitions in several markets like Brazil, USA, sub-Saharan Africa, China, and India. Before the merger, the biggest acquisition occurred in 2008 when Lafarge bought Orascom Cement for EUR 8.800 million. This was one of the key players in the Middle East market, which put Lafarge in a leading position in several African countries, where it already had operations (e.g. Egypt) and enabled to enter on other fast-growing countries like the United Arab Emirates.
Over the years, Lafarge main products included cement, aggregates, and ready-mix concrete. The company also had other non-core activities like the production of gypsum and roofing products but in the 2007-2011 period, it sold these business lines. The total amount of disposal assets reached EUR 3.892 million and enable the company to reduce its debt levels in a time were cement demand decreased sharply (mature markets).
Holcim, on the other hand, was established in 1912 as “Aargauische Portlandcementfabrik Holderbank-Wildegg” in 1912 in Holderbank, Switzerland. By FY2014, it was the second largest producer of cement and a key player in the aggregates and ready-mix concrete industry. The company had total consolidated sales of CHF 19.100 million (EUR 15.700 million), operations in around 70 countries from all continents and employed approximately 68.000 workers. Holcim became publicly traded on the Swiss Stock Exchange in 1981.
Since the beginning, Holcim’s main goal was the production and distribution of cement. A few years after its establishment, in 1923, the company started to expand its operation through other European and African countries (e.g. Belgium, Germany, Netherlands, Egypt, Lebanon and South Africa). After the WWII, the firm starts
1On a Pro Forma Basis, which reflects a hypothetical situation of the merger if it had occurred
on January 1st, 2015. In practical terms, this means that Lafarge sales between January 1st and
July 10th, 2015 are added to the initial income statement of LHN.
Production Capacities Lafarge Holcim Cement (Mt) 215 211
Asia Pacific 77 96
Latin America 7 35
Europe 55 47
North America 17 22
Africa Middle East 59 11
Aggregates (facilities) 437 363
Asia Pacific 7 72
Latin America 4 12
Europe 250 188
North America 142 86
Africa Middle East 34 5
Ready-Mix Concrete (facilities) 1,016 935 Asia Pacific 95 290 Latin America 63 109 Europe 475 373 North America 186 148
Africa Middle East 197 15
Source: Companies data; The Author
Source: Companies data; The Author
3
2. Business Description
Source: Company data; The Author
Source: Company data; The Author
Table 2 - LHN production capacity (YE2015)
Figure 4 - LHN financial data (FY2015)
Figure 5 - LHN sales by region (FY2015)
29.48 5.18 21.79 0 5 10 15 20 25 30 35
Total Net Sales Operating
EBITDA Financial Debt
Bn C HF 31% 11% 25% 19% 15%
Asia Pacific Latin America
Europe North America
Middle East Africa
67.4% 13.7% 18.9% 22.8% 14.4% 0.8% Cement Aggregates RMX
Sales EBITDA Margin
operating on the American continent and by the 70’s, Holcim turned its focus to the Asia Pacific region.
One of the most important acquisitions occurred between 2005 and 2006, where the company entered in the Indian cement market by making an alliance with the “Gujarat Ambuja Cements” (GACL) to acquire a 67% stake in “Ambuja Cement India” (ACIL) in a CHF 808 million deal. At the deal moment, this company had a 13.8% participation in the share capital of “The Associated Cement Companies” (ACC) which was the second largest cement group in that market. By 2008, Holcim increased its share capital on Huaxin Cement Co (China) from 26.1% to 39.9% in an investment of USD 282 million and in the next year the firm bought all assets from Cemex Australia for a total amount of CHF 1.770 million. These assets included cement, grinding plants, several aggregates, and ready-mix concrete production sites.
LHN Business Segments: Developing cohesive solutions
The company business is organized by countries that are grouped in regional clusters. These clusters comprise the following five operating segments: i) Asia
Pacific; ii) Latin America; iii) Europe; iv) North America and v) Middle East Africa.
Sales come from the following group’s product lines:
- Cement (which comprises clinker and other cementitious materials): LHN provides a wide range of cement types for infrastructures, roads and also for selling through distributors and retailers. It produces masonry cement and mortars, high-level cement with different types of resistance, low CO2 emissions and other specific cement for industries like oil and gas.
- Aggregates: This product line consists in the production of natural and alternative aggregates that are mostly used to produce ready-mix concrete, asphalt as well as other specific applications like ballast for railways, decorative solutions, and urban drainage systems. Alternative aggregates consist in recycled concrete and secondary aggregates from industrial waste, such as mining, slag, and ash. - Ready-mix concrete (which comprises concrete products, asphalt, constructions
and paving, trading and others): The company produces a variety of ready-mix concrete products like self-consolidating, high strength, decorative as well as permeable and insulating concretes. It also produces asphalt solutions and prefabricated concrete products for housing, buildings, and other infrastructure applications.
By YE2015, LHN had a total cement production capacity2 of around 374 Mt spread
by 239 cement and grinding plants. It also had 661 aggregates production plants and 1577 ready-mix concrete production facilities.
In our valuation approach, we keep the same five operating segments. We forecast LHN sales for each of those regions and specify total revenues for each product line. More details on section 6 – Valuation.
Post-Merger Strategy to Meet the Future Construction Needs
As we saw, the historical growth strategy of both companies was similar. Their expansion was mostly due to acquisitions and mergers programs as well as establishing local partnerships. They had established operations in a wide range of geographies to smooth cyclical fluctuations in individual markets and stabilizing earnings. Generally, both maintained in the overall years a clear focus on their initial product and pursued the development of other very important complementary products like aggregates and ready-mix concrete, emerging as a vigorous vertical integrated building materials supplier.
Hence, the merger rationale was fundamental to improve operational efficiencies and growth market power to increase prices. With well-balanced revenues between mature versus emerging markets and the current cement capacity, the need for large acquisitions and heavy investments in the short/medium term is not expected to happen. Moreover, LHN expects to have more negotiation power to ensure better deals with its suppliers by concentrating its global purchases in one single entity. As so, LHN long term strategy is set to:
i) Quickly track new trends in the construction sector; and ii) Deliver synergies by improving performance/asset optimization.
At the same time, LHN will continue to maintain its efforts on the core business, preserving a global footprint to minimize local risks. Investments in R&D will continue
2 The world’s highest by YE2015.
LHN Production Capacity 2015 % in Total Cement (Mt) 373.8 100%
India 68.2 18.2%
China 37.8 10.1%
Rest of Asia Pacific 55.6 14.9%
Latin America 40 10.6%
Europe 78 20.8%
North America 32 8.6%
Middle East Africa 63 16.7%
Total Aggregates (Facilities) 661 Total Ready-Mix Concrete
(Facilities) 1.577
Source: Company data; The Author Source: Company data; The Author
4
2. Business Description
Source: UN; The Author
Source: UN; The Author
Figure 8 - World population forecast
1.57 0.91
1.26 1.18 1.36
17.3% 28.0% 17.2% 20.8% 30.0%
Asia
Pacific AmericaLatin Europe AmericaNorth East AfricaMiddle
Total Operating EBITDA EBITDA Margin
0 2 4 6 8 10 2010 2015 2020 F 202 5F 2030 F 2035 F 2040 F 2045 F 205 0F Bn Pe op le China India
Rest of Asia Pacific Europe
Latin America North America
Middle East Africa
20% 40% 60% 80% 100% 2010 2015 2020 F 20 25 F 20 30 F 20 35 F 20 40 F 20 45 F 20 50 F
World Developed regions
Emerging regions China
India 0 1 2 3 4 5 6 7 2010 2011 2012 2013 2014 2015 2016 2017 2018 2019 2020 Bn t
Total Cemend Demand Green Cement Demand
to be essential as the new company intends to face demand set by new tendencies in the construction industry.
The construction industry currently faces the following key challenges:
i) Population growth and urbanization: World population is expected to continue
its growing from almost 7.500 million to around 9.700 million individuals in 2050 according to the 2015 Revision of World Population Prospects from the United Nations (UN). From this growth, nearly 87% come from emerging and less developed countries. At the same time, cities will continue to expand as more people start living in urban areas. According to Lafarge 2014 Annual Report, the number of megalopolises3 will increase from current 28 to around 40 in 2025,
mainly located in Asia – Figures 8 and 9.
ii) Environmental friendly solutions: Demand for greener and more efficient
products are predictable to raise over the next years as environmental concerns become an important aspect in the industry and in its costumers. According to a industry study, “green cement” (low carbon cement) market share over total cement consumption is expected to grow from 3.5% in 2010 to 13% in 2020 – Figure 10. LHN has already a variety of cement and concrete products that aim to have higher durability and to efficiency. Another example is recycled aggregates that due to increasing urbanization, are forcing quarries to become more distant from their point of use, leading to an increase in costs of materials. Hence, the group already has numerous operations of aggregates recycling facilities (in mature and emerging markets) where natural sand and rock deposits are scarce and extraction is subject to strict regulations.
iii) Innovation and affordable solutions: Construction industry is divided into two
segments: building (residential and non-residential) and infrastructure. The latter segment accounts for 32% of the global cement market, while the former stands for 34% each. Due to the combination of a growing population and rising per capita income in developing regions, buildings and infrastructures demand will continue to increase. Hence, one of the main challenges is to keep the basic price of materials affordable and accessible. In contrast, energy efficiency and more aesthetically materialsbecoming an important criteria for more mature regions. For these reasons, it is important to LHN maintain a strong R&D attention and to be able to continue an innovative path. Following the merger, LHN brought together both companies’ innovation teams to its main laboratory located in France and complemented by several Construction Development Labs (CDL) placed in local markets to serve specific needs. Today, LHN has the largest and most diversified patent portfolio in the industry4 with about 160 active patent groups, representing
approximately 1.750 granted national patents.
Some of the innovation examples are in the improving and manufacturing process. LHN is currently working on a new type of cement and concrete technology that could reduce CO2 emissions up to 70%. Another example was when LHN launch a new lightweight slurry cement specific for the oil and gas industry. Thus, the ability to secure its intellectual property and patent management is a crucial factor to LHN continuous innovation and ability to win important supply contracts for construction projects around the world.
Rebalancing Global Portfolio and Delivering Synergies
To rebalance LHN’s assets network and to meet requirements from different antitrust authorities, the new company had to sell several operations around the world, especially in more mature markets – Europe and North America – where existed higher market overlap. All these selling operations had been conducted by a Divestment Committee set by both companies after the announcement of the merger deal.
The main divestment agreement was the “CRH Divestment Business” which consisted of selling numerous assets to one of the industry competitors – CRH – for a total amount of CHF 6.400 million. Those assets belonged to Lafarge and Holcim and were located in Europe, USA, the Philippines, Brazil, and on the Island of La Réunion. In emerging markets like most of the Asia Pacific and the Middle East Africa, there was little market overlap between both companies. Although some divestments had to be made, in the end, the higher presence of Holcim in Asia Pacific and Latin America against Lafarge in Middle East Africa enable LHN to complement and reinforce its positions in faster-growing markets in the cement industry. All these assets disposals have impacted LHN’s 2015 Annual Report. Net assets in connection with the operation were classified as held for sale in the consolidated statement of financial position (CHF 773 million) and as discontinued operations in the
3Metropolitan areas with more than 10 million inhabitants.
4 According to LHN 2015 Annual Report and Lafarge 2014 Annual Report.
Source: Company data; The Author
Source: Smithers Apex: The future of green cement to 2020; The Author
Figure 7 - LHN Operating EBITDA and EBITDA margin by
region (FY2015)
Figure 9 - World population living in urban areas
5
2. Business Description
Source: Company data; The Author
Source: Company data; Bloomberg
Table 3 - LHN Expected merger synergies
Table 4 - LHN Debt rating
11.4% 9.4% 4.8% 3.3% 3.0% 3.0% 65.1% Thomas Schmidheiny Groupe Bruxelles Lambert NNS Jersey Trust Dodge & Cox BlackRock, Inc. Harris Associates Investment Trust Free Float 45% 11.4% 9.4% 4.8% 29.4% Other Holcim Shareholders Thomas Schmidheiny Groupe Bruxelles Lambert NNS Jersey Trust Other Lafarge Shareholders consolidated statement of income (CHF 103 million) – Appendix G.
The new company expects significant synergies by implementing the best practices from both Holcim and Lafarge. The total expected cumulated synergies for the period 2016-2018 amounts to nearly CHF 1.700 million, both in operational and financial savings. According to 2016Q2 report, the company already achieved a total CHF 273 million in synergies and we are convinced that they are on track to meet their 2016 target of CHF 450 million.
The majority of synergies will come at the operational level (CHF 1.600 million). LHN expects savings in logistic and distribution channels as well as the elimination of duplicative functions in selling, distribution and administrative expenses (according to Holcim half-year 2015 results, the merger should result in a net reduction of administrative duplicative positions of 380 in Lafarge and 120 in Holcim in France and Switzerland). The company will also implement more centralized procurement for global suppliers to better negotiate future agreements. At the financial level, synergies are expected to reach CHF 490 million. These would come from more favorable financing rates (in 2016Q2, LHN issued bonds to refinance its short-term debt by a weighted average coupon rate of 2.64%,lower than the actual cost of debt stated in the company 2015 Annual Report), cash allocation and strict capital expenditures in new investments – Table 3.
Shareholder Structure
Before the merger, there were no major institutional shareholders with common positions5 on both companies. According to Holcim 2014 Annual Report, its major
institutional shareholders counted for 41.81% of total capital with Schweizerische Cement-Industrie-Gesellschaft (Thomas Schmidheiny6) holding 20.11%. The next
largest shareholder was Eurocement Holding AG7) with 10.82% of total capital. Other
important investors were Harris Associates L.P. (4.94%), Harbour International Fund (3.01%) and BlackRock (2.93%).
As for Lafarge, in the 2014 Annual Report, its main shareholders were Groupe Bruxelles Lambert8 (21.1%), NNS Holding Sàrl9 (13.9%) and Dodge & Cox (7.3%).
Other institutional stockholders counted for 47.5% of total share capital while individual investors held the remaining 10.2%.
Currently, LHN has about 607 million outstanding shares10, of which 73% are in free
float. Since July 1, 2016, institutional shareholders surpassing more than 3% of total capital counted for 34.92% of total LHN shares. Schweizerische Cement-Industrie-Gesellschaft and Groupe Bruxelles Lambert were the single largest holders with 11.38% and 9.43% of total capital respectively – Figure 12.
Dividend Policy and Shares
The new company declares and pays dividends in Swiss Francs, however, it also has the option to pay dividends in Euros for investors holding their shares through the Euronext Paris stock exchange. Since there is no guarantee that LHN will pay dividends in Euros, shareholders whose main currency is not the Swiss Franc may bear exchange rate risk. LHN set a dividend payout ratio of 50% of the group net income attributable to common shareholders plus additional excess cash from its FCF operations. Nevertheless, LHN only plans to make these payments after ensuring that its financial ratios are in agreement with the current financial investment grade – Table 4.
5 Holding more than 3% of total share capital.
6 From Holcim family founders.
7 Private owned Russian cement company. This company faced financial stress with the falling
of energy commodities prices and subsequently Russian financial crises. Its main lender – the Russian bank Sberbank – made a margin call on a loan to Eurocement, which was secured by a 6.12% stake in the new company (LHN). After this, the Russian bank sold its LHN shares to a group of international investors.
8 Second largest family holding in Europe. On March 31, 2016, it had an adjusted net asset of
EUR 14.800 million and market capitalization of EUR 11.700 million. In LHN they are represented by Jacqueline Desmarais, André Desmarais, Paul Desmarais Jr. and Albert Frère.
9 This company belongs to Mr. Nassef Sawaris and family and it was the major shareholder of
Orascom Cement when Lafarge decided to buy it. After selling its cement company, Mr. Nassef reinvested part of the money into Lafarge becoming the second largest institutional investor with 11.4%.
10 Each share represents one voting right.
Potential Synergies (Bn CHF)
Operational Synergies 1.20
Logistics, Distribution, IT and energy
consumption 0.24
Centralized procurement and
economies of scale 0.41
Synergies in Selling, general and
administrative expenses 0.30
Others synergies related with
innovations and services portfolio 0.24
Others synergies 0.01
Financial and Cash-Flow Synergies 0.49 More favorable financing rates and
synergies in cash allocation 0.24
Capital expenditure synergies 0.25
Total Target Synergies 1.69
Rating Agencies Rating Standard & Poor's
Long-term rating BBB, outlook stable
Short-term rating A-2
Moody's
Long-term rating Baa2, outlook negative
Short-term rating P-2
Fitch
Long-term rating BBB, outlook stable
Short-term rating F-3
Source: LHN data; Lafarge/Holcim data; The Author
Source: LHN data; Lafarge/Holcim data; The Author
Figure 11 - Weight of Lafarge and Holcim shareholders in total
LHN capital
6
3. Management and Corporate Governance
Source: Company data
Notes: ¹As of July 10, 2015; ²Until July 10, 2015; ³By Dec.
31, 2015 Bruno LaFont was the only Member with Call Options with a total of 448.208.
Source: Company data
Notes: ¹Excluding India, which is under direct responsibility
of the CEO.
Source: Company data; The Author
Table 5 - LHN Board members
Table 6 - LHN Executive Committee
Table 7- LHN 2015 management compensation
3. Management and Corporate Governance
LHN follows the “Swiss Code of Best Practice for Corporate Governance” that was introduced in 2002 and is targeted mainly for Swiss public limited firms. This code provides recommendations on designing the corporate governance and information that go beyond what is stipulated by law. Despite this, the code is flexible enough to allow businesses to apply their own ideas for structuring and organization into practice. However, if their corporate practices deviate from the specified recommendations, the company would need to provide a suitable explanation – “comply or explain principle”.
The management team is composed by the Board of Directors, Executive Committee, and three other Committees. The Board of Directors (Board) consists of 14 members, 13 of whom are independent11. Nine of these members were
reelected by the Annual Shareholders Meeting of May 8th, 2015, for one-year-term
extended until the completion of the next Annual Shareholder Meeting. The
Executive Committee is composed by 10 members, all of whom formally appointed
by the Board after the Exchange Offer. Additionally there are three Committees: i)
Nomination, Compensation, and Governance; ii) Finance & Audit and iii) Strategy & Sustainability whose main duties are to support the Board in
governance related matters, in conducting supervisory duties (especially financial and internal control) and to advise the Board for main strategic priorities (long-term strategy as well as sustainable and social responsibility).
In our opinion, LHN follows a strong corporate governance model. By employing the “Swiss Code” it ensures that shareholders afford several fundamental rights in particular: i) the appointment and removal of directors and statutory auditors; ii) the approval or rejection of the annual business report; iii) the setting of
dividends and iv) any amendment to the articles of association, including changes in the share capital. Among this, major institutional shareholders control
31.19% of total LHN capital and with the high number of independent members of the Board it is possible for small investors to have a reasonable participation in the company’s strategic decisions. Also, the existence of specialized committees helps to ensure that the Board takes more informative and better decisions regarding LHN most prominent issues.
Executive Compensation System
Holcim and Lafarge had different compensation policies before the merger. The annual incentives at Holcim were delivered in a mix of cash, shares, and stock options while in Lafarge these were entirely paid in cash. For long-term incentives, Lafarge used to provide a combination of stock options, performance shares, and cash, whereas Holcim didn’t have any of these types of benefits.
In the new system, benefits from both companies were harmonized and they will now be delivered half in cash and half in shares. They also agreed on a performance share12 plan, which rewards company performance over a 3-years period. The Board
has a fixed compensation while the Executive Committee has a fixed and variable compensation. This variable part is dependent on the achievement of individual and/or targeted goals of the company in relation to the market or any other benchmarks. These compensations must be approved by the Annual Shareholders Meeting in accordance with the Swiss Federal Council Ordinance against Excessive Compensation.
We consider that this new compensation system allowed a balanced transition in the sense that it manage to deliver payment benefits in several forms. Also, by using performance shares it allows management to concentrate on delivering short and long-term value to shareholders.
11 In agreement with the “Swiss Code”, independent members are non-executive members of
the Board who have never been a member of the executive Board or were members thereof more than three years ago, and who do not have comparatively minor business relations with the company.
12 All of these shares are subject to a three-year vesting period.
Name Position
Wolfgang Reitzle Co-Chairman (Statutory Chariman)
Beat Hess Vice-Chairman
Bruno Lafont³ Co-Chairman¹
Bertrand Collomb Member¹
Philippe Dauman Member¹
Paul Desmarais, Jr. Member¹
Oscar Fanjul Member¹
Alexander Gut Member
Gérard Lamarche Member¹
Adrian Loader Member
Jurg Oleas Member²
Nassef Sawiris Member¹
Thomas Schmidheiny Member¹
Hanne B. Sørensen Member
Dieter Spälti Member
Anne Wade Member²
Name Position Responsibility
Eric Olsen CEO
Ron Wirahadiraksa CFO
Urs Bleisch Member Performance and Cost
Alain Bourguingnon Member Region Head North America
Pascal Casanova Member Region Head Latin America
Jean-Jacques
Gauthier Member
Integration, Organization & Human Resources
Roland Köhler Member Region Head Europe
Gérard Kuperfarb Member Growth and Innovation
Saâd Sebbar Member Region Head Middle East Africa
Ian Thackwray Member Region Head Asia Pacific¹
Shares Held by Management Board of Directors 25.58% of which: Thomas Schmidheiny 11.38% Paul Desmarais Jr. 9.43% Nassef Sawiris 4.77% Executive Committee 0.08% Executive Compensation FY2015 (Million CHF)
Total Cash 3.817.361 # Shares 34.466 Shares Value 1.441.110 Pension contributions 73.823 Other 165.833 Total 2015 5.532.593
7
4. Industry Overview and Competitive Position
Source: Company data; Lafarge/Holcim; Peers; US Geological survey; European Commission;
Source: IMF
Figure 13 - World GDP forecasts
Table 8 - Cement industry key metrics
-4.0% -2.0% 0.0% 2.0% 4.0% 6.0% 8.0% 10.0% 12.0% 2009 2010 2011 2012 2013 2014 2015 2016 F 20 17 F 20 18 F 20 19 F 20 20 F 20 20 F World GDP growth Advance Economies Emerging Economies China 0 1 2 3 4 5 6 7 8 20 40 60 80 100 120 2010 2011 2012 2013 2014 2015 2016 F 2017 F 2018 F 201 9F 202 0F 2021 F USD per M illi on Bri tis h Therm al U nit s U SD M et ric T on
Crude Oil Coal
Natural Gas
4. Industry Overview and Competitive Position
Macroeconomic Summary
According to IMF latest forecast from the World Economic Outlook13, July 2016,
world GDP is expected to grow by 3.1% in 2016 and 3.4% in 2017. Advanced economies will maintain a modest grow of 1.8% for the next two years while emerging markets are projected to rise from 4.1% to 4.6% for the same time horizon. In the Euro area, growth is foreseen to be 1.6% for 2016 1.4% for 2017. Negative inflation, large debts overhangs in several countries and the Brexit are among the main concerns. For the USA, growth is anticipated to be higher (2.2% and 2.5% for 2016 and 2017, respectively). Lower oil prices and interest rates will support domestic demand USA, but further exchange rate appreciation could lead to a weaker export growth.
In China, growth is projected to slightly slow down from 6.6% this year to 6.2% in 2017. Services sector growth should become more robust as the economy continues to rebalance from investment to consumption. For India, GDP is expected to be 7.4% for the next two years, mostly driven by private consumption, which has benefited from lower energy prices and higher real incomes. In Latin America, the overall growth is expected to be negative (-0.4%) in 2016 and should turn to positive in 2017 (1.6%). In Brazil, output is expected to contract by -3.3% in 2016 and turning to positive values in 2017 (0.5%), while Mexico is predictable to continue to grow at 2.5% and 2.6% for the same time period. MENAP14 region has weakened
considerably because of further declines in oil prices and intensifying conflicts. The overall growth in the region is projected to be 3.4% and 3.3% in 2016 and 2017, respectively – Figure 13.
Cement Industry and its Main Drivers
The cement business is characterized by being a mature, high capital and energy intensive industry. It is also a cyclical industry as it depends largely on the economic growth of the country and in part on weather conditions15. Cement is basically a
powder binding substance that is largely used in the construction sector, and when mixed with other materials (aggregates) and water it can withstand a diversity of environmental conditions. According to PCA (Portland Cement Association, USA), about 75% of total cement production is used to produce ready-mix concrete for construction sites. The remaining 25% are used for making concrete products, paving roads, extracting oil16 and others – Table 8.
Cement is considered a homogeneous product with few different types and classes, which can be interchanged easily from different producers. It is a heavy material with low value in relation to its weight, making it economically unviable for land transportation in a ratio greater than 200-300Km. The percentage of internationally traded cement on total cement production has been stable over the years with an average rate of 5% to 7%, meaning that most of the production exist to satisfy local consumption – Table 8.
The manufactory process requires high energy consumption with fuel costs accounting nearly 30% of the price when cement is sold. According to our estimates, the two highest’s production costs are energy and raw materials extraction counting for around 65% to 70% of total COGS17 . The main energy sources used are coal,
coke/petro coke, heavy fuel oil, natural gas and more recently alternative fuels like waste and biomass. Nevertheless, it is usual for cement producers to apply a fuel-mix strategy, combining several sources to reduce overall costs (oil and coal have big prices fluctuations) and decrease CO2 emissions – Table 8.
Because cement production causes negative environmental impacts, strict regulatory policies play an important factor in the industry (mainly in mature markets). Only the key ingredient of cement – clinker – was responsible for nearly 4.1% of total global CO2 emissions in 201418. Other environmental effects account for solid
wastes from the production process and mining activities like the dust, noise, and destruction of large vegetation areas that impact local ecosystem.
In mature markets like Europe, this industry falls within the scope of several
13 In the aftermath of the U.K. referendum.
14 Middle East, North Africa, Afghanistan and Pakistan.
15 Poor weather conditions can affect a construction project in several ways. For instance,
ready-mix concrete does not set below a certain temperature or if temperatures are too high they can cause the water in concrete to evaporate too fast.
16 A special type of cement called “oil-well” used for oil extraction that can withstand
high-pressure levels.
17 Computed with historical information from Lafarge, Holcim, LHN (in 2015) and its peers.
18 According to “Trends in Global CO2 Emissions” 2015 Report from PBL Netherlands
Environmental Assessment Agency.
Metric Values/Comment Main COGS Energy 34% Raw Materials 38% Average Plant Cost Around 150M EUR per Mt of annual capacity Land transportation Maximum 200-300Km ratio Energy Consumption 60-130Kg per Ton of cement Electricity Consumption ~110KWh per Ton of cement Main Fuel Sources ~ 41.7% Petcoke and Fuel Oil ~ 34.6% Coal and Petcoal ~ 5.8% Natural Gas and Others ~ 17.9% Alternative Fuels
Top End Users
~72% for ready-mix concrete ~13% for concrete products
~6.1% for contractors Source: IMF World Economic Outlook July 2016
8
4. Industry Overview and Competitive Position
Source: Company data; Global Cement Magazine; CemNet; The Author
Source: Company data; CRH; The Author
Table 9 - Cement industry concentration rate (YE2015)
Table 10 - CRH market position after acquisition of LHN
assets (YE2015) 0 20 40 60 80 100 120 2004 2006 2008 2010 2012 2014 2016 F 20 18 F 20 20 F U SD per Ton
Global cement prices USA Historical cement prices environmental legislation, particularly the Directives on Emissions Trading System19,
waste incineration and management through the Mining and Waste Directive. These regulatory concerns lead to competitive disadvantages comparing with other geographies (namely Asia Pacific and Middle East Africa) due to higher capital requirement and operational costs. This has a strong effect on the industry because it makes more difficult to compete with the already small export market and consequently improving its overall utilization rates (59.6% in 2014) which are the lowest among all regions in the world.
Competition and Pricing
The market structure for the cement industry tends to be oligopolistic with competitors that can be generally divided into two groups: regional and multiregional like the case of LHN. Typically, both groups operate in a vertical integration system by producing cement, aggregates, and ready-mix concrete. LHN as a vertically integrated company controls the entire production chain, from the quarry to final consumer. This means that it is positioned in the market as a price setter and have higher bargaining power over clients. At the same time that it is less dependent on key suppliers for raw materials/secondary materials (like clinker and aggregates) ensuring a more secure cement selling channels (through their own ready-mix concrete plants for instance).
Currently, LHN main competitors are HeidelbergCement (Germany), Cemex (Mexico), Italcementi, Buzzi Unicem (Italy) and CRH20 (Ireland) all of them operating
in more than 20 countries. Other competitors like Anhui Conch and CNBM Sinoma only operate in China, often with large subsidies from the local government and a presenting a very confined competition. The acquisition by CRH of several Lafarge and Holcim’s assets enabled the company to jump its annual cement production capacity from 19 Mt to 42 Mt and to become leader/or with significant position in several regional markets, especially in Europe where competition is already fierce – Table 10.
Between 2008 and 2014, M&A activity in the industry was not significant as the majority of cement producers were focused on deleveraging and increasing operational efficiency. Yet, after the announcement of Lafarge and Holcim merger operation, activity has changed. In response, HeidelbergCement announced on July 28, 2015, the intention of buying a 45% stake on Italcementi by EUR 1.670 million, with further plans to acquire the remaining shares. Combining both producers’ capacity by the end 2015, the new company will become the second-largest player in the industry with an annual capacity of nearly 190 Mt, way ahead of Cemex and Buzzi Unicem (93 Mt and 45 Mt respectively).
Although this is a mature industry, the global concentration degree is not as high as in other mature sectors. In 2015, the top five players accounted for nearly 17% of market capacity (including China), with LHN accounting for about 6.5% (table – 9). Hence, with markets prospects still low for mature regions as well as the overall excess capacity (especially in Europe), we expect an increasing number of industry players that will move towards concentration to optimize their current asset network and managing operational expenditures.
Pricing in the cement industry can vary a lot from different markets because the
product is not traded globally like other well-known commodities. According to a report on the industry21, one can divide cement prices into two regional categories:
Asian cement and European and North American cement. The authors found that for North American and most of the European importers, cement prices are on average USD 71 per ton while in Singapore is about USD 42 per ton. Another example is the case of Chinese exports that were being sold for roughly USD 32 per ton, in contrast with Germany and Canadian cement that were sold for USD 71 and USD 66 per ton, respectively. Dissimilarities in prices show us that Asian countries have strong comparative advantages that come from a variety of factors such as lower labor costs and environmental regulations, large subsidies, and low machinery prices.
According to LHN 2015 Annual Report, cement prices decreased in China and India in 2015 due to a combination of excess supply, a more competitive environment, and subdue economic growth (China). Other countries in the region had a better performance like the Philippines, Vietnam, Sri Lanka, and South Korea. In Latin America, most countries saw an increase in cement prices, except in Brazil and Ecuador. In Europe, construction slowed down and higher import volumes had negative impacts on prices. As for North American and Middle East Africa regions,
19Industrial Emissions Directive
20 After acquiring the “CRH Divestment Business”.
21 Global Cement Industry: Competitive and Institutional Dimensions” published in June 2010.
Market Competitors Capacity (Mt) Production
LafargeHolcim 374
Anhui Conch (China) 217
CNBM (Sinoma) (China) 172
HeidelbergCement 129
Cemex 93
China Resources (China) 71
Taiwan Cement 64 Italcementi 60 Eurocement 45 Votorantim 45 Buzzi Unicem 45 CRH 42 Total Capacity 1,349 World Capacity 5,695 Concentration Rate 23.7% Excluding China Total Capacity 889.1 World Capacity 2,535 Concentration Rate 35.1%
Country Product Position Market
Canada Cement, Aggregates,
RMX and Asphalt
Regional #1
Western Europe
Great Britain Cement, Aggregates,
RMX and Asphalt #1
France Cement, Aggregates,
RMX and Asphalt #3
Germany Cement and RMX Regional leader
Eastern Europe
Romania Cement, Aggregates,
RMX and Asphalt #3
Slovakia Cement, Aggregates,
RMX and Asphalt #1
Hungary Cement and RMX #2
Serbia Cement and RMX #2
Emerging Markets
The Philippines Cement and Aggregates #2
Brazil Cement and RMX Regional leader
Source: The Freedonia Group; US Geological Survey; The Author
9
4. Industry Overview and Competitive Position
Figure 19 - China cement market prospects
0.00 1.00 2.00 3.00 4.00 5.00 6.00 2010 2011 2012 2013 2014 2015E 2016F 2017 F 2018 F 2019 F 2020 F 2021 F Bn t
World Cement Demand World Cement Production
0 50 100 150 200 250 300 2009 2010 2011 2012 2013 2014 2015 E 201 6F 2017 F 201 8F 2019 F 2020 F 202 1F M it
W. Europe Demand W. Europe Production
E. Europe Demand E. Europe Production
0 25 50 75 100 125 150 2009 2010 2011 2012 2013 2014 2015 E 20 16 F 20 17 F 20 18 F 20 19 F 20 20 F 20 21 F Mt
North America Demand North America Production
USA Demand USA Production
0.50 0.90 1.30 1.70 2.10 2.50 2.90 3.30 3.70 2009 2010 2011 2012 2013 2014 2015 E 20 16 F 20 17 F 20 18 F 20 19 F 20 20 F 20 21 F Bn t
China Demand China Production
prices improved except in high volatile countries like Syria, Iraq, and Lebanon. Part of LHN strategy is to implement price increases in all of its present locations and according to 2016Q2 Report, the company had already successfully reached about 2/3 of this target. Since 2015Q4 to 2016Q2 cement prices have been increasing on a quarter-on-quarter basis (2015Q4 from 2016Q1 it raised by 2.1% and 2016Q1 versus 2016Q2 it raised by 2.2%). For the foreseen years, cement prices22 at global level
should increase by an annual rate of 2.8% until 2021, from USD 68 in 2016F to USD 79 per ton in 2021F – Figure 15.
Cement Demand & Supply Outlook
Cement consumption is expected to grow on average by 4.2% a year, reaching a total volume of 5.300 Mt by 2021F as forecasted by “World Cement” survey released in August 2015 by The Freedonia Group. Despite the economic slowdown, China will continue to be the largest single cement market with nearly 60% of total world consumption. On the supply side, global capacity has grown by 30.3% since 2010, reaching a total volume of 5.695 Mt in 2014. At the same time, the demand raised at a slower rate (25%) leading to an excess capacity of around 38% resulting in more pressure on prices – Appendix H.
Mature Markets: Recovery ahead, but at different speeds
In Western Europe, cement market is projected to slowly continue its recovery started in 2014 when it reached the minimum (146 Mt) since 2009 peak (189 Mt). The anticipated growth rate will be around 2.4% on a YoY basis, accounting for roughly 40.7% of total consumption in the continent. For Eastern Europe, demand is expected to rise around 3% per year until 2021F, reaching total volume of 248 Mt. Despite this, LHN reported in 2016Q2 a negative increase of cement sales volume of -2.7% (like-for-like basis), mostly due to uncertainty caused by the U.K. referendum and low oil and gas prices that affected negatively the Russian and Azerbaijan markets.
On the supply side, total European cement capacity had grown nearly 6% from 588 Mt in 2010 to 621 Mt in 2014 and utilization rates practically remained flat at 60%. However, big differences arise between the Western and Eastern side. On one hand, total capacity in the Western area decreased by -4.6% from 2010 to 2014 while production was cut ever further at -12.6% in the same period. With this, utilization rates fell from 56.6% to 52% in 2014. In the Eastern region, capacity and production jumped by 18% and 22% respectively for the same time horizon, leading to an increase of 2.1% in utilization rates (from 65% in 2010 to 67.1% in 2014).
Total cement production is forecasted to grow by 2.4% until 2021F reaching 442 Mt compared with the estimated total consumption in the region of 417 Mt. This surplus is sustained by cement companies turning focus for export markets to increase their overall production rates. As an example, since 2010 volumes from the six highest cement exporting countries23 jumped by 39% from 23 Mt to 31 Mt in 2014, accounting
15.5% of all cement exports in the world – Figure 17.
The North American market has been consistently growing since 2009 when financial crises reached its peak. The USA represents 90% of total cement demand in the region and is predicted to grow on average by 4.3% until 2021F reaching volumes in order of 120 Mt. In line with this forecast, in the 2016Q2 report, LHN presents a growth of 5.8% in cement volumes on a like-for-like basis. According to the CIC24, the country construction industry is foreseen to accelerate 3.1% over the
next years with investments to modernize infrastructure and growing population that demands higher levels of cement consumption.
In terms of production, in North America and especially USA volumes increased from 66 Mt in 2010 to 83 Mt in 2014 reaching good utilization rates of 84%. Due to the severe financial crisis, cement consumption dropped sharply nullifying any necessity of increase capacity. Hence, total capacity had remained flat around 97 to 99 Mt for the same period. As future prospects improved, “Global Cement” survey forecasts a rise in capacity with production expanding by 4% a year to 109 Mt in 2021F. Despite this, there will be still a production deficit of around -8% to satisfy local demand – Figure 18.
Emerging Markets: Solid future demand
The Asia Pacific region will continue to be the main cement market representing around 75% of total world consumption. As forecasted by the industry survey, the whole region is expected to grow on average by 4.2% until 2021F. According to LHN
22 According to the industry study “World Cement” from The Freedonia Group.
23 Spain, Greece, Germany, Portugal, Italy and Belgium as of December 31, 2014.
24 Timetric’s Construction Intelligence Center.
Source: CemNet; The Freedonia Group; The Author
Source: CemNet; The Freedonia Group; the Author
Source: CemNet; The Freedonia Group; The Author
Figure 16 - World cement demand and production
Figure 17 - Europe cement market prospects
Figure 18 - North America and USA cement market prospects