M
ASTER OF
S
CIENCE IN
FINANCE
M
ASTERS
F
INAL
W
ORK
PROJECT
EQUITY RESEARCH
:
PVH
C
ORP
C
AROLINA
S
ILVA
M
ASTER OF
S
CIENCE IN
FINANCE
M
ASTERS
F
INAL
W
ORK
PROJECT
EQUITY RESEARCH
:
PVH
C
ORP
C
AROLINA
S
ILVA
S
UPERVISOR
:
VICTOR
MAURÍLIO
SILVA
BARROS
i
Abstract
The purpose of this dissertation is to determine PVH, Corp. equity value at the
end of 2019. The main motivation behind picking PVH, Corp. was the insights
and expertise gain in the Fashion Luxury Apparel Industry throughout a group
work performed in the curricular unit of Equity Research. This experience allowed
me to better understand the dynamics, the competition and the risks in which
PVH operates.
This report follows the research report format recommended by the CFA Institute.
It was performed a detailed analysis on the company financials and industry
sector followed by a DCF and Multiples Valuation. The DCF resulted in a share
price of $104.30, that represents a upside potential of 18.90% when compared to
the current price of $87.72. The multiples valuation resulted in a share price of
$98.89, 12.73% above the current price.
An extensive Sensitivity Analysis was also performed to access the impact of
multiple variables, and the result point to a Price Target rounding $114.62. This
value represents an upside potential of 30.67%, when compared to the current
price.
To complement the sensitivity analysis, a Monte Carlo Simulation was also
performed to better access the impact caused by the Terminal WACC and
Terminal Growth Rate on Price Target. Results showed a mean Price Target of
$111.93, representing an Upside Potential of 27.60%, which is near the price
target computed by the DCF valuation. The probability of a BUY recommendation
is close to 85%.
Thus, the outcome of this dissertation is a Buy Recommendation.
ii
Resumo
O objetivo desta dissertação é calcular o valor do capital próprio da empresa
PVH, Corp. no final do ano de 2019. A principal razão de ter escolhido esta
empresa foi o conhecimento prévio sobre a indústria de moda e vestuário de luxo
adquirido através de um trabalho de grupo, durante a unidade curricular de
Equity Research. Esta experiencia permitiu compreender melhor a dinâmica da
indústria, a dinâmica entre concorrentes e os riscos a que a empresa esta
exposta.
Este relatório segue o formato recomendado pelo CFA Institute.
Foi realizada uma análise detalhada à situação financeira da empresa e à
indústria onde esta está inserida, seguidas de uma avaliação FCD e por
Múltiplos. A avaliação segundo os FCD resultou num preço por acção de
$104.30, que representa um ganho de 18.90%, quando comparada com o preço
corrente de $87.72.
A avaliação por múltiplos resultou num preço de $98.89, 12.73% acima do preço
corrente.
Foi realizada uma extensa Análise de Sensibilidade de modo a compreender os
impactos de múltiplas variáveis no preço final da acção, e os resultados indicam
que este será à volta de $114.62. Este valor representa um ganho de 30.67%,
quando comparado com o preço corrente.
Para complementar a Análise de Sensibilidade, foram feitas simulações Monte
Carlo para melhor compreender o impacto causado pelo WACC Terminal e pela
Taxa de Crescimento no valor da acção. Os resultados apontam para um preço
médio por acção de $111.93, representando um ganho de 27.60%, suportando
o resultado da avaliação dos FCD. A probabilidade de uma recomendação de
compra de acções ronda os 85%.
A conclusão desta dissertação é portanto o aconselhamento à compra de ações
da empresa.
iii
Acknowledgements
Firstly, I would like to express my gratitude to my supervisor, Dr. Victor Barros,
for his guidance, support and commitment, that helped me to perform a better
work.
Secondly, I would like to thank to my friends and colleagues, who always
supported and motivated me throughout this journey.
Finally, but most importantly, I want to thank my mother for the unconditional
support day by day, comprehension and motivation during this project.
iv
Index
Abstract ... i Resumo ... ii Acknowledgements ... iii Index ... iv List of Figures ... viList of Tables ... viii
1. Research Snapshot ... 1 2. Business Description ... 2 History ... 3 Business Groups ... 4 Strategies ... 4 Stockholder’s Overview ... 6
3. Management and Corporate Governance ... 7
4. World Economic Outlook ... 10
5. Luxury Fashion, The Industry ... 12
Demographic change ... 16
Economic Forecast ... 17
Macroeconomic Environment ... 17
Market Structure ... 17
Key to Sound Revenues ... 18
A Costly Innovation ... 18
Supply vs Demand ... 18
SWOT Analysis ... 19
Porter Five Forces ... 19
6. Investment Summary... 21 7. Valuation ... 22 8. Financial Analysis ... 26 9. Investment Risks ... 28 Risk Matrix ... 28 Sensitivity Analysis ... 29 Appendix ... 33
Appendix 1: Balance Sheet ... 33
Appendix 2: Balance Sheet Common Size ... 34
Appendix 3: Income Statement ... 34
Appendix 4:Income Statement Common Size ... 35
Appendix 5:Cash Flow Statement ... 35
Appendix 6: Ratios ... 36
v
Appendix 8: Income Statement Assumptions ... 37
Appendix 9: Capex and D&A Assumptions ... 37
Appendix 10: WACC Assumptions ... 37
Appendix 11: WACC Computations ... 38
Appendix 12: Terminal Growth Rate ... 38
Appendix 13: DCF Analysis ... 38
Appendix 14: PEERS Selection ... 39
vi
List of Figures
FIG.1.1:MONTE CARLO SIMMULATION. ... 1
FIG.2.1:PVHREVENUE FROM 2015-2018. ... 2 FIG.2.2:PVH2018REVENUE BY BUSINESS. ... 2 FIG.2.3:PVH2018EBITBY BUSINESS. ... 2 FIG.2.4:PVHREVENUE BY REGION 2016-2018. ... 2 FIG.2.5:PVH2018REVENUE BY REGION. ... 3 FIG.2.6:PVH2018EBITBY REGION. ... 3
FIG.2.7:CALVIN KLEIN 2018REVENUES BY REGION. ... 4
FIG.2.8:CALVIN KLEIN EBITMARGIN GROWTH. ... 4
FIG.2.9:CALVIN KLEIN REVENUE GROWTH. ... 4
FIG.2.10:TOMMY HILFIGER 2018REVENUE BY REGION. ... 4
FIG.2.11:TOMMY HILFIGER REVENUE GROWTH. ... 5
FIG.2.12:CALVIN KLEIN EBITMARGIN GROWTH. ... 5
FIG.2.13:HERITAGE BRANDS REVENUES FROM 2013-2018 ... 5
FIG.2.14:STOCKHOLDER STRUCTURE BY TYPE OF INVESTOR. ... 6
FIG.4.1:GDPANNUAL GROWTH FROM 2000 TO 2018………10
FIG.4.2:GDPANNUAL GROWTH AND FORECAST FOR THE WORLD,ADVANCED AND DEVELOPING ECONOMIES FROM 2012 TO 2024. ... 10
FIG.4.3:POPULATION, IN MILLIONS, FROM 2020 TO 2024. ... 10
FIG.4.4:GDPANNUAL GROWTH AND FORECAST FOR THE ADVANCED ECONOMIES FROM 2017 TO 2020. ... 10
FIG.4.5:GDPANNUAL GROWTH AND FORECAST FOR THE DEVELOPING ECONOMIES FROM 2017 TO 2020. ... 11
FIG.4.6:GDPANNUAL GROWTH AND FORECAST FOR THE EMERGING AND DEVELOPING ASIA FROM 2017 TO 2020. ... 11
FIG.4.7:INFLATION RATE,AVERAGE CONSUMER PRICES (ANNUAL PERCENT CHANGE), FOR THE WORLD,ADVANCED AND DEVELOPING ECONOMIES, FROM 2012 TO 2024. ... 11
FIG.4.8:INFLATION RATE,AVERAGE CONSUMER PRICES (ANNUAL PERCENT CHANGE), FOR THE ADVANCED ECONOMIES OF JAPAN,U.S. AND EURO AREA, FROM 2012 TO 2024………..……….11
FIG.5.1:SHARE OF GLOBAL PERSONAL LUXURY GOODS MARKET, BY CATEGORY (€ BILLIONS). ... 12
FIG.5.2:FASHION COMPANIES’ CONTRIBUTION TO INDUSTRY ECONOMIC PROFIT 2005-2015 VS.2016 VS.2017%, BASED ON PUBLICLY LISTED COMPANIES. ... 12
FIG.5.3:TOP 20 FASHION COMPANIES‘ CONTRIBUTION TO INDUSTRY ECONOMIC PROFIT 2008-2017%,BASED ON PUBLICLY LISTED COMPANIES. ... 12
FIG.5.4:FORECAST OF SHARE OF GLOBAL PERSONAL LUXURY GOODS MARKET, BY REGION IN 2025. ... 13
FIG.5.5:SHARE OF GLOBAL PERSONAL LUXURY GOODS MARKET VALUE, BY CONSUMER NATIONALITY. ... 13
FIG.5.6:FASHION AVERAGE SALES CONVERSION RATES, DESKTOP AND MOBILE, IN %. ... 14
FIG.5.7:INSTAGRAM LIKE/FOLLOWER RATIO (LFR),AVERAGE NUMBER OF LIKES ON EACH POST IN PROPORTION TO NUMBER OF FOLLOWERS OVER FOUR WEEKS IN AUGUST 2018. ... 15
FIG.5.8:2017 AVERAGE MARKET CAPITALIZATION TO EBITDA MULTIPLES, BASED ON AVERAGES OF PUBLICLY LISTED FASHION RETAILERS WITH $100M+ ANNUAL REVENUE. ... 15
FIG.5.9:POPULATION DISTRIBUTION IN THE UNITED STATES IN 2018, BY GENERATION. ... 16
FIG.5.10:AVERAGE ESTIMATED INCOME OF AMERICANS IN 2015, BY GENERATION ... 16
FIG.5.11:SHARE OF GLOBAL PERSONAL LUXURY GOODS CONSUMERS, BY GENERATION. ... 16
FIG.5.12:SHARE OF GLOBAL PERSONAL LUXURY GOODS SALES VALUE, BY GENERATION. ... 16
FIG.6.1:PVH VS S&P500INDEX CUMULATIVE RETURNS. ... 21
FIG.6.2:COST OF GOODS SOLD AS % OF REVENUE,SG&A AS % OF REVENUE AND EBITMARGIN, SINCE 2013 UNTIL THE END OF THE FORECAST PERIOD. ... 21
FIG.6.3:PVHEPS, FROM 2013 TO 2020. ... 21
FIG.6.4:MONTE CARLO SIMULATION……….…21
FIG.7.1:COMBINATION OF TOTAL REVENUE, FROM 2013 TO 2020. ... 22
FIG.7.2:TOMMY HILFIGER STORES BY REGION, IN AUGUST 2019. ... 22
FIG.7.3:CALVIN KLEIN STORES BY REGION, IN AUGUST 2019. ... 22
FIG.7.4:FORECASTED CAGR FOR 2029-2023 BY REGION. ... 22
FIG.7.5:THREVENUES FROM 2017 TO 2022F. ... 23
FIG.7.6:CKREVENUES FROM 2017 TO 2022F. ... 23
FIG.7.7:PVHCOGS FROM 2013 TO 2022F. ... 23
FIG7.8:CAPITAL EXPENDITURES OF PPE AS % OF SALES. ... 23
vii
FIG.8.1:PVHPROFITABILITY RATIOS FROM 2016 TO 2022F ... 26
FIG.8.2:PVHCOGS FROM 2013 TO 2022F. ... 26
FIG.8.3:PVHSOLVENCY RATIOS FROM 2016 TO 2022F ... 26
FIG.8.4:PVHLIQUIDITY RATIOS FROM 2016 TO 2022F... 26
FIG.8.5:PVHEFFICIENCY RATIOS FROM 2016 TO 2022F ... 26
FIG.8.6:PVHROEDECOMPOSITION ... 27
FIG.8.7:PVHROE FROM 2014 TO 2022F ... 27
FIG.8.8:PVHROA VS LEVERAGE FROM 2014 TO 2022F ... 27
FIG.8.9:PVHNET PROFIT MARGIN VS ASSETS TURNOVER FROM 2014 TO 2022F. ... 27
FIG.9.1:RISK MATRIX. ... 28
FIG.92:SUMMARY OF MONTE CARLO SIMULATION ... 32
FIG.93:MONTE CARLO SIMULATION ... 32
viii
List of Tables
TABLE 1.1:MARKET PROFILE. ... 1
TABLE 1.2:VALUATION SUMMARY. ... 1
TABLE 2.1:TOP 10MUTUAL FUNDS HOLDING PVHCORP. ... 6
TABLE 22:TOP 10INSTITUTIONAL OWNERS OF PVHCORP. ... 6
TABLE 3.1:BOARD OF DIRECTORS COMPOSITION, POSITION, CASH REMUNERATION, STOCK AWARDS AND TOTAL REMUNERATION OF THE 2018 FISCAL YEAR. ... 9
TABLE 32:EXECUTIVE OFFICERS COMPOSITION, POSITION AND TOTAL REMUNERATION OF THE 2018 FISCAL YEAR. ... 9
TABLE 51:PESTANALYSIS. ... 17
TABLE 52:SWOTANALYSIS. ... 19
TABLE 6.1:VALUATION SUMMARY. ... 21
TABLE.7.1:STANDARD &POOR’S PVH RATING, IN 2019. ... 24
TABLE.7.2:WACCASSUMPTIONS ... 24
TABLE.7.3:PVHPEERS SELECTION. ... 24
TABLE.7.4:PVHMULTIPLES VALUATION SUMMARY ... 24
TABLE 81:CAPITALIZATION OF OPERATING LEASES IMPACTS ON FCFF ... 27
TABLE 82:CAPITALIZATION OF OPERATING LEASES IMPACTS ON WACC ... 27
TABLE 83:CAPITALIZATION OF OPERATING LEASES IMPACTS ON TARGET PRICE ... 27
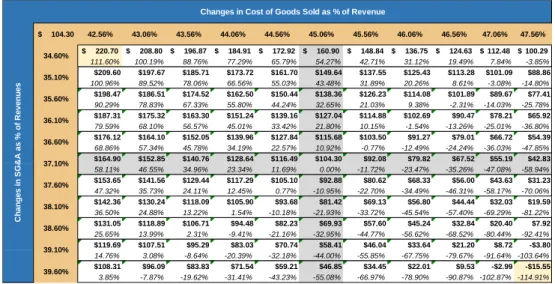
TABLE 91::EFFECTS OF CHANGES IN COGS AND SG&A ... 29
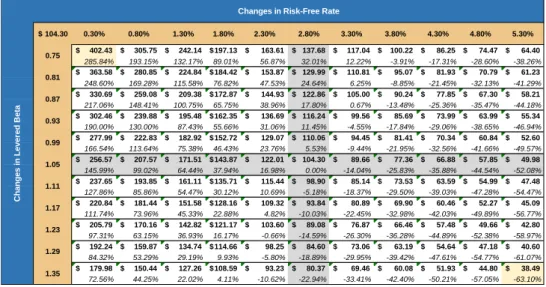
TABLE 92:EFFECTS OF CHANGES IN THE RISK-FREE RATE AND LEVERED BETA. ... 30
TABLE.9.3::EFFECTS OF CHANGES IN THE MARKET RISK PREMIUM AND LEVERED BETA. ... 30
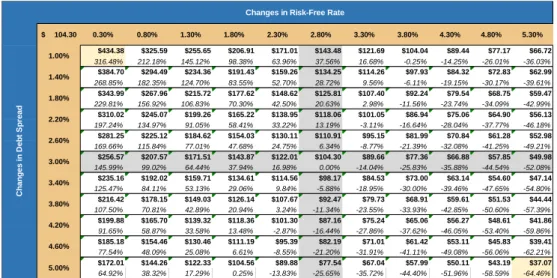
TABLE 94::EFFECTS OF CHANGES IN THE RISK-FREE RATE AND DEBT SPREAD. ... 31
TABLE 95:EFFECTS OF CHANGES IN TAX RATE AND DEBT SPREAD ... 31
TABLE 96:EFFECTS OF CHANGES IN THE LONG-TERM WACC AND TERMINAL GROWTH RATE ... 32
1
PVH Corp.
New York Stock Exchange1. Research Snapshot
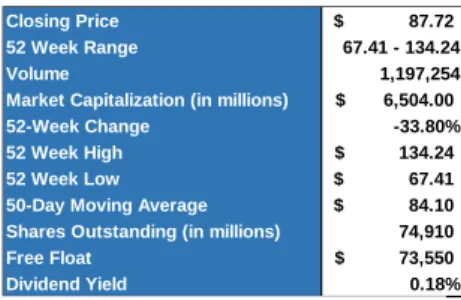
BUY is my recommendation for PVH, with a price target of $104.30 at 2019YE, using the DCF method. This offers a potential 18.90% upside gain from its latest closing price of $87.72 although with medium risk. Relative valuation through multiples supports the view that PVH is currently undervalued, with a price target of $98.89 at 2019YE (Table 1.2).
China: The significant increase in aggregated income allowed the Chinese middle
class to use their new spending power to express their personal tastes throughout fashion. Besides having been for many years the “factory of the world”, it is now the world’s fasted-growing market, accounting for more than 18% of all final goods consumed (MGFI).
India: The country’s expected CAGR of 8% between 2019-2022, combined with the
expected expansion of the middle class at 19.4% a year, and the expected rise in aggregated income, will make India’s fashion luxury apparel market the sixth-largest in the world (MGFI).
Trade Tensions: As PVH operates globally, a substantial portion of its products is
imported from various countries. The rising tariff barriers in some of these countries, mainly the U.S. and China, impacts the company’s costs and decreases the ability to respond quickly to changes in trends.
Millennials: Younger generations are a challenge to companies, as they crave the
new and the authentic; demand the use of digital technology and social media presence; and are increasingly concern about social and environmental causes, favoring brands that are aligned with their values and avoiding those that don’t.
Online Sales: The online channel represents 10% of today’s luxury market value,
and it’s expected to continue cannibalizing physical store sales as reaches 25% by 2025.
Source: Yahoo Finance
Carolina Silva ([email protected])
Master in Finance
BUY
RECOMMENDATION
TICKER: CURRENT PRICE: TARGET PRICE: INDUSTRY: MOODY’S RATING: RISK: RECOMMENDATION:
PVH $87.72 $104.30
Fashion LuxuryBa1 Medium Risk BUY
Reuters Oct 13, 2019 Dec 31, 2019 Apparel Feb 3, 2019 Oct 13, 2019 18.90% upside
Closing Price $ 87.72
52 Week Range 67.41 - 134.24
Volume 1,197,254
Market Capitalization (in millions) $ 6,504.00
52-Week Change -33.80%
52 Week High $ 134.24
52 Week Low $ 67.41
50-Day Moving Average $ 84.10 Shares Outstanding (in millions) 74,910
Free Float $ 73,550
Dividend Yield 0.18%
Source: The Author
0% 2% 4% 6% 8% 10% 12% 14% 16% $35 $45 $55 $65 $75 $85 $95 $105 $115 $125 $135 $145 $155 $165 $175 $185 $195 $205 $215 $225 $235 $245 $255 $265 $275 $285 $295 P ro b a b il it y
Source: The Author
Fig.2.1: PVH Revenue from 2015-2018.Source: The Author Fig.1.1: Monte Carlo Simmulation.
Fig.1 1 Enterprise Value $ 13,098,281.34 Target Price $ 104.30 Upside Potential 18.90% EV/EBIT $ 89.12 EV/REVENUE $ 99.25 P/E $ 81.02 P/Sales $ 126.16 Multiples Average $ 98.89 Upside Potential 12.73% Multiples Valuation DCF Valuation
Table 1.1: Market Profile.
2
2. Business Description
GENERAL PVH Corp is one of the world’s largest apparel companies with revenues of $9.7 billion in 2018YE, 8,3% higher than the previous year (Fig.2.1). The company operates three business groups - Calvin Klein, Tommy Hilfiger and Heritage Brands. The company has over 38,000 associates spread over 40 countries designing and sourcing hundreds of different products.
PVH operates a diversified portfolio of iconic lifestyle luxury apparel brands led by
CALVIN KLEIN and TOMMY HILFIGER, which represent approximately 84% of the
revenues (Fig.2.2) and 92% of EBIT (Fig.2.3).
The Heritage Brands include both national and international recognized trademarks, including Van Heusen, IZOD, Bass, ARROW and Eagle, which are owned brands; and Geoffrey Beene, Kenneth Cole New York, Kenneth Cole Reaction, Sean John, JOE Joseph Abboud, MICHAEL Michael Kors, Michael Kors Collection, Chaps, Donald J. Trump Signature Collection, DKNY, Elie Tahari, Nautica, Ted Baker, J. Garcia, Claiborne, Robert Graham, U.S. POLO ASSN., Ike Behar, Axcess, Jones New York and John Varvatos, which are licensed, as well as other licensed and private label brands.
The company generates net sales from the design, market and wholesale distribution to retailers, franchisees, licensees and distributors of branded dress shirts, neckwear, jeanswear, sportswear, performance apparel, underwear, intimate apparel, swimwear, swim products, handbags, accessories, footwear and other related products. The brand is positioned to sell at various price points and in multiple channels of distribution and regions. This enables PVH to offer products to a broad range of consumers, while minimizing competition among their brands and reducing their reliance on any one demographic group, merchandise preference, price point, distribution channel or region. The company also license their brands to third parties and joint ventures for product categories and regions. Additionally, PVH generates royalty, advertising and other revenue from fees for licensing the use of their trademarks.
PVH's operations have also evolved from a regional perspective, since in the early 2000's the business was primarily based in North America, and currently PVH operates significant businesses in Europe, Asia Pacific and Latin America (Fig.2.4), and over 50% of revenues and approximately 70% of EBIT on a non-GAAP basis are generated outside of the U.S. (Fig.2.5, 2.6).
The most important driver of PVH’s profitability is high margins. Luxury fashion costumers have low sensibility to price changes and value quality, which enables PVH to increase the final price and consequently increase margins and profits. Another important driver of profitability is costs. The majority of the company’s costs are variable, which means that it increases with the increase of sales, but also decreases whenever the company struggles to sell. Other profitability driver is customer retention and costumer referral. PVH has been able to retain their oldest clients and use them to spread influences and trends.
The macroeconomics’ drivers of profitability are the increase in population and the increase in aggregated income in Asia Pacific.
0 2000 4000 6000 8000 10000 2016 2017 2018 Revenue by Region
Domestic Europe Asia Canada Other
$8 020 $8 203 $8 915 $9 657 $7 000 $7 500 $8 000 $8 500 $9 000 $9 500 $10 000 2015 2016 2017 2018 39% 45% 16%
Calvin Klein Tommy Hilfiger Heritage Brands
37%
55% 8%
Calvin Klein Tommy Hilfiger Heritage Brands Source: the Author
Fig.2.7: PVH 2018 EBIT By Business.Source: the Author
Source: the Author
Fig.2.10: PVH Revenue By Region 2016-2018.Source: the Author
Source: the Author
Source: the Author
Source: the Author
Fig.2.13: PVH 2018 Revenue By
Region.Source: the Author
Fig.2.2: PVH Revenue from 2015-2018.
Fig.2.3: PVH 2018 Revenue By
Business.Fig.2.4: PVH Revenue from 2015-2018.
Fig.2.5: PVH 2018 Revenue By Business.
Fig.2.6: PVH 2018 Revenue By Business.
Fig.2.8: PVH 2018 EBIT By Business.
Fig.2.9: PVH 2018 EBIT By Business.
Fig.2.11: PVH Revenue By Region 2016-2018.
Fig.2.12: PVH Revenue By Region 2016-2018.
3
History
The company started 138 years ago, in 1881 when Moses Phillips brought his family to America and started to sell shirts to coal miners in Pottsville Pennsylvania, where he and his four sons were given the opportunity to merge with another shirt company - D. Jones & Sons and build the business significantly, under the new name Phillips-Jones.
In 1919 the company bought the rights to sell (in North and South America) an innovative soft collar design invented by John Van Heusen which was a huge success and allowed the company to become the greatest maker of dress shirts in America by 1920, year in which it became publicly and changed his name to PVH.
Since the beginning that the company’s strategy was to adapt to the market, acquire to grow, invest in brands and be a good partner. PVH put these strategies in practice over the years: in 1982 the company launches Geoffrey Beene shirts, in 1987 acquires G.H. Bass & Co. and in 2002 acquires the worldwide rights to the Van Heusen label, all top selling brands.
In 2003, PVH acquired Calvin Klein for $400 million in cash, plus another $30 million in stock and up to $300 million in royalties, linked to revenues over the next 15 years. This greatly expanded PVH’s growth potential both domestically and internationally. The deal included the design house and a series of CK licenses, including jeans, sheets, eyeglasses and perfume, as well as a non-expiring license for CK underwear, owned by Warnaco. CK Inc was a luxury apparel firm led by the famous stylist Calvin Klein and his partner Barry Schwartz. Although the CK name is one of the world's most recognizable brand names, the firm had been on an unstable path, with huge successful collections, some costly failures and large accumulation of debt. Overall, CK was a stylish success with poor management. The acquisition brought to CK the financial resources to further expand his name in Asia and Europe, as well as more free time to the designer to concentrate in the creation process instead of production and bookkeeping. PVH plans were to introduce a new CK men's sportswear line, to compete with the more moderately priced Lauren line by Ralph Lauren, and with the Jones New York labels. PVH intention was to use CK and a growth vehicle.
In 2004, PVH expanded its license agreements to include MICHAEL Michael Kors, Sean John. and ARROW. In 2007, PVH acquired the business of Superba, Inc., the world's largest provider of men's neckwear, that includes the licenses for brands as DKNY, Nautica, Perry Ellis, Ted Baker, JOE Joseph Abboud, Original Penguin, Jones New York.
In 2010, PVH acquired TOMMY HILFIGER, one of the world's leading premium lifestyle brands, for $3 billion, $2.5 billion in cash and $7.9 million in shares plus the assumption of $100 million in liabilities. This was a unique opportunity to bring together two premier companies, each with iconic brands, which would deliver enhanced opportunities for stockholders, business partners, customers and employees, being the biggest source of revenue through the years. TH was facing difficult times by the late 1990’s, because customers tastes changed and the brand was considered unfashionable. The company eventually sold itself in 2006 to Apax and European management, led by Mr. Gehring, for about $1.6 billion in cash. Under Apax and Mr. Gehring, the company experienced a big recovery. Selling the company in 2010 served a cash-out solution for Apax partners, that still owns 15% of the brand. The PVH’s motivation was to take advantage of a strong brand, of high profits and of TH’s strong European distribution channels as a platform for its own products. Also TH was already focused on international growth and already had licenses conceded do PVH to sell their clothing products. PVH at the time was under-levered, being able to take about $2.5 billion in debt. PVH financed the cash portion of the deal and refinanced $300 million worth of bonds with a combination of $385 million of cash on hand, $2.45 billion of bank loans (including an undrawn $450 million revolver) and $600 million of senior unsecured bonds. The company also issued $200 million of perpetual convertible preferred notes issued to LNK Partners and MSD Capital that convert at $47.74 a share with no coupon or
46%
35% 12%
7%
U.S. Europe
Asia Pacific Americas (excluding U.S.)
40%
30% 19%
11%
U.S. Europe Asia Pacific Americas (excluding U.S.) Source: the Author
Source: the Author
Source: the Author
Fig.2.19: Calvin Klein 2018 Revenues By Region.Source: the Author
Fig.2.14: PVH 2018 Revenue By Region.
Fig.2.15: PVH 2018 EBIT By
Region.Fig.2.16: PVH 2018 Revenue By Region.
Fig.2.17: PVH 2018 EBIT By Region.
4
liquidation preference. PVH also issued $200 million of new shares before the deal closed.
In 2013, PVH acquired The Warnaco Group, Inc., that was for many years their largest licensee for CK products. By reuniting the CK brand under one owner, PVH had complete direct global control of the brand image and commercial decisions for the two largest CK apparel categories - jeans and underwear, being able to better coordinate product design, merchandising, supply chain, retail distribution and marketing, which strengthened the brand’s image, positioning and execution across all markets. Warnaco’s operations in Asia and Latin America enhanced PVH’s opportunities in these high-growth regions, as well as the ability to leverage their expertise and infrastructure in North America and Europe. The acquisition also brought the Speedo, Warner’s and Olga brands into the Heritage Brands portfolio. Also that year, the company sold its G.H. Bass & Co. Business to G-III Apparel Group, in an effort to narrow its focus on its lifestyle apparel businesses.
In 2015, PVH entered in a joint venture with Gazal Corporation Limited, which enhance the rights to market and distribute: certain CK products in Australia, New TM, Van Heusen and certain branded menswear and shapewear products in Australia and New Zealand.
In 2016, PVH completed its acquisition of the 55% stake in the Tommy Hilfiger joint venture in China that it did not already own. In the next year, PVH acquires True & Co., a Silicon Valley direct-to-consumer intimate apparel e-commerce retailer.
Business Groups
PVH has three main business groups: Calvin Klein, Tommy Hilfiger and Heritage Brands. Both the CK and the TH business groups are segmented by region into North America (U.S., Canada and Mexico) and International (Europe, including the Middle East and Africa; Asia Pacific, including Australia and New Zeland; and Latin America, including South America, Central America and the Caribbean).
Almost half of the CK 2018YE revenues were generated outside North America, significantly in Europe and Asia Pacific (Fig.2.7). Although EBIT margins have been decreasing for the past years (Fig.2.8), total revenue growth has been positive (Fig.2.9).
More than half of the TH 2018YE revenues were generated outsider North America, with Europe generating 43% of revenues (Fig.2.10). Total revenue and EBIT margin growth has been positive for the past years (Fig.2.11, Fig.2.12).
The Heritage Brands only represented 16.8% of revenues and 8% of EBIT in 2018YE. HB revenues have been slowly increasing since 2016, after a sharp decrease (Fig.2.13).
Strategies
Global Strategies:
1. Drive consumer engagement by investing in brand, product, channel, and in-store and online experiences.
2. Expand CALVIN KLEIN's and TOMMY HILFIGER’s worldwide reach and extend
direct control over various licensed businesses.
3.
Invest in and evolve the operating platforms through their systems, consumer data, speed to market, digitalization, supply chain initiatives and centers of excellence.56%
26%
16% 2%
North America Europe
Asia Pacific Latin America
10,0% 11,0% 12,0% 13,0% 14,0% 15,0% 2016 2017 2018 $2 800,00 $3 000,00 $3 200,00 $3 400,00 $3 600,00 $3 800,00 2016 2017 2018 43% 43% 11% 3%
North America Europe Asia Pacific Latin America Source: the Author
Fig.2.22: Calvin Klein EBIT Margin
Growth.Source: the Author
Source: the Author
Fig.2.25: Calvin Klein Revenue Growth.Source: the Author
Source: the Author
Fig.2.28: Tommy Hilfiger 2018 Revenue by Region.Source: the Author
Source: the Author
Fig.2.31: Tommy Hilfiger Revenue Growth.Source: the Author
Fig.2.20: Calvin Klein 2018 Revenues By Region.
Fig.2.21: Calvin Klein 2018 Revenues By Region.
Fig.2.23: Calvin Klein EBIT Margin Growth.
Fig.2.24: Calvin Klein EBIT Margin Growth.
Fig.2.26: Calvin Klein Revenue Growth.
Fig.2.27: Calvin Klein Revenue Growth.
Fig.2.29: Tommy Hilfiger 2018 Revenue by Region.
Fig.2.30: Tommy Hilfiger 2018 Revenue by Region.
5
4. Develop a talented and skilled organization that embodies the company’s corevalues by attracting and retaining talent through associate engagement and career growth opportunities, while providing an inclusive workplace where every individual is valued.
5. Generate free cash flow by accelerating topline growth and focusing on margin and working capital opportunities, while seeking to maximize returns.
Calvin Klein Strategies:
1. Be consumer-centric and enhance global relevance through marketing campaigns and consumer engagement initiatives designed to drive growth and further resonate with youth-minded consumers.
2. Drive product improvement and expansion, particularly within apparel, jeans, accessories and women’s intimates.
3. Develop compelling digital experiences, while also growing their presence in specialty stores and opening additional travel retail locations.
4. Gain greater control of the brand by taking back licensed businesses to operate them directly.
5. Sharpen their processes by enhancing data capabilities.
Tommy Hilfiger strategies:
1. Be consumer-centric and enhance global brand relevance with marketing campaigns and consumer engagement initiatives designed to drive growth and reflect TOMMY HILFIGER’s accessible luxury positioning and classic American cool aesthetic.
2. Category expansion within womenswear and accessories, men’s tailored clothing and underwear.
3. Drive regional expansion, particularly in Asia Pacific.
4. Digitize TOMMY HILFIGER from showrooms to stores and online experiences.
5. Evolve the supply chain to adapt more quickly to change.
Heritage Brands strategies:
1. Be consumer-centric by designing and marketing quality, trend-right products that offer great value to consumers and introducing products with new technologies and new features.
2. Leverage and enhance each brand’s position in the market.
3. Maximize distribution, through mass market retailers and digital commerce.
4. Enhance profitability by capitalizing on supply chain opportunities and leveraging consumer insights, while also reducing costs and maintaining a critical focus on inventory management. $3 400,00 $3 600,00 $3 800,00 $4 000,00 $4 200,00 $4 400,00 2016 2017 2018 10,0% 11,0% 12,0% 13,0% 14,0% 15,0% 2016 2017 2018
Source: the Author
Fig.2.37: Heritage Brands Revenues from 2013-2018Source: the Author
$1,000,000.00 $1,200,000.00 $1,400,000.00 $1,600,000.00 $1,800,000.00 $2,000,000.00 $2,200,000.00 2013 14 15 16 17 18
Source: the Author
Fig.2.40: Stockholder structure by type of investor.Source: the Author
Source: the Author
Fig.2.34: Calvin Klein EBIT Margin
Growth.Source: the Author
Fig.2.32: Tommy Hilfiger Revenue Growth.
Fig.2.33: Tommy Hilfiger Revenue Growth.
Fig.2.35: Calvin Klein EBIT Margin Growth.
Fig.2.36: Calvin Klein EBIT Margin Growth.
Fig.2.38: Heritage Brands Revenues from 2013-2018
Fig.2.39: Heritage Brands Revenues from 2013-2018
6
Stockholder’s Overview
The Stockholder Structure is divided into three main types of investors, the Mutual
Fund Holders (type of financial vehicle made up of a pool of money collected from
many investors to invest in securities such as stocks, bonds, money market instruments, and other assets), with 56% of the shares, the Institutional Holders (nonbank person or organization that trades securities in large enough share quantities or dollar amounts that it qualifies for preferential treatment and lower commissions), with 43% of the shares and Individual Holders with 1% of the shares (Fig.2.14).
During 2019 AprilQE, Institutional Investors and Mutual Funds purchased a net $1.2 million shares of PVH, and together now own 99% of the total shares outstanding. This greater stake is not typical for companies in the Apparel/Footwear industry, and may reflect the investors’ expectations on PVH stock, seeing it as an important holding.
The Top 10 Mutual Funds together own 16,82% of PVH common stock (Table 2.1) and the Top 10 Institutional Owners owns 47,81% (Table 2.2).
PVH’s Stock Ownership Guidelines require that non-employee directors, that served the board for more than 5 years, own shares of PVH common stock with an aggregate value equal to five times the annual cash retainer payable to directors. The CEO is also required to hold shares of PVH common stock with an aggregate value equal to six times his annual base salary. The other NEOs must hold PVH common stock with an aggregate value equal to three times their respective annual base salaries. In addition, Mr. Chirico must hold for one year the after-tax payouts of his PSU awards.
As of the date of the Proxy Statement, all of the Non-employee Directors, Mr. Chirico, and all of the NEOs are in compliance with the stock ownership guidelines. This Shareholder Structure is suitable for this company, as the company has the power to monitor the share ownership at any given time, preventing hostile takeovers.
Mutual Fund Stake
Vanguard Total Stock Market Index Fund 2,84% Vanguard Mid Cap Index Fund 2,50% Vanguard 500 Index Fund 2,25% Franklin Mutual Ser. Fds. - Shares Fund 2% JPMorgan Mid Cap Value Fund 1,93% Vanguard Windsor Funds 1,18% SPDR S&P 500 ETF 1,08% Government Pension Fund - Global 1,06% Fidelity Blue Chip Growth Fund 1,05% Fidelity Series Equity Income Fund 0,93%
Top 10 Mutual Funds Holding PVH Corp
Stockholder Stake
The Vanguard Group, Inc. 10,72%
Fidelity Management & Research Co. 9,25%
JPMorgan Investment Management, Inc. 6,53%
SSgA Funds Management, Inc. 4,80%
BlackRock Fund Advisors 4,68%
Pzena Investment Management LLC 4,01%
Franklin Mutual Advisers LLC 2,87%
Dimensional Fund Advisors LP 1,85%
Renaissance Technologies LLC 1,58%
Geode Capital Management LLC 1,52%
Top 10 Institutional Owners of PVH Corp
56% 43%
1%
Mutual Fund Holders Institutional Holders Individual Holders
Source: Yahoo Finance
Source: Yahoo Finance
Source: Yahoo Finance
Fig.2.41: Stockholder structure by type of investor.
Fig.2.42: Stockholder structure by type of investor.
Table 2.1: Top 10 Mutual Funds Holding PVH Corp.
Table 2.2: Top 10 Mutual Funds Holding PVH Corp.
Table 2 3: Top 10 Institutional Owners of PVH Corp.
7
3. Management and Corporate Governance
PVH follows their own Code of Business Conduct and Ethics, Code of Ethics for the CEO and Senior
Financial Executives and Corporate Governance Guidelines (see appendix 6). Board of Directors
PVH’s Board of Directors is responsible for the management of risks related to the operation of the business. The Board also receives periodic reports from members of senior management on various aspects of risk, including the enterprise risk management program, business continuity planning and cybersecurity.
The Board of Directors is composed by the chairman Emanuel Chirico, who is also the CEO, and other 11 independent members. Emanuel Chirico has been with PVH for over 25 years, serving as CEO since 2006 and Chairman since 2007. He graduated from Fordham’s Gabelli School of Business in 1979. Previously, he held a number of financial and operational positions within PVH, including President, COO and CFO. Prior to joining PVH, Chirico was a partner at the international accounting firm, Ernst & Young, running their retail and apparel practice group. Chirico is also on the board of directors at Dick's Sporting Goods.
The Board of Directors has four standing Committees, composed by the rest of the board members.
The standing Audit & Risk Management Committee, which is responsible for risk assessment and risk management, is composed by:
• The chairman Juan R. Figuereo, director since 2011, who has a strong background in finance and accounting and has extensive experience in the consumer goods and retail industries, including brand building and driving innovation. Mr. Figuereo has been a Venture Partner in Ocean Azul Partners since 2018. Previously, he was Executive Vice President and CFO of Revlon, Inc., of NII Holdings, Inc., of Newell Rubbermaid, Inc. and of Cott Corporation; and Vice President of Mergers & Acquisitions at Wal-Mart International.
• V. James Marino, director since 2007, has significant senior executive leadership experience in the consumer products industry; significant expertise on both a domestic and an international basis in areas including corporate strategy development and execution, brand building and multichannel distribution. Previously, he was President and CEO of Alberto-Culver Company.
• Amy McPherson, director since 2017, started her career in Marriott in 1986 and served roles of increasing responsibility, including Executive Vice President of Global Sales and Marketing, Senior Vice President of Business Transformation and Integration, and Vice President of Finance and Business Development. This background gave her considerable experience in overseeing business operations and development in Europe; in overseeing acquisitions and strategic partnerships and implementing and executing strategies on both a regional and global basis and in managing sales, customer care, sales channel strategy and analysis. Currently she is taking on a role as a principal investor and consultant to a children-focused media business. • Edward R. Rosenfeld, director since 2014, has over 20 years of experience focused on the retail, apparel
and footwear industries as both an executive and an investment banker. He started his career has an investment banker in a mergers and acquisitions (focused on the retail and apparel industries), but in 2005 joined Madden, serving in finance and strategic planning roles before becoming CEO in 2008.
The standing Compensation Committee, which is responsible for the alignment of the Executive Compensation Program and the Incentive Awards with stockholder value creation, corporate objectives, and their own Code of Business Conduct and Ethics, is composed by:
• The chairman Judith Amanda Sourry Knox, director since 2016, who has extensive global marketing and business experience in consumer product goods and consumer development. Ms. Sourry has spent almost her entire career — over 30 years — in roles of increasing responsibility and prestige at Unilever, including President of Global Foods Category, Executive Vice President of Global Haircare, Executive Vice President of U.K. and Ireland, Head of Global Customer Development and she is actively involved in Unilever’s global diversity, gender balance and sustainable living initiatives.
• Henry Nasella, director since 2003, has significant management experience (gained in senior executive positions in publicly traded retail companies and as a partner in private equity firms) and significant experience serving on boards of directors and board committees of several retail companies. He has the first President of Staples, building the company from startup into a global leader; he led the successful buyout of Star Markets, and served as Chairman and CEO of the company until it was sold to Sainsbury Plc., he was Venture Partner at Apax Partners, where he was a senior member of the U.S. Consumer and Retail Group and in 2005 he co-founded the firm, and has been a partner ever since.
8
• Craig Rydin, director since 2006, has significant management and leadership experience (which he gained in over 30 years in various executive positions in the consumer products and retail industry) and has extensive experience serving on the audit and compensation committees of several public and private company boards of directors. He held positions of increasing responsability at Campbell Soup Company (including management and marketing), and at Yankee Holding Corp. and Tankee Candle Company (including Chairman). Mr. Rydin has been an operating partner at LNK Partners since 2014.
The standing Nominating, Governance & Management Development Committee, which is responsible for risks related to governance issues, is composed by:
• The chairman Joseph B. Fuller, director since 1991, who has extensive experience advising management with respect to strategy, corporate finance, governance and marketing. Earlier he was Founder, Director and Vice-Chairman of Monitor Company LP for 30 years. He is a professor at Harvard Business School, is a Visiting Fellow at the American Enterprise Institute and founded Joseph Fuller LLC (a business consulting firm) in 2013.
• The Committee is also composed by Judith Amanda Sourry Knox, Henry Nasella and Craig Rydin. The standing Corporate Responsibility Committee, which is responsible for advising the Board and management with respect to potential risks to PVH’s reputation and our role as a socially responsible organization, is composed by:
• The chairman Geraldine McIntyre, director since 2015, who has extensive management experience gained through operating consumer packaged goods businesses in multiple channels and across multiple geographies. She has led sales, marketing and operations teams in Europe, Africa, Japan and the U.S. She has a background in consumer insights, brand building and digital commerce gained through her employment with Coca-Cola (11 years in positions of escalating responsibility in managment and marketing thoughout the world), Newell Brands (as President and Group President) and Sunrise Senior Living (CEO).
• Brent Callinicos, director since 2014, has extensive experience working in treasury, financial and accounting roles in public companies and working with public company boards. He was Vice President, Treasurer and CAO of Google Inc.; Advisor and CFO at Uber Technologies; and CO and CFO of Virgin Hyperloop One.
• Mary Baglivo, director since 2007, brings to the Board valuable marketing, advertising and strategic planning expertise along with general management know-how. She has extensive experience building high-performing brands via creative integrated programs and has led digital transformations for brand and agency organizations. Her clients have included leading global companies in consumer package goods, healthcare, retail, hospitality, spirits and financial services. She had an extensive career in major advertising agencies, including serving as Chairman & CEO of The Americas, and as CEO at Saatchi & Saatchi. She was also CMO and Vice President of Global Marketing at Northwestern University and was Vice Chancellor of Communications and Marketing at Rutgers University. Ms. Baglivo founded The Baglivo Group (a brand strategy advisory consultancy) in July 2018.
This Governance structure provides: independence, because all non-employee directors and all members of the Board’s standing committees are independent; accountability, because directors are elected annually by a majority vote and incentive compensation for executives is subject to our Clawback Policy; and Alignment
with Stockholder Interests, because executive compensation program emphasizes pay for performance.
The Governance structure is suitable because it is always necessary to have the consent of a majority of the voting members of the board, which prevents a member to act on his own interest, protecting shareholders.
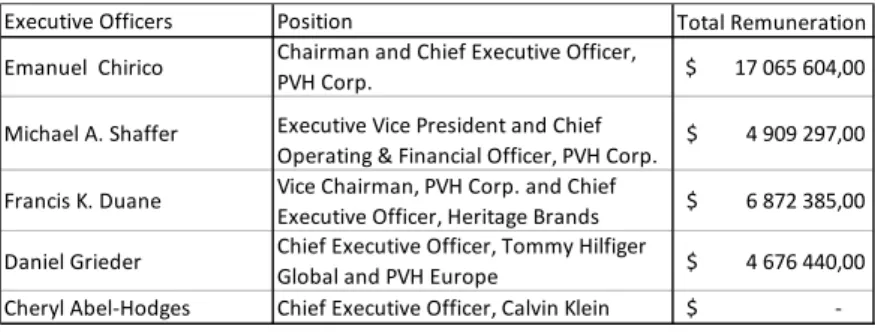
Executive Officers
Michael A. Shaffer, Executive Vice President and Chief Operating & Financial Officer, PVH Corp, has
been in the company for over 25 years and played an important role in the acquisitions of Tommy Hilfiger (2010) and Warnaco (2013). He held several positions in the wholesale and retail divisions of PVH, including Director of Accounting Operations, Vice President and Controller, Senior Vice President of Retail Operations, Executive Vice President of Finance, Executive Vice President and CFO, which translates to years of diverse financial management and executive leadership experience in the apparel and financial industry. Mr. Shaffer has been on the Board of Directors at Build-A-Bear Workshop, Inc. since May 2014. He graduated from George Washington University with a bachelor’s degree in accounting and is a Certified Public Accountant.
Francis K. Duane, Vice Chairman, PVH Corp and Chief Executive Officer, Heritage Brands, joined PVH
9
North America Wholesale. Prior to joining PVH, he served as Worldwide President of Guess Inc., and held senior positions at Nautica, Inc., Hugo Boss and Burberry. Mr. Duane is on the Board of Governors at GS1 US, and previously served on the Board of Directors of Ariat. Mr. Duane has a bachelor in Finance and Marketing and received an Honorary Doctorate degree in 2016, from Merrimack College.
Daniel Grieder, Chiel Executive Officer, Tommy Hilfiger Global and PVH Europe, has over 30 years of
international experience as managing director, founder, president and CEO of several European companies. Mr. Grieder joined PVH in 2004, and has assumed the roles of COO Tommy Hilfiger Europe and CEO Tommy Hilfiger Europe, before combining the roles of CEO PVH Europe (overseeing PVH’s businesses for both Tommy Hilfiger and Calvin Klein in Europe) and CEO Tommy Hilfiger Global, since 2014. Mr. Grieder graduated from HWV Business School in Zürich.
Cheryl Abel-Hodges, Chief Executive Officer of Calvin Klein, assumed her role in June 2019. Previously,
she was Group President of the CK North America and the Underwear Group; managed underwear businesses conducted under the CALVIN KLEIN, TOMMY HILFIGER, Warner's, Olga and True&Co. brands, overseeing design, merchandising, product development and planning; played an integral role in PVH’s acquisition of True&Co., the company’s partnerships with Amazon Fashion and Nike Inc., and held several senior leadership roles within the company, including President of Wholesale Sportswear for IZOD and President of CK Underwear. Earlier in her career, Cheryl held management, sales and marketing positions with Ralph Lauren Corp., Liz Claiborne Inc., Bernard Chaus, Carole Little, and May Co. Cheryl graduated from S.U.N.Y. Albany with a bachelor of arts in political science and English.
Source: Company data Source: Company data
Table 3.1: Board of Directors composition, position, cash remuneration, stock awards and total remuneration of the2018 fiscal year.
Board of Directors Position Cash Remuneration Stock Awards Total Remuneration Emanuel Chirico Chairman $ - $ - $ - Mary Baglivo Corporate Responsibility Committee $ 102 500,00 $ 145 136,00 $ 247 636,00 Brent Callinicos Corporate Responsibility Committee $ 95 000,00 $ 145 136,00 $ 240 136,00 Juan R. Figuereo Chairman Audit & Risk Management
Committee $ 125 000,00 $ 145 136,00 $ 270 136,00 Joseph B. Fuller Chairman Nominating, Governance &
Management Development Committee $ 110 000,00 $ 145 136,00 $ 255 136,00
Judith Amanda Sourry Knox
Chairman Compensation Committee; Nominating, Governance & Management Development Committee
$ 105 000,00 $ 145 136,00 $ 250 136,00 V. James Marino Audit & Risk Management Committee $ 105 000,00 $ 145 136,00 $ 250 136,00 Geraldine McIntyre Chairman Corporate Responsibility
Committee $ 110 000,00 $ 145 136,00 $ 255 136,00 Amy McPherson Audit & Risk Management Committee $ 105 000,00 $ 145 136,00 $ 250 136,00
Henry Nasella
Director; Compensation Committee; Nominating, Governance & Management Development Committee
$ 160 000,00 $ 145 136,00 $ 305 136,00 Edward Rosenfeld Audit & Risk Management Committee $ 105 000,00 $ 145 136,00 $ 250 136,00
Craig Rydin
Compensation Committee; Nominating, Governance & Management Development Committee
$ 110 000,00 $ 145 136,00 $ 255 136,00
Table 3 2: Executive Officers composition, position and total remuneration of the 2018 fiscal year.
Executive Officers Position Total Remuneration
Emanuel Chirico Chairman and Chief Executive Officer,
PVH Corp. $ 17 065 604,00 Michael A. Shaffer Executive Vice President and Chief
Operating & Financial Officer, PVH Corp. $ 4 909 297,00 Francis K. Duane Vice Chairman, PVH Corp. and Chief
Executive Officer, Heritage Brands $ 6 872 385,00 Daniel Grieder Chief Executive Officer, Tommy Hilfiger
Global and PVH Europe $ 4 676 440,00 Cheryl Abel-Hodges Chief Executive Officer, Calvin Klein $
-10
4. World Economic Outlook
According with IMF World Economic Outlook (2019), global growth, which peaked at close to 4% in 2017, softened to 3.6% in 2018 (Fig.4.1), and is projected to decline further to 3.3% in 2019 and then picking up to 3.6% in 2020 (Fig.4.2).
The decline in global growth is due to the intensification of U.S.-China trade tensions, that threat global technology supply chains; the continuing uncertainty surrounding Brexit; and to the rising geopolitical tensions that roiled energy prices. GDP releases so far this year, together with generally softening inflation, point to weaker-than-anticipated global activity. Investment and demand for consumer durables have been subdued across all economies as firms and households continue to hold back on long-term spending. Accordingly, global trade, which is intensive in machinery and consumer durables, remains sluggish.
The projected pickup in global growth in 2020 is precarious and relies importantly on several factors: financial market sentiment staying generally supportive; continued fading of temporary drags, notably in the euro area; stabilization in some stressed emerging economies, such as Argentina and Turkey; and avoiding even sharper collapses in others, such as Iran and Venezuela.
For advanced economies, growth is projected at 1.9% in 2019 and 1.7% in 2020 (Fig.4.4).
•
United States: growth is projected at 2.6% in 2019, moderating to 1.9% in 2020 as the fiscal stimulus unwinds. The robust exports and inventory accumulation are offset by a softer domestic demand and imports, in part reflecting the effect of tariffs, leading to a slowing momentum.• Euro Area: growth is projected at 1.3% in 2019 and 1.6% in 2020. Germany faces weaker external demand, which also weighs on investment; in France fiscal measures are expected to support growth and the negative effects of street protests are dissipating; Italy faces uncertain fiscal outlook and weak domestic demand and by contrast Spain presents strong investment and weak imports. • United Kingdom: growth is projected at 1.3% in 2019 and 1.4% in 2020, due to
high uncertainty related to Brexit.
• Japan: growth is projected at 0.9% in 2019 supported by inventory accumulation and a large contribution from net exports due to the sharp fall in imports, thus masking subdued underlying momentum. Growth is projected to decline further to 0.4% in 2020.
The emerging market and developing economy group is expected to grow at 4.1% in 2019, rising to 4.7% in 2020, reflecting downward revisions in all major regions (Fig.4.5).
• Emerging and developing Asia: growth is projected to soften to 6.2% in 2019–20, largely reflecting the impact of tariffs on trade and investment. China’s growth is forecast to soften to 6.2% in 2019 and to 6% in 2020, because of the negative effects of escalating tariffs and weakening external demand have added pressure to an economy already in slowdown. India’s economy is also set to grow more slowly, reaching 7% in 2019 and 7.2% in 2020, due to a weak outlook for domestic demand (Fig.4.6).
• Emerging and developing Europe: region is expected to grow at 1% in 2019 and 2,3% in 2020. The subdued outlook largely reflects the projected growth slowdown in Turkey. -4,0% -2,0% 0,0% 2,0% 4,0% 6,0% 8,0% 10,0%
Advanced economies Emerging market and developing economies World
Source: IMF 2019. 0,0% 1,0% 2,0% 3,0% 4,0% 5,0% 6,0% 2012 2013 2014 2015 2016 2017 2018 2019 2020F 2021F 2022F 2023F 2024F Advanced economies
Emerging market and developing economies World Source: IMF 2019. 0 1000 2000 3000 4000 5000 6000 7000 8000 2000 2001 2002 2003 2004 2005 2006 2007 2008 2009 2010 2011 2012 2013 2014 2015 2016 2017 2018 2019 2020F 2021F 2022F 2023F 2024F
Advanced Economies Emerging and Developing Asia Emerging Market and Developing Economies
Source: IMF 2019. Source: IMF 2019. 0,00% 0,50% 1,00% 1,50% 2,00% 2,50% 3,00% 3,50% 2017 2018 2019F 2020F
Advanced Economies United States
Euro Area United Kingdom
Japan
Fig.4.1: GDP Annual Growth from 2000 to 2018.
Fig.4.2: GDP Annual Growth and Forecast for the World, Advanced and Developing Economies from 2012 to 2024.
Fig.4.3: Population, in millions, from 2020 to 2024.
Fig.4.4: GDP Annual Growth and Forecast for the Advanced Economies from 2017 to 2020.
11
• Latin America: expected to grow at 0.6% in 2019, recovering to 2.3% in 2020. The slow growth reflects Brazil’s weak sentiment and high uncertainty; Mexico’s weak investment, slow private consumption, policy uncertainty, weakening confidence and rising borrowing costs; the humanitarian crisis and economic implosion in Venezuela; and the slow growth projected to Argentina and Chile.
• Middle East, North Africa, Afghanistan, and Pakistan region: growth is expected to be 1.0% in 2019, rising to about 3% in 2020. The difficult outlook for the region is largely due to the tighter US sanctions on Iran and civil strifes on Syria and Yemen. Partially offsetting these developments are improved prospects for Saudi Arabia’s economy—the non-oil sector is expected to strengthen in 2019 with higher government spending and improved confidence, and in 2020 with an increase in oil sector growth. • Sub-Saharan Africa: growth is expected at 3.4% in 2019 and 3.6% in 2020.
Higher and volatile oil prices have supported the outlook for Angola, Nigeria, and other oil-exporting countries. But growth in South Africa is expected at a more subdued pace, reflecting a of strike activity and energy supply issues in mining and weak agricultural production.
• Commonwealth of Independent States: is projected to grow slowly at 1.9% in 2019 and at 2.4% in 2020, due to a downgrade to Russia’s Outlook.
Inflation
Inflation is projected to remain broadly at current levels for the advanced economy group, while for the emerging market and developing economy group, it is set to resume its steady decline of the past decade (Fig.4.7).
Consistent with the softer outlook for commodity prices and the expected moderation in growth, inflation is expected to decline to from 2% to 1.6% this year in advanced economies. With the US economy operating above potential this year and next, core inflation is expected to exceed the medium-term target of 2%, and decline to target thereafter. In the euro area, core inflation is expected to gradually increase from 1.2% in 2018 to about 2% in 2022 as the economy is operating above potential. Japan’s core inflation rate (excluding fresh food and energy) is projected to rise to 1.4% by the end of 2020, softening back to about 1.3% in the medium term (Fig.4.8). Inflation in emerging market and developing economies is stable across most regions and is expected to rise from 4.8% to 4.9% this year, reflecting developments in a few economies. As they fade, and growth stabilizes across the emerging market and developing economy group, inflation is set to moderate to about 4% over the medium term. Source: IMF 2019. 0,00% 1,00% 2,00% 3,00% 4,00% 5,00% 6,00% 7,00% 2017 2018 2019F 2020F
Developing Economies Emerging and Developing Asia Emerging and Developing Europe Latin America and the Caribbean Middle East, North Africa, Afghanistan, and Pakistan Sub-Saharan Africa Commonwealth of Independent States
5,40% 5,60% 5,80% 6,00% 6,20% 6,40% 6,60% 6,80% 7,00% 7,20% 7,40% 2017 2018 2019F 2020F Emerging and Developing Asia China India
Source: IMF 2019. 0% 1% 2% 3% 4% 5% 6% 7% 2012 13 14 15 16 17 18 19F 20F 21F 22F 23F 24F
Advanced economies Developing Economies World
Source: IMF 2019. -0,50% 0,00% 0,50% 1,00% 1,50% 2,00% 2,50% 3,00% 2012 13 14 15 16 17 18 19F 20F 21F 22F 23F 24F
Japan United States Advanced economies Euro area
Source: IMF 2019.
Fig.4.5: GDP Annual Growth and Forecast for the Developing Economies from 2017 to 2020.
Fig.4.6: GDP Annual Growth and Forecast for the Emerging and Developing Asia from 2017 to 2020.
Fig.4.7: Inflation Rate, Average Consumer Prices (Annual percent change), for the World, Advanced and Developing Economies, from 2012 to 2024.
Fig.4.8: Inflation Rate, Average Consumer Prices (Annual percent change), for the Advanced Economies of Japan, U.S. and Euro area, from 2012 to 2024.
12
5. Luxury Fashion, The Industry
Luxury Fashion can be defined as an industry where products are used for self-grooming purposes such as apparels, shoes, hard luxury, beauty products and jewelry. The segment accounted for 23% of the Luxury Goods Market in 2018, with a worldwide total revenue of $61 billion in 2018YE and it is expected to increase to $80 billion by 2023YE (Fig.5.1). It’s an industry characterized by polarization, with the top 20 companies in the industry accounting for 97% of economic profit, while an increasing proportion of publicly-traded fashion companies struggle to create any economic value (Fig.5.2; 5.3).
This industry has been facing several changes in the past decades, where changing economic trends, rapid digital transformation and evolving consumer preferences created a completely different competitive landscape over the years. Consumer’s behavior has changed throughout the years, starting with the “millennials”, which are primarily using digital channels to keep up with trends, so companies are continuously investing to improve their digital and social presence not only through their website and social media networks, where they use fashion bloggers and influencers, but also in stores with the use of tablets (to manage inventories) and the implementation of large touch screens.
The potential growth of the industry is weakened by the slightly slower global growth, potential disruption to trade relationships and uncertainty related to Brexit. Latin America, Middle East, Africa and Russia are experiecing more economic and political challenges, which will likely decrease consumer spending. Europe is facing a slowdown and US growth may have peaked in 2018. Emerging Asia Pacific countries and much of emerging Europe, on the other hand, will continue to see strong spending growth with more global players entering these markets.
According to data from McKinsey’s FashionScope, besides the potential disruption from geopolitical and macroeconomic events, 2019 will be a year shaped by consumer shifts linked to technology, social causes and trust issues.
The top priorities are developing omnichannel capabilities, as the industry is digitizing and consumers increasingly demand faster distribution; satisfy consumer demands for ultra-transparency and sustainability, as concerns about the environment rise among consumers and companies; and enhance productivity and resilience, as the outlook is increasingly uncertain.
Regardless of size and segment, players now need to be nimble, think digital-fist and achieve ever-faster speed to market. They need to take an active stance on social issues, invest in transparency and sustainability, and, most importantly, have the courage to “self-disrupt” their own identity and the sources of their old success in order to realize these changes and win new generations of customers.
India
Economic expansion is happening across Asia, and according to data from McKinsey’s FashionScope, 2019 will be the year in which India will take center stage. The country is being propelled by strong macroeconomic tailwinds and is predicted to grow 8% YoY between 2018 and 2022. The Indian middle class is forecast to expand at 19.4% a year over the same period, outpacing China, Mexico and Brazil. India’s apparel market will be worth $59.3 billion in 2022, making it the sixth-largest in the world, and comparable to the UK ($65 billion) and Germany ($63.1 billion), according to data from McKinsey’s FashionScope. The aggregate income of the addressable population is expected to triple between now and 2025, and higher incomes are likely to result in higher spending.
The supply side of the industry is equally robust, and the growth of textile and apparel exports is expected to accelerate. India’s average labor cost is significantly lower
-18 -47 -34 18 3 6 100 144 128 2005-2015 2016 2017 Bottom 20% 21-80% Top 20%
Source: McKinsey Global Fashion Index (MGFI) 108% 93% 70% 73% 81% 86% 86% 97% 101% 97% 2008 2009 2010 2011 2012 2013 2014 2015 2016 2017
Source: McKinsey Global Fashion Index (MGFI)
Source: Bain & Company
Fig.5.1: Share of global personal luxury goods market, by category (€ billions).
Fig.5.2: Fashion companies’ contribution to industry economic profit 2005-2015 vs. 2016 vs. 2017 %, based on publicly listed companies.
Fig.5.3: Top 20 fashion companies‘ contribution to industry economic profit 2008-2017 %, Based on publicly listed companies.
13
than China’s and comparable with Vietnam’s. There is also a high availability of raw materials (e.g., cotton, wool, silk, and jute), which enable participation in the entire fashion value chain.
The bigger challenge is the poor quality of India’s infrastructure. Still, many brands are determined to take advantage of India’s blossoming growth. The majority are likely to choose one of three routes. First, players can partner with existing e-commerce platforms. This is most suitable for players with little brand awareness and with relatively low capital to invest, and offers a good way to test demand and customer preferences. Second, brands that have little local knowledge and are looking for fast entry can enter with a franchise model, developing physical retail spaces. Finally, players that have significant local knowledge and capital resources can create fully owned and operated stores.
Despite structural challenges that include inequality, infrastructure and market fragmentation, McKinsey’s FashionScope expects strong economic growth, scale and rising tech-savviness will combine to make it the next big global opportunity in fashion and apparel.
Trade Tensions
Some fashion companies have begun to reconsider their presence in, and exposure to, countries where tariff barriers could further increase the cost of doing business. Fast fashion, which depends on short lead times, will need to find new strategies to maintain delivery speed and production quality, for example through near-shoring or even on-shoring. Still, tough commercial decisions will be required in the face of tariffs in key consumer markets. Luxury players, especially those that derive most of their income from China or the US, may be required to choose between raising prices or managing squeezed margins.
China
The rise in aggregated income have increased significantly the Chinese middle class and consumers are now using their new spending power to express their own tastes through fashion. China is no longer the factory of the world, it is the world’s fastest-growing consumer market, accounting for more than 18% of all final goods consumed and 22% of personal luxury goods (Fig.5.4, Fig.5.5).
As China reaches a new stage of industrial maturity, it is continuing to develop its own domestic supply chains to meet rising domestic consumer demand. It is able to do this successfully because it has capabilities and capacity in every stage of textile production, from the cultivation of raw materials through fabric weaving, dyeing, finishing and sewing final garments. Automation technologies should ensure that China remains a powerhouse of global apparel production even as its wages rise.
Sustainability
Younger consumers are seriously concerned with social and environmental causes, which many regard as being the defining issues of our time. They increasingly back their beliefs with their shopping habits, favoring brands that are aligned with their values and avoiding those that don’t.
Despite the many associated risks, some large brands will be willing to court controversy to express beliefs, particularly luxury players, which will seek to attract younger consumer groups looking to trade up. There are clear benefits from doing so, and the more that companies express an authentic view, the more that those who don’t will be exposed.
Source: Bain & Company
Source: Bain & Company
Fig.5.4: Forecast of Share of global personal luxury goods market, by region in 2025.
Fig.5.5: Share of global personal luxury goods market value, by consumer nationality.