M
ASTER OF
S
CIENCE IN
FINANCE
M
ASTERS
F
INAL
W
ORK
PROJECT
EQUITY RESEARCH
:
P
FIZER
I
NC
.
A
NTÓNIO
P
EDRO DA
S
ILVEIRA E
L
ORENA
P
INTO
C
HARRUA
ii
M
ASTER OF
S
CIENCE IN
FINANCE
M
ASTERS
F
INAL
W
ORK
PROJECT
EQUITY RESEARCH
:
P
FIZER
I
NC
.
A
NTÓNIO
P
EDRO DA
S
ILVEIRA E
L
ORENA
P
INTO
C
HARRUA
S
UPERVISOR
:
P
ROF
.
D
OUTORA
C
LARA
P
ATRÍCIA
C
OSTA
R
APOSO
iii
Abstract
This project contains a detailed valuation of Pfizer Inc. This Equity Research is a
continuation of the implementation process of a new presentation format for this kind of
projects, combining the style and rules of ISEG Master Final Project and the CFA institute
(Pinto, Henry, Robison, and Stowe, 2010) recommendations.
The choice of Pfizer Inc. comes from my personal interest in the pharmaceutical industry in
general, and particularly in the capacity of companies in this industry to create value and
even with very high costs continue to perform extremely well through the years.
The price target from this valuation was computed using the most adequate method for the
purpose, the Discounted Cash Flow (DCF) approach, which was complemented with
Relative Valuation Method approach in order to support the final recommendation.
Considering the price target obtained was $37.35 representing an upside potential of 15%
when compared with the price of $32.48 in the end of 2016, the final recommendation is to
Buy, despite the risks that may occur in the future that can affect the price target. The risk
assessment estimated for Pfizer Inc. is considered to be medium.
iv
Resumo
Este projecto contém informaçao detalhada da Pfizer Inc. Este Relatório de Avaliação é
uma continuação do processo de implementação de um novo formato de apresentação
para este tipo de projecto, agregando as regras de estilo do Trabalho Final do Programa de
Mestrado do ISEG e as recomendações do CFA Institute (Pinto, Henry, Robison, and
Stowe, 2010).
A escolha da Pfizer Inc. vem do meu interesse pessoal na industria farmacêutica em geral,
e em particular pela capacidade das empresas desta industria em criar valor e mesmo com
custos muito altos, continuar a apresentar excelentes indicadores durante todos estes anos.
O preço alvo desta avaliação foi calculado usando o método mais adequado para o efeito,
o método dos Fluxos de Caixa Descontados (DCF), que foi complementado com o método
dos Múltiplos Comparáveis para sustentar a recomendação final.
Considerando que o preço alvo obtido foi de $37.35, representado um pontencial de
valorização de 15% quando comparado ao preço da ação no final de 2016, a recomendação
final é de Compra, apesar dos riscos existentes que podem after o preço alvo. O risco
estimado para a empresa é considerado um risco médio.
v
Acknowledgements
This project was a long and hard journey but very rewarding at the same time. Writing this thesis
would never be possible without the unconditional support of my family, friends and mentors.
To my dad, my mother and my sister, thank you for the unconditional support, encouragement and
valuable insights through all my life path, that made me achieve all my personal and professional
goals.
To my friends, thanks for the friendship and good moments we spent together on this journey and
thanks for the push, making sure I make it through this final work.
To my girlfriend, thanks for always having my back, for the support and patience during these
months, for the friendship and for being part of this journey.
To Professor Clara, thank you for the support, time patience and friendship during this process, I
can truly say you contributed a lot to shape me as a professional, with your guidance and advices.
It’s been an honor to learn from the finest professors from ISEG.
vi
Index
Abstract
iii
Resumo
iv
Acknowledgements
v
Index
vi
List of Figures
vii
List of Tables
ix
1. Research Snapshot
1
2. Business Description
2
3. Management and Corporate Governance
5
4. Industry Overview
7
5. Investment Summary
14
6. Valuation
15
7. Financial Analysis
21
8. Investment Risks
23
Appendices
28
References
40
vii
List of
Figures
Figure 1: Investment Grade
1
Figure 2: Pfizer Inc. offices
2
Figure 3: PFE average number of employees
2
Figure 4: Revenues by geographic area
2
Figure 5: Revenues by segment
2
Figure 6: R&D principal areas
3
Figure 7: Dividends per share
4
Figure 8: Leadership Structure
5
Figure 9: Director Independence
5
Figure 10: Types of shareholders
6
Figure 11: Share Holder Nationality
6
Figure 12: Global GDP growth
7
Figure 13: Advanced and Developing Economies GDP growth
7
Figure 14: China GDP growth and inflation
7
Figure 15: US GDP growth and inflation
7
Figure 16: Industry R&D spending
8
Figure 17: Industry Job Creation
8
Figure 18: Worldwide sales at risk
8
Figure 19: Worldwide total prescription of drug sales
9
Figure 20: World population structure
9
Figure 21: Pharma market sales
9
Figure 22: People with Chronic Disease
9
Figure 23: World spending on medicines
10
Figure 24: Peer Group market share
11
Figure 25: Porter´s five forces.
12
Figure 26: PFE Total Revenue Forecast
15
Figure 27: World consumption
15
Figure 28: PFE Costs of Goods & Services
16
Figure 29: Operating Expenses
16
Figure 30: P&L performance
21
Figure 31: EBIT/EBITDA Margin
21
viii
Figure 33: PFE risk matrix
23
Figure 34: PFE market risks
23
ix
List of Tables
Table 1: Risk Assessment
1
Table 2: Market Profile
1
Table 3: Valuation Output
1
Table 4: Financial Highlights
1
Table 5: Leading product by segment
3
Table 6: Leading product by segment
3
Table 7: Cost reduction initiatives
4
Table 8: Committees resume
5
Table 9: Top Investors
6
Table 10: Pharmaceutical industry value chain
8
Table 11: U.S. Dollar Currency Index
10
Table 12: Pfizer Inc. Rating
10
Table 13: PFE senior unsecured long-term debt
10
Table 14: Pfizer Inc. Peer Group
11
Table 15: Peer group market share
11
Table 16: Pfizer Inc. Peer Group
11
Table 17: SWOT analysis of PFE
12
Table 18: Investment Grade and Risk classification matrix
14
Table 19: Discounted Cash Flow Valuation.
14
Table 20: Multiples Valuation Approach.
14
Table 21: Growth Forecast by Region
15
Table 22: Net Debt Forecast
16
Table 23: DCF Output
17
Table 24: EBIT assumptions
17
Table 25: EBIT Forecast
17
Table 26: FCFF Forecast
18
Table 27: DCF assumptions resume
18
Table 28: Alpha computation
18
Table 29: EV/EBITDA Multiple
19
Table 30: P/B Multiple
19
Table 31: Multiples output
19
Table 32: Peer Analysis
20
Table 33: Multiples output
20
x
Table 35: Summary Financial Performance
22
Table 36: PFE list of medicines waiting for approval by FDA
23
Table 37: Change in Terminal Growth Rate
25
Table 38: Change in WACC
25
Table 39: Change in ERP
26
Table 40: Change in Beta
26
Table 41: Change in Tax Rate
26
Table 42: Change in Terminal Growth and WACC
27
1
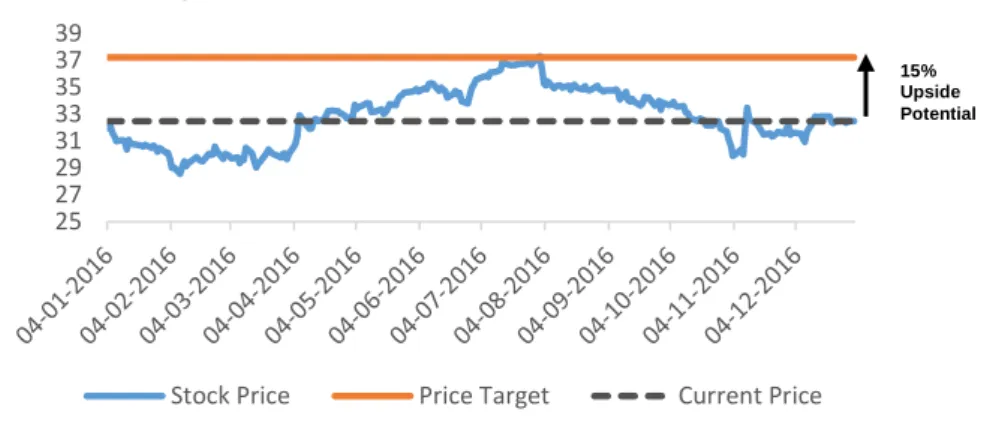
Price Target of $37.35, 15% Upside Potential, Medium risk; Final Recommendation: Buy).
Stock Value
Source: Bloomberg
Our final recommendation for Pfizer Inc. stands for Buy, with a price target of $37.35 and an upside potential of 15%, comparing to the last closing price of 2016.
The price target was computed using Discounted Cash Flow approach as the principal model. We also used Relative Valuation model to support DCF valuation in which we reach a price target of $37.66 and an upside potential of 16%. With this price target derived from both valuation models it is possible to conclude that Pfizer Inc. is currently undervalued.
Regarding risk assessment, we considered that PFE has a Medium Risk of Investment due to the current business challenges the company is facing nowadays. The Innovative Health segment is the main driver of company sales, and it is expected that it will still account for the major part of revenues in the future. Pfizer Inc. EBIT is forecasted to grow in the next five years due to an expected global rise in terms of revenues around 6% for companies on this industry, and Pfizer Inc. will still be a big player in this industry consequently influenced by this trend.
From our forecast values, it is expected that Pfizer Inc. profitability will increase in the next five years, being possible to say that those years will mark financial recovery. It is also expected that the company will still perform very expressive values in terms of investments, to increase probability of a potential blockbuster in the pipeline of products.
Table 4: Financial Highlights
Source: AC analysis, Millions of US Dollars. 25 27 29 31 33 35 37 39
Stock Price Price Target Current Price
2016 2017F 2018F 2019F 2020F 2021F Perp. Revenues 52,824 56,152 59,689 63,450 67,447 71,696 74,349 COGS 12,329 11,679 12,415 13,197 14,028 14,912 15,464 Op. Expenses 28,489 30,689 32,623 34.678 36,863 39,185 40,635 EBIT 12,006 13,784 14,652 15,575 16,556 17,599 18,251
1. Research Snapshot
Pfizer Inc
.
Buy
Medium Risk
October 2017 United States
Table 1: Risk Assessment
Source: AC analysis
LOW MEDIUM HIGH
Table 2: Market Profile
Source: AC analysis Moody’s Rating A1 Last Price $32.48 Price Target $37.35 Ticker PFE Industry Pharmaceutical
Table 3: Valuation Output
Source: AC analysis
Valuation Output
DCF $37.35
Multiples $37.66
Figure 1: Investment Grade
Source: BPI risk matrix
LOW RISK MEDIUM RISK HIGH RISK BUY >15% >20% >30% HOLD >5% and <15% >10% and <20% >15% and <30% REDUCE >-10% and <5% >-10% and <10% >-10% and <30% SELL <-10% <-10% <-10% 15% Upside Potential
2
PFIZER INC. (PFE) is an American pharmaceutical corporation, dedicated to develop and discover medicines, vaccines and healthcare products that can provide advance wellness, prevention, treatments and cures that challenge the most feared diseases of our time. PFE is listed on NYSE since June 1942, and at the time the first big launch was achieved with a product able to treat intestinal worms in the most successful way. Thenceforward Pfizer has been applying science and bringing therapies that improved and extended human life, becoming one of the largest pharmaceutical companies in the world (Figure 2), with headquarters in New York City and with a total average number of 96,500 employees (Figure 3).
The firm currently manages its commercial operations through two different business segments: Pfizer Innovative Health (IH) and Pfizer Essential Health (EH). From the beginning of 2014 fiscal year until the second quarter of 2016, these operations were managed by different business segments, but from now on the firm will manage its operations assigning to each segment (IH and EH) the responsibility for their own commercial activities and for certain R&D projects.
The Pfizer Innovative Health (IH) segment is focused on developing and commercializing new, value-creating medicines and vaccines that significantly improve patients’ lives, as well as products for consumer healthcare. In this segment the key therapeutic areas include internal medicine, vaccines, oncology, inflammation & immunology, rare diseases and consumer healthcare.
The Pfizer Essential Health (EH) segment contain legacy brands that already lost or will soon lose exclusivity in developed and emerging markets, generic sterile injectable products, branded generics, infusion systems and biosimilars. This segment also includes R&D organization, as well as contract manufacturing business.
The majority of PFE revenues come from the manufacture and sale of biopharmaceutical products. Regarding this, it is important to consider that this industry is highly competitive and regulated, resulting in a considerable number of factors and challenges that can have a strong impact in the company’s results. The main challenges and factors comprise among others: healthcare legislation, the regulatory environment, pipeline productivity, the loss or expiration of intellectual property and rights, pricing and access pressures and competition and the expiration of co-promotion and licensing rights, as well as the results of the global economic environment. Despite the challenges the industry faces, Pfizer Inc. has been recording reasonable values in terms of sales through the years, and that can be expressed by the $52.8 Billion recorded in 2016 that represents an approximate 8% growth compared to the previous year. In 2016, international revenues represented 50% of total revenue (Figure 4). Also in 2016, 55% of total revenue was derived from Pfizer Innovative Health (IH), and 45% of the total revenue came from Pfizer Essential Health (EH) as can be observed in Figure 5.
Since Pfizer Inc. develops its operations in such a competitive industry sector like the pharmaceutical one, the company makes a massive effort fighting the patent protection, that once it expires, exposes the specific product from the company pipeline that it is intended to protect, and allows competitors to create a biosimilar product which plays basically the same role has the one the company created previously. In such a situation, generic competition starts and the price of the impacted products drops, having a significant adverse effect on PFE revenues. This a normal reality for the company that seeks for constant innovation and strives for new potential blockbuster products that can offset future losses occurred due to the patent expiration and generic competition.
Figure 2: Pfizer Inc. offices
Source: Company data
Notes: Pfizer has office’s spread worldwide.
Figure 3: PFE average
number of employees
Source: Thomson Reuters.
Figure 4: Revenues by
geographic area
Source: Pfizer Inc. financial data, Millions of US Dollars
Figure 5: Revenues by
segment
Source: Pfizer Inc. financial data
78,3 97,9 96,5 0 20 40 60 80 100 120
FY14A FY15A FY16A
# e mp lo ye e s i n th o u san d s 0 5000 10000 15000 20000 25000 30000 2014 2015 2016 55% 45% IH EH
2. Business Description
3
Company strategy:
Pfizer Inc. believes that the medicines developed by its teams create significant value for patients and healthcare providers, improving treatment of diseases and reducing emergency and hospitalization costs. The company is in constant effort looking for the best way to work with patients, physicians and payers to prevent and treat diseases and improve outcomes. In order to maximize patient access and minimize any adverse impact on revenues, the company is still working within the current legal and pricing structures, reviewing pricing agreements and contracting methods with payers and insurance companies, remaining strictly devoted to the main purpose of innovating and bringing therapies to patients that could extend and significantly improve their lives.
Commercial Operations: Pfizer Inc. now manages commercial operations through two different segments, Pfizer Innovative Health and Pfizer Essential Health that were reorganized officially in the second quarter of 2016. Each segment is composed by different products with different features and life stages, forming the firm’s portfolio (Table 5 and Table 6).
The company expects that the Pfizer Innovative Health (IH) portfolio of innovative, largely patent-protected, in-line and newly launched products will be sustained by constant ongoing investments allowing to develop promising assets and targeted business development in areas of focus ensuring a pipeline of very differentiated products in the most challenging areas of medical need. The products leaded by Pfizer Innovative Health are science-driven, highly-differentiated and require a huge engagement with healthcare providers and consumers, while the other segment Pfizer Essential Health (EH), aims to generate strong and consistent cash flow, giving access to effective, lower-cost, high-value treatments to patients all around the world. It is also expected that Pfizer Essential Health (EH) leverages biologic development, regulatory and manufacturing expertise to seek and to advance its biosimilar development portfolio, and also that leverages capabilities in formulation, development and manufacturing expertise to help advancing its generic sterile injectable portfolio.
Research and Development Operations: The Company is still looking to reinforce their global R&D organization and is chasing strategies intended to improve innovation and overall productivity in R&D, in order to achieve a sustainable pipeline that will deliver value in the short and long run. The firm’s primarily research focus is on the areas represent in Figure 6, and these R&D priorities include delivering a pipeline of highly-differentiated therapies and vaccines with the greatest medical and commercial commitment, innovating new capabilities that can lead PFE to a strong leadership in the long run, and create new models for biomedical collaboration that will speed up the pace of innovation and productivity. Besides the significant internal portion of R&D, the firm also seeks for promising chemical and biological lead molecules and innovative technologies developed by third parties, to incorporate in internal processes, projects and product lines through collaborations, license agreements and alliances with other companies, as well as leveraging acquisitions and debt or equity in based investments, allowing the company to share risk and cost and access external scientific and technology expertise, extremely required to advance their own products as well as in-licensed or acquired products.
Intellectual Property Rights: As part of the strategy, Pfizer Inc. prospects to continue defending aggressively their patent rights whenever appropriate, and will keep supporting efforts that impulse worldwide recognition of patent rights. The firm will also exert innovative approaches designed to avoid counterfeit pharmaceuticals from entering the supply chain and to have better mastery over the distribution of their own products, including the generic market whenever their products lose exclusivity.
Table 5: Leading product by
segment
Source: company data
Table 6: Leading product by
segment
Source: company data
Figure 6: R&D principal areas
Source: company data
IH
Prevnar 13Xeljanz EliquisLyrica-US, Japan and other markets Enbrel-Outside US and Canada Viagra
Ibrance Xtandi
Several OTC consumer products
EH
LipitorPremarin familiy NorvascLyrica-EU,Russia, Israel,Central Asia Celebrex
Pristiq
Several sterile injectable products
R&D
Biosimilars Inflamation &
Immunology Metabolic Disease and
Cardiovascular risks Neuroscience
Oncology
Rare Diseases
4
Negotiation and litigation is part of the strategy in order to pursue valid business opportunities, challenging intellectual property rights held by other firms.
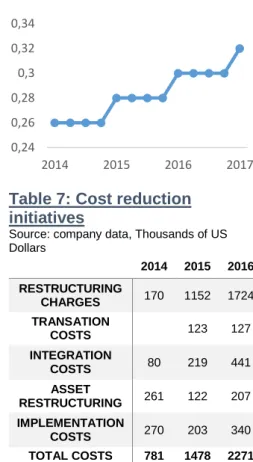
Capital Allocation and Expense Management: Part of the strategy of Pfizer Inc. is to maintain a strong balance sheet and robust liquidity for the purpose of having the financial resources required to take advantage of prudent commercial, business development and research opportunities and to directly enhance shareholders value by share repurchase and dividends method. Figure 7 represents the chart of dividend per share evolution, in which it is possible to see a clear trend of growth over time. Considering the existing significant costs related with integrating, acquiring and restructuring businesses - and in relation with PFE’s global cost reduction and productivity initiatives, that can impact all business and functions including sales, marketing, manufacturing, R&D, information technology, shared services and corporate operations - Pfizer Inc. also intends to achieve an appropriate cost structure for the company; as can be seen in Table 7 the costs associated with acquisitions and cost reduction and productivity initiatives have been increasing.
Business Development Initiatives: The firm is strictly committed to advancing its pipeline of products and maximize the value of the in-line products through alliances, joint ventures, collaborations, equity or debt based investments, dispositions and mergers and acquisitions. The company will also continue to pursue a strategic, disciplined and financial approach to evaluating opportunities to develop business that could be able to generate earnings growth and enhance shareholders value. From 2014 to the end of 2016, Pfizer Inc. already had sixteen initiatives of this kind that significantly impact the company’s results in that period.
Figure 7: Dividends per share
Source: company data
Table 7: Cost reduction
initiatives
Source: company data, Thousands of US Dollars 2014 2015 2016 RESTRUCTURING CHARGES 170 1152 1724 TRANSATION COSTS 123 127 INTEGRATION COSTS 80 219 441 ASSET RESTRUCTURING 261 122 207 IMPLEMENTATION COSTS 270 203 340 TOTAL COSTS 781 1478 2271 0,24 0,26 0,28 0,3 0,32 0,34 2014 2015 2016 2017
5
Corporate Governance:
The company believes that the optimal Board leadership structure, is composed by an independent oversight function of entirely independent directors, providing the company with strong operational performance and strengthened necessary to achieve the company goals.
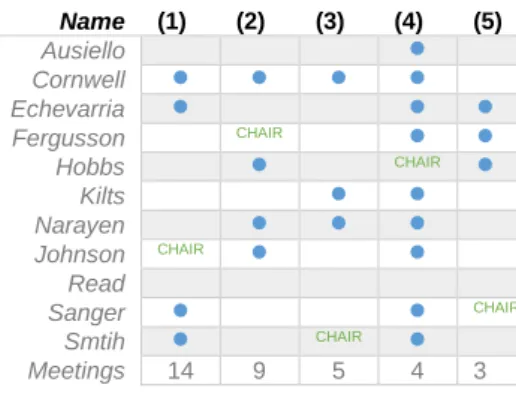
PFE’s has a leadership structure (Figure 8) composed by eleven independent directors, one lead independent director, a chairman/CEO and is organized around five committees. The committee resume is represented in Table 8.
Audit Committee (1): Consisted by Suzanne Nora Johnson as chair and also by other members like Don Cornwell, Joseph Echevarria, Stephen Sanger and James Smith, being all members independent, financially literate and qualified as Audit Committee Financial Experts. This Committee has the responsibility of overseeing Pfizer’s Enterprise Risk Management (ERM) program. This committee works together with the Legal Division and the Compliance Division ensuring that ERM is integrated in the strategic and operating planning process. It also reviews and receives regular briefings regarding Pfizer’s information security and technology risks, including discussions of the company’s information security and risk management programs.
Regulatory and Compliance Committee (2): Composed by Frances Fergusson has the chair of the committee, and other additional committee independent members, namely Don Cornwell, Shantanu Narayen, Helen Hobbs and Suzanne Nora Johnson. This committee is responsible for reviewing and overseeing Pfizer’s compliance program, evaluating its effectiveness. The committee process information about current and emerging risks and regulatory trends that may affect PFE business, operations, strategy and performance. The inherent risk are related with health care law compliance programs and the status of compliance with applicable laws, internal procedures and regulations.
Compensation Committee (3): Composed by James Smith has chair, together with other independent members like Don Cornwell, James Kilts and Shantanu Narayen. This Committee is responsible for reviewing and approving the company’s overall compensation philosophy and oversees the administration of PFE executive compensation and benefit programs, policies and practices.
Science and Technology Committee (4): This Committee is composed by the chair Helen Hobbs, and other additional independent members: namely, Dennis Ausiello, Ronald Blaylock, Don Cornwell, Joseph Echevarria, Frances Fergusson, James Kilts, Shatanu Narayen, Suzanne Nora Johnson, Stephen Sanger and James Smith. This committee is responsible for periodically examining management’s strategic direction and investment in pharmaceutical R&D and technology activities. In addition, this committee is responsible to identify emerging issues, assess the performance of R&D leaders, and evaluate the sufficiency of the review process by external scientific experts.
Corporate Governance Committee (5): This Committee is represented by Stephen Sanger, the chair of the committee, and other independent members, namely Ronald Blaylock, Joseph Echevarria, Frances Fergusson and Helen Hobbs. The responsibility of this committee consists on overseeing the practices, policies and procedures of the Board and its committees, advising on the structure Board meeting, recommending matter of consideration by the Board, and it also reviews, advises and recommends
3. Management and Corporate Governance
Figure 8: Leadership Structure
Source: proxy statement for investors 2017Table 8: Committees resume
Source: proxy statement for investors 2017
Name (1) (2) (3) (4) (5) Ausiello Cornwell Echevarria Fergusson CHAIR Hobbs CHAIR Kilts Narayen Johnson CHAIR Read Sanger CHAIR Smtih CHAIR Meetings 14 9 5 4 3
Figure 9: Director Independence
Chairman and CEOEffective leadership internally and externally
1 Lead independent director
Liaison between CEO and independent directors
11 independent directors
6
Director compensation, that is approved by the full Board. Also, the committee keeps an informed status on company issues related to public policy as well as corporate social responsibility, sustainability and philanthropy.
Lead Independent Director: The independent director of Pfizer Inc. leadership structure is Dr. Dennis Ausiello, responsible to implement the connection between the independent directors of the different committees and the CEO of the company, ensuring, following and advising all committees due to the high level of scientific expertise and deep understanding of the business required for the function. The CEO of the company is Ian Read. Table 6 summarizes all information stated above.
The company believes that the optimal Board leadership structure, is composed by an independent oversight function of entirely independent directors, providing the company with strong operational performance and strengthened necessary to achieve the company goals. Figure 9 shows the current leadership structure of Pfizer Inc.
This corporate governance structure, in which Mr. Read is the CEO and the chairman provides Pfizer Inc. a unified structure with strong consistent leadership. Having one clear leader in both roles, with deep industry expertise and company knowledge, provides decisive and effective leadership internally and externally, which is a reasonable strength for the company. Having all the independent directors providing substantial oversight on CEO’s performance, allows the directors to evaluate the effectiveness of its leadership structure and act in function of the company and shareholders best interest.
Social Responsibility:
In relation to social responsibility, Pfizer Inc. believes that everyone should have access to quality healthcare and healthy lives. The company combines different methods and approaches involving the company’s people, products and funding along with partnerships with governments, nonprofit organizations and foundations that can impact on public-health systems facilitating access to healthcare for under-served communities, which is a purpose the company wants to reach. The current portfolio of programs range from donating their own medicines, volunteering employee skills to providing grants and investments that support social entrepreneurs and enterprises, promoting healthcare delivery and local innovation. With their portfolio of programs, the company aims to impact and achieve the following goals: Building Healthcare Capacity, Expanding Access to Medicines, Promoting Corporate Citizenship.
Shareholder structure:
The Shareholder structure at 31/12/2016 had a share capital of 5,955,125,843 shares outstanding with a free float of 0.04%. Respecting the shareholder structure, on Figure 10, the majority of the shares are held by institutional investors (mainly composed by investment managers like hedge funds, insurance companies, venture capital, pension funds, private equity and other corporations) that own 71.35% of the shares, and by private investors that own 28.61% of the shares. The management team of PFE, owns less than 1% of the total shares issued by the frim. Pfizer Inc. shares are mostly held by North American investors with 85% of the shares, followed by Europe with 13% of the shares (Figure 11). Table 9 provides information on the top three investors with more than five percent participation of PFE common stock.
Figure 10: Types of
shareholders
Source: Thomson Reuters
Figure 11: Share Holder
Nationality
Source: Thomson Reuters
Table 9: Top Investors
Source: proxy statement for investors 2017
Name Shares of Pfizer common stock Percent of class Black Rock, Inc. 447,701,806 7.40% The Vanguard Group 402,108,792 6.62% State Street Corporation 322,395,016 5.31% 71% 29% Institutional investors Private investors 85% 13%2%
7
Global Economic Outlook:
According to IMF (Figure 12), the global economic outlook is favorable. From 2014 to 2016 there was a decrease in terms of global GDP growth (-8.83%), as a result of the political and financial crisis faced worldwide, meaning a drop of around 0.3% on global growth. For the coming years, the IMF forecasts that the world GDP is going to grow between 3.4% and 3.8%.
In what concerns advanced economies, it was registered also on these economies a drop on GDP (-15.8%) between 2014 and 2015, due to the impacts of negative inflation and large debts over several countries, but it is foreseen that the GDP growth rate on these countries fluctuates around 1.6% and 1.8% in the following years as Figure 13 suggests.
Emerging markets and developing economies, had a negative growth from 2014 to 2015 due to the recession some countries in Latin America faced at the time, along with a slowdown in terms of growth registered in some countries of Asia. However, it is expected by the IMF that the growth rate in the following years improves substantially, as already happened from 2015 to 2016 (Figure 13).
China Economic Outlook:
China is an important player for Pfizer Inc., due to the fact that the company is the biggest biopharmaceutical company in China, already launched 50 innovative drugs in the country until today, and has two R&D centers in China with over 10,000 employees, spread over 300 cities.
Figure 14 represents China’s GDP growth, in which it is possible to see a clear trend of decrease for the coming years, and according to the IMF it is expected that the growth rate continues do decay slowly over time. Since China’s GDP growth is slowing down, it is foreseen that in the near future China’s economy will be attracting less investment, and higher costs of borrowing. On the other hand, the chart line in Figure 14, shows an increasing tendency for inflation over time forecasted by the IMF for the following years. In what respects to China’s economic outlook, it may present moderate risk to PFE.
United States Economic Outlook:
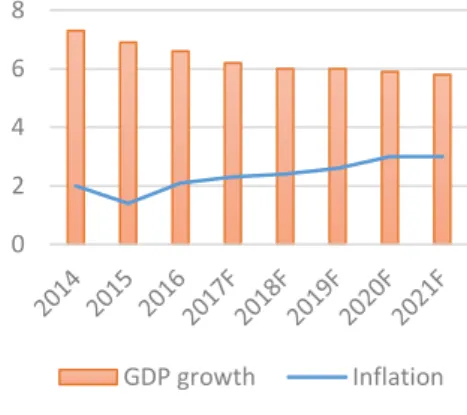
United States has a very important role in Pfizer Inc. activity, considering that is the company’s headquarters and around 50% of revenues came from this country. The policies created in this country and its economic performance are relevant to analyze future outcomes, since the United States is a big driver of the company’s activity. In what concerns GDP growth and inflation (Figure 15), it is possible to see a significant decrease in terms of GDP from 2015 to 2016, slowing down around 38.5% that was motivated by strong consumption and firm labor market counterbalanced by the weakness in nonresidential investment, dollar appreciation, financial turbulence earlier in the year, and big policy uncertainty related to electoral cycle that contributed to a swing on the headline growth number of GDP. However, the IMF forecast that the GDP growth will improve in the following years.
The inflation rate registered a very low value in 2015 (0.1%), but it increased quickly in the following year, since the United States’ Federal Reserve managed to decrease interest rates in order to target an inflation rate at 2%, a level high enough to encourage a healthy level of consumer spending and also protecting from risks of deflation that could lead the economy to slowing down. The IMF forecasts that the inflation in coming years will continue to increase until 2017, and fluctuate around 2.4% over time. The United States outlook seems favorable for Pfizer Inc.
4. Industry Overview
Figure 12: Global GDP growth
Source: International Monetary Fund, Growth in PercentageFigure 13: Advanced and
Developing Economies GDP
growth
Source: International Monetary Fund, Growth in Percentage
Figure 14
:China GDP growth
and inflation
Source: International Monetary Fund, in Percentage
Figure 15
:US GDP growth and
inflation
Source: International Monetary Fund, in Percentage 3,4 3,2 3,1 3,4 3,6 3,7 3,7 3,8 2,5 3 3,5 4 1,9 2,1 1,6 1,8 1,8 1,8 1,7 1,7 4,6 4 4,2 4,6 4,8 5 5,1 5,1 0 1 2 3 4 5 6 Advanced economies
Emerging market and developing economies
0 2 4 6 8 GDP growth Inflation 0 1 2 3
8
Pharmaceutical Industry Overview:
The pharmaceutical industry is composed by companies engaged in researching, developing, manufacturing and distributing drugs for human and veterinary use. The new medicines discovered by those companies have a huge impact on global health, prosperity and economic productivity by saving lives, increasing life spans, preventing surgery, diminishing pain suffering, and shortening hospital patients list. Advances in medicines have eliminated deadly diseases and help controlling life-threatening conditions. The innovative medicines developed by those companies are chemically derived and are developed through extensive R&D and clinical trials. These innovating products rely on patents, regulatory data protection and other forms of intellectual property rights (IPR) to justify the investment needed to bring products to the market. In the United States the patent term is 20 years, and medicines are eligible to have at least 5 years of market exclusivity depending on the time between patent validity and U.S. Food and Drug Administration (FDA) approval. This industry is highly dependent on the development of new molecules to replace revenue stream of older drugs that are approaching the expiration of their patent terms, and the pricing of the new products is designed to cover future and past expenditures on R&D. In the United States, upon patent expiration, a manufacturer can produce a generic medicine that is basically a copy of the innovative pharmaceuticals containing the same active ingredients and are identical in what concerns to strength, dosage and form of administration.
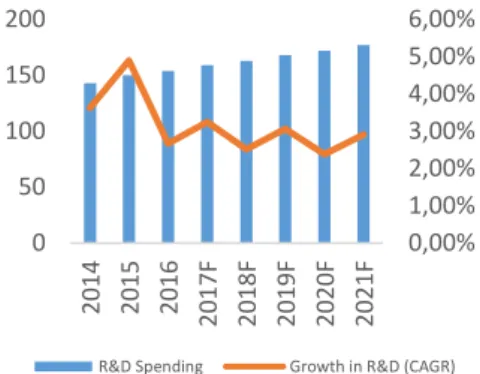
In the United States the pharmaceutical industry represents the largest share in terms of R&D business, accounting for approximately 17% of all R&D spending in the U.S. which means this industry invests 12 times more in R&D per employee and has the highest growth rate (CAGR of 2.8%) in R&D investments across all manufacturing industries (Figure 16). The investments in this industry not only bring new medicines for patients but they also give strength to the U.S. economy, since they create high-quality and high-wage R&D and manufacturing jobs all over the country, creating around 4.5 million direct, indirect and induced jobs (Figure 17).
Regulatory environment:
The loss or expiration of intellectual property rights and the expiration of co-promotion and licensing rights can have a notable unfavorable effect on the industry. Each company of the industry has a portfolio of branded products with multiple patents expiring at different dates. Once patent protection has expired, companies lose exclusivity on their products, and generic pharmaceutical manufacturers are able to produce identical products and sell them afterwards for a lower price. Each company of this industry is particularly affected by this issue, with Figure 18 representing the worldwide sales at risk from patent expiration and the respective forecast for the following years.
The process of launching a product represented in Table 10 is regulated by the U.S. Food and Drug Administration (FDA), having a special role in approving to test the new medicine in humans.
As part of the pharmaceutical industry, Pfizer Inc. revenues and product approval are dependent on the FDA, being the company along with all competitors reliant on the parameters imposed by the regulator, this representing a lower risk for the company, because of the previous knowledge of the standards FDA is ruled by.
Table 10
:Pharmaceutical industry value chain
Source: AC analysis
Research Development Manufacturing Regulatory &
market access
Marketing and Sales
Figure 16: Industry R&D
spending
Source: Evaluate Pharma World preview 2016, Millions of US Dollars.
Figure 17: Industry Job Creation
Source: PhRMA 2016 industry profile
Figure 18
:Worldwide sales at
risk
Source: Evaluate Pharma World Preview 2016, Millions of US Dollars. 0,00% 1,00% 2,00% 3,00% 4,00% 5,00% 6,00% 0 50 100 150 200 2014 2015 2016 2017F 2018F 2019F 2020F 2021F
R&D Spending Growth in R&D (CAGR)
1,882,000 Induced Jobs
Additional Private Economy Activity
1,710,000 Indirect Jobs
Vendors and Suppliers
854,000 Direct Jobs
Innovative Biopharmaceutical Industry
0 10 20 30 40 50 60
9
Demand and Supply:
The consumption of medicines is represented in Figure 19, in which it is possible to identify a growing trend from 2014 to 2016, and a forecasted growth rate of 6.2% for the coming years until 2021. The demand for medicines is measured by its medical prescription, and is influenced by demographic and economic trends, including a rapidly aging world population and an associated rise in chronic diseases, increased urbanization and higher disposable incomes, greater government expenditures on healthcare and growing demand for more effective treatments.
The actual world population is currently growing, being nowadays 7.5 billion. As it grows, populations also becomes older and more sedentary. If previous trends are held constant many of those people will necessarily have health problems in the future. Figure 20 helps supporting the idea that currently Europe’s and North America’s population is getting older, which increases the use of specific drug therapies, but it also suggests that actual population structure in emerging economies like Asia, Latin America and Africa, make companies want to shift towards those economies, where pharmaceutical sales are forecasted to expand at higher rates. Further reforms of legislative systems, especially regarding patent protection and enforcement, as well as improving regulatory conditions, make these markets increasingly attractive for companies of the pharmaceutical industry, in spite of the immensity of challenges of political, cultural, social and religious order. Despite the fact there is real uncertainty across all matters lived on those emerging economies, in 2016 the global pharmaceutical industry generated around 30% of its total sales in emerging markets (Figure 21), a growing trend percentage through the last 10 years.
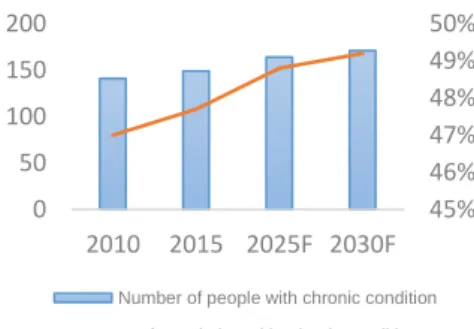
Another driver of consumption of medical therapies developed by the pharmaceutical industry is the increasing number of chronic diseases, which are generally an incurable illness or condition, such as heart disease, asthma, cancer and diabetes. In the United States the prevalence of chronic diseases, complications and risk factors climbed over the years and are forecasted to climb even more in the following years (Figure 22). Actually, around 47.7% of the population in the U.S., or 149 million residents, are living with one or more chronic conditions, and the number of people with chronic diseases and risk factors along with the aging factor combined, are forecasted to continue up swinging in the next years, which will drive up the total demand for medicines produced by the pharmaceutical industry. In addition, there is an increasing trend on world healthcare expending by governments, the U.S. being the world leader of expenses in percentage of GDP. In the United States the healthcare expenses are projected to grow at an average rate of 5.8% from 2015 to 2025, reaching in 2016 for the first time $10,000 per capita spending, which will definitely contribute for the seeking of new medicines and therapies and rising consumption of the new developed therapies produced by the pharmaceutical industry. The current consumption of medicines present a favorable outlook for Pfizer Inc.
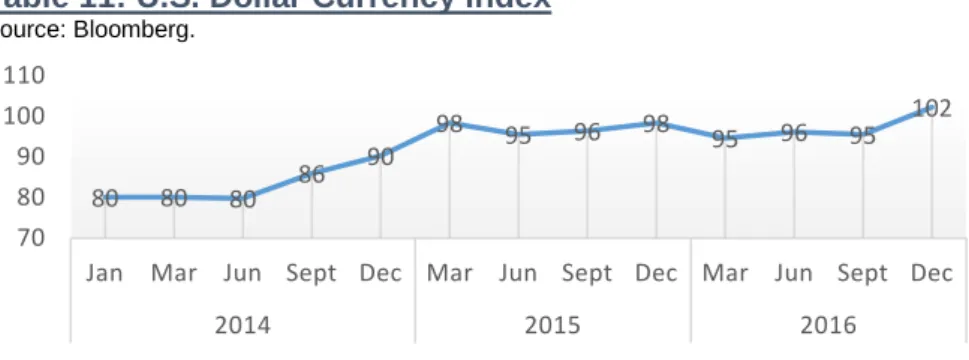
The supply of medicines is influenced by exchange rates affecting companies’ profitability, and sales whether they made marketing and pricing adjustments in order to control for potential losses. The dollar increase has been a reality (Table 11), the valuation of this currency has been so quick that major companies struggle to adjust. U.S. companies in the pharmaceutical industry are finding to their products becoming more expensive to foreign buyers, which might slow the sales rate and strain export negotiations, making companies face difficult decisions on pricing and market strategy. In Table 11, it is possible to see that the U.S. Dollar currency index, which indicates the general international value of the dollar computing the average of the exchange rates between U.S. Dollar and other world currencies, has been growing. The forecast made by Bloomberg Composite indicates that the currency will depreciate from 2016 to 2019, due to the monetary policies indicating an increase in Fed Funds Rate in the following years. The exchange rate represents a moderate risk for Pfizer Inc.
Figure 19
:Worldwide total
prescription of drug sales
Source: Evaluate Pharma World Preview 2016, Millions.
Figure 20
:World population
structure
Source: Statista
Figure 21
:Pharma market sales
Source: PWC, Pharma emerging markets
Figure 22: People with Chronic
Disease
Source: Public Health: Chronic Disease Driver Forecast in U.S., Millions.
0 200 400 600 800 1000 1200
Rx excl. orpahn and generics Orphan Generics
16% 19% 41% 25% 26% 17% 15% 4% 8% 8% E U R O P E N O R T H A M E R I C A A F R I C A A S I A L A T I N A M E R I C A Under 15 years Over 65 years
14% 20% 30% 86% 80% 70% 0% 20% 40% 60% 80% 100% 2006 2011 2016 Emerging Markets Rest of the World
45% 46% 47% 48% 49% 50% 0 50 100 150 200 2010 2015 2025F 2030F
Number of people with chronic condition % of population with crhonic condition
10
Table 11: U.S. Dollar Currency Index
Source: Bloomberg.
The price of medicines has been under discussion for many years, and pharmaceutical companies know very well that a new medicine development takes an average 12 years to develop from the initial discovery stage to reach the market and consumers, and the costs of developing those drugs are enormous with a very small percentage of the prototypes reaching the market. The risk involved in developing a new successful therapy is huge. Considering the substantial amounts of spending’s in R&D that makes it a resource intensive process, the challenge for this industry is to balance prices in a way that of diminishes the actual tension of those companies in keeping shareholders happy and keeping the world happy as well. Figure 23 represents the world spending on medicines in billions of U.S. dollars, which indicates a clear trend over past years on world spending in medicines and a forecast of increasing expenditures on this matter in 2021.
The mature markets of this industry have evolved economically, demographically and structurally and pharmaceutical companies continued to pursue their old business model of higher prices for new features of their medicines, even if they deliver very little extra value. But nowadays consumers seek for more value in the medicines they buy, and paying the same money or less than before. However, the dilemma is that many of those medicines in the companies’ pipeline were developed before those market forces were that strong and some products may be unable to meet consumers’ expectations. The price politics represent a medium risk for Pfizer Inc.
Debt and Financing:
Pfizer Inc. has a strong financial position considering the complex environment where it operates. The company has significant operating cash flows, access to capital markets, financial assets, and ready to use lines of credit and rotational credit agreements, that allows the firm to predict that it will maintain the ability to meet the liquidity required for a prosperous future. The long-term debt is rated with high quality investment grade by both S&P and Moody’s (Table 12). Due to the continuously environment changing environment the company is still planning to adopt a conservative approach to financial investments made. The two major corporate debt-rating organizations, S&P and Moody’s, attribute ratings to the company short term and long term debt. A security rating is not a recommendation to buy, hold or sell securities and the rating is liable to revision or withhold at any time by the rating organization. Table 12, provides the current ratings assigned by these rating agencies to the company’s commercial paper and senior unsecured long-term debt. The full list of PFE bonds and maturities is represented in Table 13.
In terms of financing, the net cash used by Pfizer Inc. in financial activities was $8.9 billion in 2016, which decreased when comparing with the $10.4 billion in 2015. This decrease in net cash observed in 2016 occurred because of the issuance of long-term debt in $11 billion and purchases of common stock of $5 billion, partially offset by net payments on short-term borrowings of $714 million, higher payments on long term debt
80 80 80 86 90 98 95 96 98 95 96 95 102 70 80 90 100 110
Jan Mar Jun Sept Dec Mar Jun Sept Dec Mar Jun Sept Dec
2014 2015 2016
Figure 23
:World spending on
medicines
Source: IMS Health, Millions of US Dollars
Table 12
:Pfizer Inc. Rating
Source: Company data
Agency Pfizer Commercial Paper Pfizer Long-term debt Outlook Moody’s P-1 A1 Stable
S&P A-1+ AA Stable
Table 13
:PFE senior unsecured
long-term debt
Source: Company data
(Millions of dollars) Maturity Principal 4.55% May 2017 - 1.1% May 2017 - 1.2% June 2018 1250 1.5% June 2018 1000 6.2% March 2019 - 2.1% May 2019 1500 1.7% December 2019 1000 5.75% June 2021 2108 1.95% June 2021 1150 2.2% December 2021 1000 3% June 2023 1000 3.4% May 2024 1000 2.75% June 2026 1250 3% December 2026 1750 4% December 2036 1000 5.95% April 2037 2000 6.5% June 2038 1852 7.2% March 2039 2500 4.4% May 2044 1000 4.13% December 2046 1250 Notes 3.3% 2018-2021 2464 Notes 5.99% 2023-2043 4455 Total principal 30529 0 500 1000 1500 2000 2010 2016 2021F
11
of $7.7 billion, higher cash dividends paid of $7.3 billion and lower proceeds from the exercise of stock options of $1 billion. The environment surrounding Pfizer Inc. in terms of its debt and financing represents a moderate risk for Pfizer Inc.
The Industry is changing: Meanwhile, the innovative pharmaceutical industry is currently facing unprecedented challenges caused by slower growth of sales, expiring patents, increasing competition, shorter lifecycle of products, tighter regulations, adverse media coverage and reputational damage, and a decline in the number of new innovative medicines under development. There was a concern in the industry that even though the increasing enormous amounts expended on R&D, the industry is producing far fewer new drugs and effective therapies than it did decades ago, but in order to fight that trend the companies of the industry are doing considerable efforts to adjust to a more competitive environment, doing so by shifting manufacturing and other operations overseas, updating research pipelines, reducing employment and organizing mergers and acquisitions seeking out for new deals that could generate the revenues investors expect.
Peer Group Analysis:
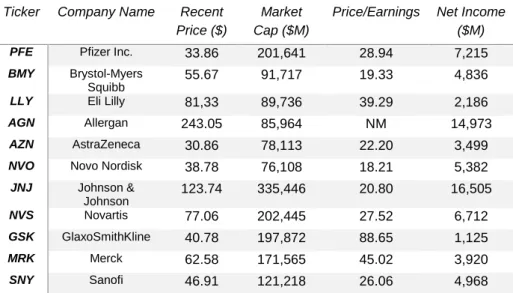
This point will stand out when analyzing Multiples Approach (Relative Valuation), since it is crucial for investors to compare the performance of similar companies. In Pfizer Inc.’s case, it is important to notice that the company has many competitors in its business activity. Table 14 identifies the main competitors of Pfizer Inc. ranked by Net Sales volume in 2016, in which PFE was only outperform by Johnson & Johnson. All the companies in Table 14 are U.S. based. As Figure 24 and Table 15 suggests currently Pfizer Inc. has around 14% of market share in terms of net sales, which makes it one of the biggest players in the pharmaceutical industry. The peer group comparison is based on major pharmaceutical companies of comparable size (Table 16).
Table 16
:Pfizer Inc. Peer Group
Source: AC analysis
Ticker Company Name Recent Price ($)
Market Cap ($M)
Price/Earnings Net Income ($M) PFE Pfizer Inc. 33.86 201,641 28.94 7,215 BMY Brystol-Myers
Squibb
55.67 91,717 19.33 4,836
LLY Eli Lilly 81,33 89,736 39.29 2,186 AGN Allergan 243.05 85,964 NM 14,973 AZN AstraZeneca 30.86 78,113 22.20 3,499 NVO Novo Nordisk 38.78 76,108 18.21 5,382
JNJ Johnson & Johnson 123.74 335,446 20.80 16,505 NVS Novartis 77.06 202,445 27.52 6,712 GSK GlaxoSmithKline 40.78 197,872 88.65 1,125 MRK Merck 62.58 171,565 45.02 3,920 SNY Sanofi 46.91 121,218 26.06 4,968
From a multiples perspective it is easy to find a truly comparable peer group due to the fact that there are many U.S. players with the same comparable regulation and the same core business, even if they produce different products. The process of peer group selection is explained in appendix I.
Table 14: Pfizer Inc. Peer Group
Source: AC analysis
Ticker Company Name Net Sales
($M)
JNJ Johnson & Johnson 72,714
PFE Pfizer Inc. 52,824
NVS Novartis AG 48,518 MRK Merck & Co 39,807 SNY Sanofi 36,623 GSK GlaxoSmithKline 34,897 AZN AstraZeneca 24,633 LLY Lilly 21,585 BMY Bristol-Myers Squibb 19,965 NVO Novo Nordisk 15,863 AGN Allergan 14,570
Figure 24
:Peer Group market
share
Source: AC analysis
Table 15
:Peer group market
share
Source: AC analysis
Ticker Company Name Share JNJ Johnson & Johnson 19.04%
PFE Pfizer Inc. 13.83%
NVS Novartis 12.70%
MRK Merck 10.42%
SNY Sanofi 9.59%
GSK GlaxoSmithKline 9.14%
AZN AstraZeneca 6.45%
LLY Eli Lilly 5.65%
BMY Brystol-Myers 5.23%
NVO Novo Nordisk 4.15%
AGN Allergan 3.81% JNJ PFE NVS MRK SNY GSK AZN LLY
12
Competitive Position:
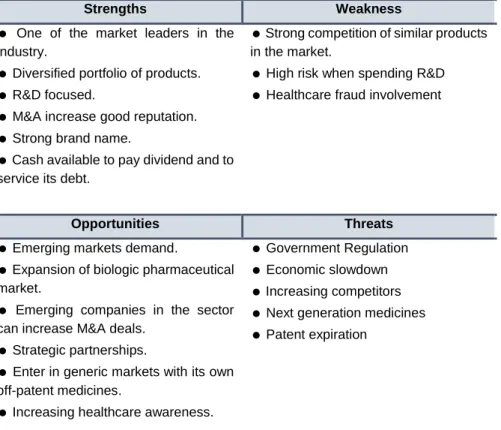
In order to have an idea of Pfizer Inc. current position in the market, it is important to build a SWOT analysis for PFE’s competitive position.
Table 17
:SWOT analysis of PFE
Source: AC analysis
Strengths Weakness
One of the market leaders in the industry.
Diversified portfolio of products.
R&D focused.
M&A increase good reputation.
Strong brand name.
Cash available to pay dividend and to service its debt.
Strong competition of similar products in the market.
High risk when spending R&D
Healthcare fraud involvement
Opportunities Threats
Emerging markets demand.
Expansion of biologic pharmaceutical market.
Emerging companies in the sector can increase M&A deals.
Strategic partnerships.
Enter in generic markets with its own off-patent medicines.
Increasing healthcare awareness.
Government Regulation
Economic slowdown
Increasing competitors
Next generation medicines
Patent expiration
Overall, Pfizer Inc. strengths and opportunities are foreseen to overcome its weaknesses and threats in the future.
Porter five forces analysis (Figure 25):
Threat of new entrants (LOW):
There are several barriers to enter the market due to the huge costs associated with R&D for new medicines development. The costs associated with R&D are intense for new entrants into the pharmaceutical industry. Also capital requirements necessary in this industry to invest in new technology, machinery, and raw materials are constant and massive. Another issue for new entrants is the path of loyalty between the company and the customer that is already achieved by big the big companies in the industry. Another difficult issue for new entrants is the government policy regulation (FDA), which restricts the pharmaceutical industry in a way that potential new entrants can see their investments defeated by the tight regulation imposed in matter of efficiency in clinical trials.
Rivalry (HIGH):
Rivalry among competitors is high due to the already established companies in the sector along with the exit barriers and product differentiation. The large number of companies in the sector means that they have to compete for the same customers, resources and market leadership, which causes companies to go around patent issues and develop similar medicines that could treat the same health condition. The high costs related to exit barriers means that it’s expensive to get rid of a product, service
Figure 25
:Porter´s five forces.
Source: AC analysis 0 1 2 3 4 5 Threat of new entrants Rivalry Bargaining power of suppliers Bargaining power of buyers Substitutes
13
or subsidiary, forcing companies to put in all efforts necessary and fight for their space in the market. This high rivalry makes companies spend a large portion of their budgets on product differentiation marketing among competitors.
Bargaining power of suppliers (LOW):
Prior to the expiration of a patent, the cost of producing a blockbuster is lower when compared to the potential value of sales when the medicine reaches the market. When a generic medicine comes to the market, there are still many suppliers to choose from, the resources required to produce medicines are not restricted to a limited set of suppliers. But generally speaking, pharmaceutical companies owe those suppliers for their own security, integration and quality control, and when this is not the case, individual scientists usually sign away the intellectual rights to any discovered product while working for the company, leaving them with very low bargaining power. However, if an independent group of scientists makes a discovery, that company or institution which they are part of, can have a large bargaining power, but usually when it happens the two institution merge.
Bargaining power of buyers (MEDIUM):
The normal individuals that consume medicines not making part of any specific union or group, consist a low bargaining power, as well as the pharmacies that sell especially what doctors recommend. However, health care insurance agencies, hospitals and HMO’s and government can have significant bargaining power because they can choose to not subsidize certain medicines or unbalance the subsidies between medicines.
Closeness to substitute products (HIGH):
When a medicine is in its period of exclusivity not many substitutes exist, but once the period of exclusivity ends, there are a variety of substitutes like generic medicines. Prolonging the exclusivity period, then, is a desirable strategy to keep pharmaceutical companies profitable.
14
With a price target of $37.35 and an upside potential of 15% comparing to the price at the end of 2016, using the Discounted Cash Flow method (Table 19), and Low Risk assessment, our recommendation stands for Buy (Table 18). Besides the Discounted Cash Flow (DCF) method the Multiples Valuation Approach (Table 20) also supports our view with an average price target of $37.66 and an upside potential of 16%.
Pfizer Inc. was evaluated as a consolidated group under those two different valuation methods, in which is contemplated the two main segments of the company business are complemented, the Innovative Health and Essential Health segments. Pfizer Inc. is a company focused on delivering high quality products, that could create significant value for patients and healthcare providers, and assessing that main objective and considering the company’s current structure, it is predictable that the company would still develop and commercialize new medicines and vaccines through the Innovative Health segment accounting for 55% of the total Revenue in the future, while legacy brands that already lost or will soon lose market exclusivity will still be in charge of the Essential Health segment accounting for 45% of total Revenue in the Future.
For the foreseen period, we predict that Earnings per Share (EPS) will still increase due to the existing growth trend in the industry and also due to the typical feature of mergers and acquisitions of the industry that allows the acquirer to keep feeding its pipeline with outstanding products and at the same time guarantee a good level of return for company shareholders, lined up with company strategy. In 2016 the company registered values in a growing trend of $1.18 in terms of EPS, and consequently on dividends per share of $0.32. The possible existence of a merger or acquisition with another company of the industry is almost a certainty, but it’s virtually impossible to predict who is going to be acquired or when or how.
Pfizer Inc. was characterized by a relative stable stock performance in 2016, with stock price achieving a minimum of $29.04 on March 6th, 2016 and a maximum of $36.92 on July 14th, and also registering 21.64% in terms of annualized stock volatility.
Investment Risks:
In this particular industry there are some investment risks that cannot be controlled by management like economic, market and operational risks, as well as the current price of medicines. The global economic slowdown from several countries affects directly the companies in the industry and the impact of pressure on prices induces a truly innovative medicine with proven improvements in safety and efficacy to still demand for premium prices and secure and excellent return on investment, but as the breakthrough products are not so easy to be approved and commercialized, the companies in this industry are in constant focus on cost cutting opportunities.
Besides those risks, it is important to understand that companies like Pfizer Inc. spend very expressive amounts of capital in R&D processes in order to develop their new products, which can take an average 12 years to fulfill all the criteria to be commercialized. The approval of a new medicine is under the supervision of the FDA, the regulatory entity. Those are the main investment risks surrounding the company’s environment and the ones investors should be aware of.
Moreover, several sensitivity analysis were performed to assess the impact of changing variables that might affect DCF valuation, along with a deeper analysis of PFE’s main risks identified in the Investment Risks section.
5. Investment Summary
Table 18: Investment Grade and
Risk classification matrix
.
Source: BPI Rating SchemeLOW RISK MEDIUM RISK HIGH RISK BUY >15% >20% >30% HOLD >5% and <15% >10% and <20% >15% and <30% REDUCE >-10% and <5% >-10% and <10% >-10% and <30% SELL <-10% <-10% <-10%
Table 19
:Discounted Cash Flow
Valuation.
Source: AC analysis EQUITY VALUE 222,707 NET DEBT 14,780 #OUTSTANDING SHARES 5,962 PRICE TARGET $37.35 UPSIDE POTENTIAL 15%Table 20
:Multiples Valuation
Approach.
Source: AC analysis
MULTIPLES
RESUME PRICE TARGET
EV/EBITDA $38.35 EV/EBIT $38.74 EV/SALES $34.40 P/B $37.26 P/SALES $35.52 P/E $41.70 AVERAGE PRICE TARGET $37.66 AVERAGE UPSIDE POTENTIAL 16%