Erasmus Mundus Programme
ADVANCED MASTERS IN STRUCTURAL ANALYSIS OF MONUMENTS AND HISTORICAL CONSTRUCTIONS i
DECLARATION
Name: Yhosimi Washington Esquivel Fernández Email: [email protected]
Title of the Msc Dissertation:
Characterization of the response of quasi-periodic masonry: Geometrical investigation, homogenization and structural application.
Supervisor(s): Professor Doctor Paulo José Brandão Barbosa Lourenço, Professor Doctor Gabriele Milani
Year: 2012
I hereby declare that all information in this document has been obtained and presented in accordance with academic rules and ethical conduct. I also declare that, as required by these rules and conduct, I have fully cited and referenced all material and results that are not original to this work.
I hereby declare that the MSc Consortium responsible for the Advanced Masters in Structural Analysis of Monuments and Historical Constructions is allowed to store and make available electronically the present MSc Dissertation.
University: University of Minho Date: July-2012
Signature:
Erasmus Mundus Programme ii ADVANCED MASTERS IN STRUCTURAL ANALYSIS OF MONUMENTS AND HISTORICAL CONSTRUCTIONS
Erasmus Mundus Programme
ADVANCED MASTERS IN STRUCTURAL ANALYSIS OF MONUMENTS AND HISTORICAL CONSTRUCTIONS iii
Erasmus Mundus Programme iv ADVANCED MASTERS IN STRUCTURAL ANALYSIS OF MONUMENTS AND HISTORICAL CONSTRUCTIONS
Erasmus Mundus Programme
ADVANCED MASTERS IN STRUCTURAL ANALYSIS OF MONUMENTS AND HISTORICAL CONSTRUCTIONS v
ACKNOWLEDGEMENTS
I would like to express my sincere gratitude to Professor Paulo Lourenço, my supervisor, for the continuous support for his patience, motivation, enthusiasm and guidance, during the preparation of this thesis.
I also wish to thank Professor Gabriele Milani for his friendship, encouragement, enthusiasm; for explaining and his help with the algorithm, used to carry out this thesis without his support it would have been complicated the developed of the thesis.
My sincere thanks to Consortium for granting to me with the scholarship.
Thanks to CVUT in Prague for being good host, thanks for welcoming us and supporting our educational, professional development.
I owe my deepest gratitude to all my classmates, my friends for their accompaniment and friendship along of whole my stay in Europe.
I cannot find words to express my gratitude to my parents and my brother who always supported me during all this time. Thanks for everything that you did for me.
Erasmus Mundus Programme vi ADVANCED MASTERS IN STRUCTURAL ANALYSIS OF MONUMENTS AND HISTORICAL CONSTRUCTIONS
Erasmus Mundus Programme
ADVANCED MASTERS IN STRUCTURAL ANALYSIS OF MONUMENTS AND HISTORICAL CONSTRUCTIONS vii
ABSTRACT
In many countries, historical buildings were built with masonry walls constituted by random assemblages of blocks and stones of variable dimensions, being this feature an issue for studying these structures since they display a non-linear behavior. The analysis of historic masonry structures requires often complex and expensive computational tools that in many cases are difficult to handle, given this condition of large variability of masonry. The present thesis attempts to show a strategy to face up the problematic of the characterization of the response of rubble masonry. First the objectives and motivation of the study are presented, followed by a brief state of the art regarding homogenization techniques and approaches in elastic and inelastic range, discussing the advantages and disadvantages of both approaches. Then, the characterization of the masonry and statistical analysis of the dimensions of the stone units from the walls of Guimarães castle are carried out. This is followed by the homogenized limit analysis of representative volume elements (RVEs) from the Alcaçova wall in the Guimarães castle in order to obtain its in-plane an out-of-plane failure surfaces at different orientations of a load and increasing compressive loads considering, respectively, the case of masonry with weak and strong mortar independently. Afterwards, the limit analysis was carried out in two numerical models of Alcaçova wall, being the first one built with a heterogeneous material and the second one with a homogeneous material that was obtained by means of homogenized the limit analysis of representative volume elements. The purpose is to determinate the reliability of results, limit load and failure mechanism, from the homogenized model, compared to the heterogeneous model. Finally, the conclusions of the study are presented.
Erasmus Mundus Programme viii ADVANCED MASTERS IN STRUCTURAL ANALYSIS OF MONUMENTS AND HISTORICAL CONSTRUCTIONS
Erasmus Mundus Programme
ADVANCED MASTERS IN STRUCTURAL ANALYSIS OF MONUMENTS AND HISTORICAL CONSTRUCTIONS ix
RESUMO
Em muitos países, os edifícios históricos foram construídos com paredes de alvenaria constituída por conjuntos aleatórios de blocos e pedras de dimensões variáveis, sendo esta característica relevante para estudar estas estruturas uma vez que as mesmas exibem um comportamento não-linear. A análise de estruturas históricas de alvenaria exige muitas vezes ferramentas computacionais complexas e caras que em muitos casos, são difíceis de aplicar, dada esta característica de grande variabilidade da alvenaria. A presente tese procura mostrar uma estratégia para enfrentar a problemática da caracterização da resposta de alvenaria irregular. Em primeiro lugar os objetivos e motivação do estudo são apresentados, seguido por um breve estado da arte sobre técnicas de homogeneização e abordagens em regime elástico e inelástico, discutindo as vantagens e desvantagens de ambas as abordagens. Em seguida, a caracterização da alvenaria e análise estatística das dimensões das unidades de pedra das paredes de Guimarães castelo são realizadas. Depois uma análise limite com homogeneização de elementos de volume representativos (RVEs) a partir da parede Alcáçova no castelo Guimarães, Portugal, é realizada a fim de obter superfícies no plane e fora do plano de rotura em diferentes orientações de uma carga, aumentando a pré-compressão vertical e considerando, respetivamente, o caso de alvenaria com argamassa fraca e forte de forma independente. Posteriormente, a análise limite foi realizado em dois modelos numéricos da parede da Alcáçova, sendo o primeiro construído com um material heterogéneo e um segundo com um material homogéneo que foi obtido por meio de homogeneização de elementos de volume representativos. O objetivo é discutir a fiabilidade dos resultados, do fator de carga e dos mecanismos de rotura, a partir do modelo homogeneizado e em comparação com o modelo heterogéneo. Finalmente, apresentam-se as conclusões do estudo.
Erasmus Mundus Programme x ADVANCED MASTERS IN STRUCTURAL ANALYSIS OF MONUMENTS AND HISTORICAL CONSTRUCTIONS
Erasmus Mundus Programme
ADVANCED MASTERS IN STRUCTURAL ANALYSIS OF MONUMENTS AND HISTORICAL CONSTRUCTIONS xi
RESUMEN
En muchos países, los edificios históricos fueron construidos con muros de mampostería constituida por conjuntos de bloques al azar y piedras de dimensiones variables, siendo esta característica un problema para el estudio de estas estructuras, ya que presentan un comportamiento no lineal. El análisis de las estructuras de mampostería histórica requiere de herramientas computacionales a menudo complejas y costosas que en muchos casos son difíciles de manejar, teniendo en cuenta esta condición de la gran variabilidad de la mampostería. La presente tesis presenta una estrategia para enfrentar la problemática de la caracterización de la respuesta de la mampostería. En primer lugar los objetivos y la motivación del estudio se presentan, seguido de un breve estado del arte sobre las técnicas de homogeneización y enfoques en el rango elástico e inelástico, comentando las ventajas y desventajas de ambos enfoques. Despues, la caracterización de la mampostería y el análisis estadístico de las dimensiones de las unidades de piedra de las paredes de Guimarães castillo se llevan a cabo. Seguido por el análisis límite homogeneizado de elementos de volumen representativo (RVE) de la pared de la Alcáçova que pertenece al Guimarães con el fin de obtener la superficie de falla en el plano y la superficie de falla fuera del plano considerando diferentes orientaciones de carga y una carga incremental de compresión respectivamente, en el caso de mampostería con mortero de débil y fuerte de forma se consideran por separado uno de otro. Posteriormente, el análisis límite se llevó a cabo en dos modelos numéricos de Alcáçova pared, siendo el primero construido con un material heterogéneo y la segundo con un material homogéneo que se obtuvo por medio del análisis límite homogeneizado de los elementos de volumen representativos. El propósito es determinar la fiabilidad de los resultados, carga limite y mecanismos de falla, a partir del modelo homogéneo, en comparación con el modelo heterogéneo. Por último, las conclusiones del estudio se presentan.
Erasmus Mundus Programme xii ADVANCED MASTERS IN STRUCTURAL ANALYSIS OF MONUMENTS AND HISTORICAL CONSTRUCTIONS
Erasmus Mundus Programme
ADVANCED MASTERS IN STRUCTURAL ANALYSIS OF MONUMENTS AND HISTORICAL CONSTRUCTIONS xiii
CONTENTS
1. INTRODUCTION ... 1
1.1 MOTIVATION ... 2
1.2 GENERAL OBJECTIVES ... 2
1.3 SPECIFIC OBJECTIVES ... 2
2. STATE OF THE ART ON HOMOGENIZATION TECHNIQUES ... 5
2.1 INTRODUCTION:MODELING POSSIBILITIES FOR MASONRY STRUCTURES ... 6
2.2 HOMOGENIZATION PROCESS ... 6
2.3 APPROACHES FOR HOMOGENIZATION ... 9
2.3.1 Approaches for homogenization of masonry in elastic range ... 9
2.3.2 Approaches for homogenization of masonry in inelastic range ... 12
3. GUIMARÃES CASTLE: BRIEF REVIEW AND GEOMETRICAL CHARACTERIZATION OF THE MASONRY UNITS ... 15
3.1 HISTORICAL ASPECTS ... 16
3.2 DESCRIPTION ... 16
3.3 CHARACTERIZATION OF THE MASONRY AND STATISTICAL ANALYSIS ... 17
3.4 HISTORY OF INTERVENTIONS ... 24
3.4.1 Past interventions ... 24
3.4.2 Recent Intervention ... 25
3.4.3 Planned Intervention ... 25
4. HOMOGENIZED LIMIT ANALYSIS OF REPRESENTATIVE VOLUME ELEMENTS ... 29
4.1 INTRODUCTION ... 30
4.2 NUMERICAL MODELS ... 30
4.2.1 Geometry of the representative volume elements (RVEs) ... 30
4.2.2 Construction of the numerical models for representative volume elements (RVEs) ... 32
4.3 IN-PLANE HOMOGENIZED FAILURE SURFACES ... 34
4.3.1 Formulation to obtain in-plane homogenized failure surfaces ... 34
4.3.2 Algorithm for obtaining in-plane homogenized failure surfaces ... 36
4.3.3 Results of the analysis of the representative volume elements for in-plane loads ... 39
4.3.4 Qualitative comparison between in-plane failure modes of the representative volume element and experimental in-plane failure modes obtained by Dhanasekar ... 42
4.4 OUT-OF-PLANE HOMOGENIZED FAILURE SURFACES ... 45
Erasmus Mundus Programme xiv ADVANCED MASTERS IN STRUCTURAL ANALYSIS OF MONUMENTS AND HISTORICAL CONSTRUCTIONS
4.4.2 Algorithms for obtaining the out-of-plane homogenized failure surfaces ... 46
4.4.3 Results of the analysis of the representative volume elements on out-of-plane loads ... 46
5. CASE STUDY: LIMIT ANALYSIS OF THE ALCAÇOVA WALL OF GUIMARÃES CASTLE ... 51
5.1 INTRODUCTION ... 52
5.2 ALCAÇOVA WALL GEOMETRY ... 52
5.3 NUMERICAL MODELS:MODEL WITH HOMOGENOUS MATERIAL AND MODEL W ITH HETEROGENEOUS MATERIAL ... 53
5.4 ALGORITHMS FOR OBTAINING THE LIMIT LOAD AND THE PATTERN FAILURE OF THE ALCAÇOVA WALL UNDER OUT-PLANE LOADS ... 55
5.4.1 Input data for the homogeneous numerical model ... 55
5.4.2 Input data for the heterogeneous numerical model ... 56
5.5 RESULTS ... 57
5.5.1 Comparison between heterogeneous and homogeneous model with weak mortar: Crack pattern and limit load ... 57
5.5.2 Comparison between heterogeneous and homogeneous model with strong mortar: Crack pattern and limit load ... 59
5.5.3 Qualitative comparison between the failure mechanism of the numerical models and typical mechanism on historical masonry buildings ... 61
5.5.4 Comparison of computing time ... 62
6. CONCLUSIONS... 63
6.1 CONCLUSIONS ... 64 REFERENCES
Erasmus Mundus Programme
ADVANCED MASTERS IN STRUCTURAL ANALYSIS OF MONUMENTS AND HISTORICAL CONSTRUCTIONS xv
FIGURES
Figure 1. Modeling strategies for masonry structures: (a) Detailed modeling. (b) Simplified
micro-modeling. (c) Macro-micro-modeling. ... 6
Figure 2. Basic cell for masonry and homogenization process: Macroscale “X” and microscale “y”... 7
Figure 3. Two-step homogenization [11]: Horizontal homogenization first and vertical homogenization first. ... 10
Figure 4. Elementary cell considering zero thickness of mortar joints ... 10
Figure 5. a) Elementary cell considering zero thickness of mortar joints and triangular discretization, b) Elementary cell considering finite thickness of mortar joints and triangular discretization... 11
Figure 6. Nonlinear approach with joints failure, damaged state of joint near collapse ... 12
Figure 7. a) Panoramic View of Guimarães Castle, b) Plan view of Guimarães Castle. ... 17
Figure 8. a) Random patterns with horizontal alignment in Guimarães castle b)Scale ruler on the wall .... 17
Figure 9. Location of the Wall1, Wall2, Tower wall and Alcaçova wall ... 18
Figure 10 Identification of the stones inside the Wall1 ... 19
Figure 11. Distribution of length (l) and the height (h) of the stones in the Wall 1 ... 19
Figure 12. Identification of the stones inside the Wall2 ... 20
Figure 13. Distribution of length (l) and the height (h) of the stones in the Wall 2 ... 20
Figure 14. Identification of the stones inside the Tower wall ... 21
Figure 15. Distribution of length (l) and the height (h) of the stones in the Wall 1 ... 21
Figure 16. Identification of the stones inside the Alcaçova wall ... 22
Figure 17. Distribution of length (l) and the height (h) of the stones in the Alcaçova wall ... 22
Figure 18. Distribution of length (l) and the height (h) of the stones in the all samples together ... 23
Figure 19. Location of the non-destructive test [34] ... 26
Figure 20 Location of representative volume elements a) 3x3 RVE. b) 4x4 RVE c) 5x5 RVE ... 31
Figure 21. 3x3 RVE numerical models, taken from Alcaçova wall with a triangular mesh ... 32
Figure 22. 4x4 RVE numerical models, taken from Alcaçova wall with a triangular mesh ... 33
Figure 23. 5x5 RVE numerical model, taken from Alcaçova wall with a triangular mesh ... 33
Figure 24. Artificial RVE numerical model, taken from Alcaçova wall with a triangular mesh and periodic arrangement ... 33
Figure 25. ϑ angle: orientations of the external load with respect to the bed joint [40] ... 34
Figure 26 Iterative procedure utilized in the optimization problem. a) Step i. b) Step i+1 [46] ... 35
Figure 27.a) Joints reduce to interfaces b) Interface failure surface adopted for mortar and stone joints[36] ... 37
Erasmus Mundus Programme xvi ADVANCED MASTERS IN STRUCTURAL ANALYSIS OF MONUMENTS AND HISTORICAL CONSTRUCTIONS
Figure 29 Example of Matrix B with elements data ... 38 Figure 30 a) Boundary conditions in the matrix bc_u b) Fixed boundary conditions in triangular element of RVE ... 38 Figure 31 Objective functions to solve the homogenization problem ... 39 Figure 32 Typical in-plane homogenized failure surfaces for 4x4 RVE of masonry with weak mortar at different orientations of the load with respect to the bed joint ... 39 Figure 33 In-plane homogenized failure surfaces for 4x4 RVE of masonry with strong mortar at different orientations of the load with respect to the bed joint... 40 Figure 34. Comparison between in-plane homogenized failure surfaces obtained from 4x4 RVEs and artificial 4x4 RVE for masonry with weak mortar masonry at different orientations of the load ... 40 Figure 35. Comparison between in-of-plane homogenized failure surfaces obtained from 4x4 RVEs and artificial 4x4 RVE for masonry with strong mortar at different orientations of the load ... 41 Figure 36. Comparison between the mean values of in-plane homogenized failure surfaces for each size of RVEs at the load to ϑ=0º a) RVE with weak mortar and b) RVE with strong mortar ... 41 Figure 37. Comparison between the mean values of in-plane homogenized failure surfaces for each size of RVEs at the load to ϑ=22.5º a) RVE with weak mortar and b) strong mortar ... 42 Figure 38. Comparison between the mean values of in-plane homogenized failure surfaces for each size of RVEs at the load to ϑ=45º a) RVE with weak mortar b) RVE with strong mortar ... 42 Figure 39. Qualitative comparison of failure mode between 4x4 RVE from masonry with strong mortar at orientations of the load equal to ϑ=0º and experimentally observed failure modes ... 43 Figure 40. Qualitative comparison of mode failure between 4x4 RVE from masonry with strong mortar at orientations of the load equal to ϑ=22.5º and experimentally observed failure modes ... 44 Figure 41 Qualitative comparison of mode failure between 4x4 RVE from masonry with strong mortar at orientations of the load equal to ϑ=45º and experimentally observed failure modes ... 44 Figure 42. Out-of-plane homogenized failure surfaces (M11-M22) for 4x4 RVE of masonry with weak mortar at incremental vertical compressive loads ... 46 Figure 43. Out-of-plane homogenized failure surfaces (M11-M22) for 4x4 RVE of masonry with weak mortar at incremental vertical compressive loads ... 47 Figure 44. Out-of-plane homogenized failure surfaces (M11-M22) for 4x4 RVE of masonry with weak mortar at incremental vertical compressive loads ... 47 Figure 45. Out-of-plane homogenized failure surfaces (M11-M12) for 4x4 RVE of masonry with strong mortar at incremental vertical compressive loads ... 48 Figure 46. Comparison between the mean values of out-of-plane homogenized failure surfaces for each RVE size: a) RVE with weak mortar b) RVE with strong mortar ... 48
Erasmus Mundus Programme
ADVANCED MASTERS IN STRUCTURAL ANALYSIS OF MONUMENTS AND HISTORICAL CONSTRUCTIONS xvii
Figure 47. Comparison between RVEs and a simplified analytical formula performed on bed joint to predict vertical ultimate bending moment with increasing vertical load: a) RVE with weak mortar; b) RVE with
strong mortar ... 49
Figure 48. Alcaçova wall: Sector enclosed in the red box is considered in the numerical models... 53
Figure 49. Numerical homogenous model of Alcaçova wall (173 triangular elements) ... 54
Figure 50. Numerical heterogeneous model of Alcaçova wall (1299 triangular elements) ... 54
Figure 51. Matrix A stores the location of the nodes for numerical model of Alcaçova wall ... 55
Figure 52. Matrix B stores the location of elements for numerical model of Alcaçova wall ... 55
Figure 53. Vector “t” used to impose the distributed out-of-plane load in Alcaçova wall ... 55
Figure 54 a) Boundary conditions of rotation. b) Boundary conditions of displacements ... 56
Figure 55. Input of the homogenized properties in the model ... 57
Figure 56. Collapse mechanism of heterogeneous model with weak mortar ... 58
Figure 57. Collapse mechanism of homogenous model with weak mortar ... 59
Figure 58. Collapse mechanism of heterogeneous model with strong mortar ... 60
Figure 59. Collapse mechanism of homogeneous model with strong mortar ... 60
Figure 60. Local mechanism #1 for Alcaçova wall ... 61
Figure 61. Local mechanism #2 for Alcaçova wall ... 62
Figure 62. Global mechanism of Alcaçova wall ... 62
Figure 63 . In-plane homogenized failure surfaces for 3x3 RVE for masonry with weak mortar at different orientations of the load with respect to the bed joint ... 72
Figure 64 In-plane homogenized failure surfaces for 4x4 RVE for masonry with weak mortar at different orientations of the load with respect to the bed joint ... 73
Figure 65 . In-plane homogenized failure surfaces for 5x5 RVE for masonry with weak mortar at different orientations of the load with respect to the bed joint ... 74
Figure 66. In-plane homogenized failure surfaces for 3x3 RVE for masonry with strong mortar at different orientations of the load with respect to the bed joint ... 75
Figure 67. In-plane homogenized failure surfaces for 4x4 RVE for masonry with strong mortar at different orientations of the load with respect to the bed joint ... 76
Figure 68. In-plane homogenized failure surfaces for 5x5 RVE for masonry with strong mortar at different orientations of the load with respect to the bed joint ... 77
Figure 69. Comparison between in-plane homogenized failure surfaces obtained from 3x3 RVEs and artificial 3x3 RVE for masonry with weak mortar at different orientations of the load with respect to the bed joint ... 78
Figure 70. Comparison between in-plane homogenized failure surfaces obtained from 4x4 RVEs and artificial 4x4 RVE for masonry with weak mortar at different orientations of the load with respect to the bed joint ... 79
Erasmus Mundus Programme xviii ADVANCED MASTERS IN STRUCTURAL ANALYSIS OF MONUMENTS AND HISTORICAL CONSTRUCTIONS
Figure 71. Comparison between in-plane homogenized failure surfaces obtained from 5x5 RVEs and artificial 5x5 RVE for masonry with weak mortar at different orientations of the load with respect to the bed joint... 80 Figure 72. Comparison between in-plane homogenized failure surfaces obtained from 3x3 RVEs and artificial 3x3 RVE for masonry with strong mortar at different orientations of the load with respect to the bed joint ... 81 Figure 73. Comparison between in-of-plane homogenized failure surfaces obtained from 4x4 RVEs and artificial 4x4 RVE for masonry with strong mortar at different orientations of the load with respect to the bed joint ... 82 Figure 74. Comparison between in-plane homogenized failure surfaces obtained from 5x5 RVEs and artificial 5x5 RVE for masonry with strong mortar masonry at different orientations of the load with respect to the bed joint ... 83 Figure 75. Comparison between in-plane homogenized failure surfaces obtained from mean values of RVEs for masonry with weak mortar at different orientations of the load with respect to the bed joint ... 84 Figure 76. Comparison between in-plane homogenized failure surfaces obtained from mean values of RVEs for masonry with strong mortar at different orientations of the load with respect to the bed joint .... 85 Figure 77. Out-of-plane homogenized failure surfaces (M11-M22) obtained from 3x3 RVE for masonry with weak mortar at incremental vertical compressive loads ... 86 Figure 78. Out-of-plane homogenized failure surfaces (M11-M22) obtained from 4x4 RVE for masonry with weak mortar at incremental vertical compressive loads ... 87 Figure 79. Out-of-plane homogenized failure surfaces (M11-M22) obtained from 5x5 RVE for masonry with weak mortar at incremental vertical compressive loads ... 88 Figure 80. Out-of-plane homogenized failure surfaces (M11-M12) obtained from 3x3 RVE for masonry with weak mortar at incremental vertical compressive loads ... 89 Figure 81. Out-of-plane homogenized failure surfaces (M11-M12) obtained from 4x4 RVE for masonry with weak mortar at incremental vertical compressive loads ... 90 Figure 82. Out-of-plane homogenized failure surfaces (M11-M12) obtained from 5x5 RVE for masonry with weak mortar at incremental vertical compressive loads ... 91 Figure 83. Out-of-plane homogenized failure surfaces (M11-M22) obtained from 3x3 RVE for masonry with strong mortar at incremental vertical compressive loads ... 92 Figure 84. Out-of-plane homogenized failure surfaces (M11-M22) obtained from 4x4 RVE for masonry with strong mortar at incremental vertical compressive loads ... 93 Figure 85. Out-of-plane homogenized failure surfaces (M11-M22) obtained from 5x5 RVE for masonry with strong mortar at incremental vertical compressive loads ... 94 Figure 86. Out-of-plane homogenized failure surfaces (M11-M12) obtained from 3x3 RVE for masonry with strong mortar at incremental vertical compressive loads ... 95
Erasmus Mundus Programme
ADVANCED MASTERS IN STRUCTURAL ANALYSIS OF MONUMENTS AND HISTORICAL CONSTRUCTIONS xix
Figure 87. Out-of-plane homogenized failure surfaces (M11-M12) obtained from 4x4 RVE for masonry with strong mortar at incremental vertical compressive loads ... 96 Figure 88. Out-of-plane homogenized failure surfaces (M11-M12) obtained from 5x5 RVE for masonry with strong mortar at incremental vertical compressive loads ... 97 Figure 89 Comparison between out-of-plane homogenized failure surfaces obtained from mean values of the three different RVEs for masonry with weak mortar ... 98 Figure 90. Comparison between out-of-plane homogenized failure surfaces obtained from mean values of the three different RVEs for masonry with strong mortar ... 99
Erasmus Mundus Programme xx ADVANCED MASTERS IN STRUCTURAL ANALYSIS OF MONUMENTS AND HISTORICAL CONSTRUCTIONS
Erasmus Mundus Programme
ADVANCED MASTERS IN STRUCTURAL ANALYSIS OF MONUMENTS AND HISTORICAL CONSTRUCTIONS 1
Erasmus Mundus Programme 2 ADVANCED MASTERS IN STRUCTURAL ANALYSIS OF MONUMENTS AND HISTORICAL CONSTRUCTIONS
1.1 Motivation
“The historic monuments of generations of people remain to the present day as living witnesses of their age-old traditions. People are becoming more and more conscious of the unity of human values and regard ancient monuments as a common heritage. The common responsibility to safeguard them for future generations is recognized. It is our duty to hand them on in the full richness of their authenticity” [1]. The masonry is a common material in many historical buildings around the world, have survived many seismic events throughout their existence but this fact does not mean historical buildings are out of danger. Nowadays, there are the knowledge and powerful analysis tools that allow to model and calculate the behavior of complex structures under different solicitations. However, the structural analysis of historical masonry buildings remains a challenge due to factors such as: The low tensile strength with quasi-brittle failure, which involves non-linear behavior from load currents small; the heterogeneity present in these constructions; the shear failure is not associated, due to the difference between the dilatancy angle and the internal friction angle; joints commonly represent planes of weakness; anisotropy. These factors increase the computational cost and complicate the numerical models. In recent years, and in several countries, interest in preserving the historical buildings and in finding efficient numerical models, has led to different research groups to develop a significant number numerical model for historical masonry buildings, from very simple to complex ones, which are able to simulate the behavior of the material under different type of loads. The choice depends on the degree of accuracy, sought in the analysis for each case particular.
1.2 General objectives
This thesis concerns the characterization of the response of quasi-periodic masonry by means of a geometrical study and a statistical analysis of stone units, homogenization of masonry and structural implementation.
1.3
Specific objectives
To carry out, the geometrical investigation of stones units from Guimarães castle to obtain statistical parameters and distribution of the height and length of the stones units, with the aim of determine the adequate size of the representative volume elements.
Erasmus Mundus Programme
ADVANCED MASTERS IN STRUCTURAL ANALYSIS OF MONUMENTS AND HISTORICAL CONSTRUCTIONS 3
To perform, the homogenized limit analysis of representative volume elements (RVEs) to obtain their in-plane failure surfaces and out-of-in-plane failure surfaces.
To carry out the limit analysis of the Alcaçova wall and to compare the limit load and failure mechanisms from the homogeneous model and from the heterogeneous model, in order to check the reliability of the homogenous model.
Erasmus Mundus Programme 4 ADVANCED MASTERS IN STRUCTURAL ANALYSIS OF MONUMENTS AND HISTORICAL CONSTRUCTIONS
Erasmus Mundus Programme
ADVANCED MASTERS IN STRUCTURAL ANALYSIS OF MONUMENTS AND HISTORICAL CONSTRUCTIONS 5
2. STATE OF THE ART ON
HOMOGENIZATION TECHNIQUES
Abstract
This chapter presents the state of the art on homogenization techniques for the study of masonry. First, a description of the homogenization process is presented, followed by a review of the approaches for homogenization of masonry in elastic range and inelastic range, discussing the advantages and disadvantages of both approaches.
Erasmus Mundus Programme 6 ADVANCED MASTERS IN STRUCTURAL ANALYSIS OF MONUMENTS AND HISTORICAL CONSTRUCTIONS
2.1 Introduction: Modeling possibilities for masonry structures
Composite materials are made by two or more different constituent bonded by an interface. There are composite materials of natural and artificial origin. Moreover composites can be considered heterogeneous, such as masonry (composed of stones or bricks in a matrix of mortar), laminated wood, cracked media and porous media, or homogenous, such as metals and concrete, for which aggregates and matrix can be more or less recognizable. In the case of masonry a random or structured distribution of their components controls the behavior. This problem is faced up by a numerical representation what can focus on the micro-modeling of its components (units and mortar) of macro-modeling as a composite [2]. According to the level of accuracy and complexity to be achieved, it is possible to choose the following modeling strategies (Figure 1): In detailed micro-modeling, units and mortar are represented by continuum elements while the unit-mortar interface is represented by discontinuum elements; in simplified micro-modeling, units are expanded and represented by continuum elements whereas the behavior of the mortar joints and unit-mortar interface are lumped in discontinuum elements; in macro-modeling units, mortar and unit-mortar interface are lumped together in a continuum element
Figure 1. Modeling strategies for masonry structures: (a) Detailed modeling. (b) Simplified micro-modeling. (c) Macro-micro-modeling.
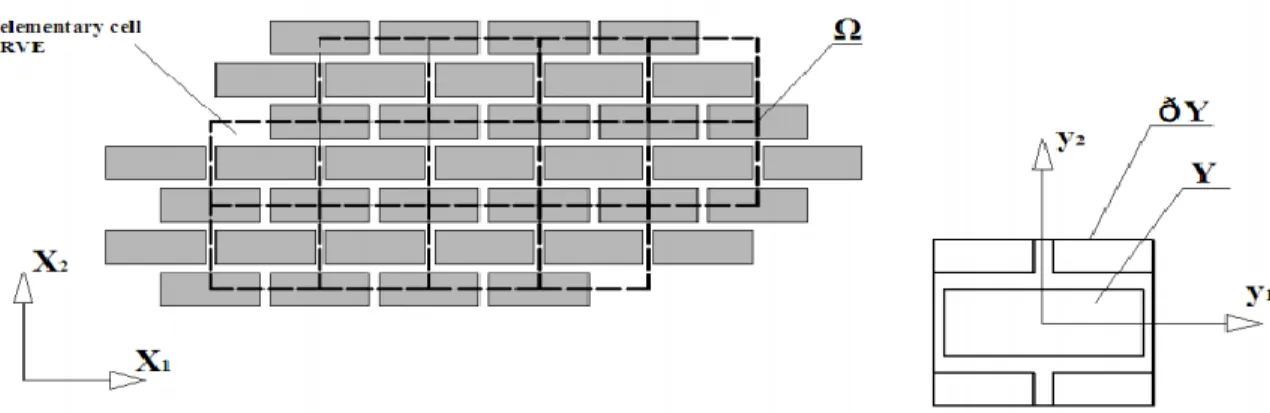
2.2 Homogenization process
The homogenization process consists of choosing a Representative Volume Element Y (RVE) from the microscopic structure which considers the effect that the microscopic structure causes on the macroscopic behavior [3]. Ergo, an entire wall can be represented by the repetition of a RVE (or basic cell) which is composed by unit, bed joint, head joint and cross joint. Therefore, two scales are considered, microscopic scale (y) which is small enough to represent the microstructures of masonry and macroscopic scale (X)
Erasmus Mundus Programme
ADVANCED MASTERS IN STRUCTURAL ANALYSIS OF MONUMENTS AND HISTORICAL CONSTRUCTIONS 7
which is larger enough to represent the behavior of the composite structure (Figure 2).
Figure 2. Basic cell for masonry and homogenization process: Macroscale “X” and microscale “y”. The overall effective properties of the composite can be determined introducing averaged quantities that represent the macroscopic stress () and strain tensors (E) [4] [5] [6], which are available from the study of the RVE and can be written as follows:
(2.1) Where:
V = Volume of the elementary cell
= Local stress tensor
= Local strain tensor <*>= Averaging operator
Periodicity conditions are imposed on the stress field σ and the displacement field u, given by:
(2.2) where:
u is the total displacement field, y is la relative position between two points on the boundary of the
representative volume element “Y”, uper
stands for a periodic displacement field, σn represent the micro-stress vector.
Erasmus Mundus Programme 8 ADVANCED MASTERS IN STRUCTURAL ANALYSIS OF MONUMENTS AND HISTORICAL CONSTRUCTIONS
In the equation 2.3 shows the strength domains Sm, Sb and Shom that were considered by Lourenco and Milani [6], [7]. Here, Sm is the strength domain of the mortar, Sb is the strength domain of the units and Shom is the strength domain of the homogenized macroscopic material. Also, [8] has shown that the Shom domain of the equivalent medium is defined in the space of the macroscopic stresses as follows [9]:
(2.3) Here, [[σ]] is the jump of micro-stresses across any discontinuity surface of normal nint
. Conditions (a) and (d) are derived from periodicity, condition (b) imposes the micro-equilibrium, condition (c) establishes the equilibrium condition throughout the entire RVE (it is necessary to define boundary conditions of RVE in the composite) and condition (e) represents the yield criteria for the components (brick and mortar). It is important to say that for defining boundary conditions of RVE in the composite, uniform micro-strains on jY are assumed. A dual kinematic definition of Shom, also due to Suquet [6], can be derived through the support function πhom
(D) as follows:
(2.4) - v=Dy + vper is the microscopic velocity field
- vper is a periodic velocity field
- d and D are respectively, the microscopic and macroscopic strain rate fields - S is any discontinuity surface of v in Y, n is the normal to S
- π ([[v]],n)= 1/2 ([[v]] ⊗ n + n ⊗[[v]]) -π (d)=max{σ:d; σvS(y)}
Erasmus Mundus Programme
ADVANCED MASTERS IN STRUCTURAL ANALYSIS OF MONUMENTS AND HISTORICAL CONSTRUCTIONS 9
It is worth noting that, using the kinematic definition given by equation (2.4), it is possible to explicitly determine the homogenized strength domain of masonry in the space of the macroscopic stresses assuming infinitely resistant units and joints interfaces with Mohr-Coulomb failure criterion [10]. Alternatively, from the set of equations (2.3), Shom can be statically obtained, solving the following optimization problem for every direction of the vector nΣ:
(2.5) where:
- nΣ =[a11 a22 a12]
T is a vector in the macroscopic stress space Σ
12 Σ22 Σ11.
- λnΣ represents a macroscopic stress state on Shom belonging to a straight line from the origin of direction
nΣ.
2.3 Approaches for homogenization
This section addresses briefly the most well-known approaches for obtaining a homogeneous material, in the elastic range and inelastic range. In each case, the approaches adopt different assumptions and simplifications according to the level of accuracy, complexity and computational cost of the numerical model to be achieved.
2.3.1 Approaches for homogenization of masonry in elastic range
a) Two-step approaches
These approaches were presented by Pande [11] who proposed a model in which a two-step stacked system with alternative isotropic layers was considered. For the first step, a single row of masonry units and vertical mortar joints were taken into consideration, and then homogenized as a layered system. For the second step, a layered system material was further homogenized with horizontal joints to obtain the final material (Figure 3). This way, a very simple mechanical system constituted by elastic springs was
Erasmus Mundus Programme 10 ADVANCED MASTERS IN STRUCTURAL ANALYSIS OF MONUMENTS AND HISTORICAL CONSTRUCTIONS
obtained. Two step approaches are characterized by: Underestimation of the horizontal stiffness of the homogenized material; No information about the texture (running bond, stack bond, Flemish bond, etc.). For nonlinear analysis, the model entails errors as it is not able to take into account the regular offset of vertical mortar joints belonging to two consecutive layered unit courses. Then, a different homogenized material will be obtained if the steps of homogenization are reversed.
Figure 3. Two-step homogenization [11]: Horizontal homogenization first and vertical homogenization first.
b) Reduction of joints to interfaces
From the fact that masonry units are often stiffer than mortar and joints have a smaller thickness than the size of the masonry units, Felice [12] and Cecchi and Sab [13] presented an approach which consisted on the reduction of joints to interfaces (Figure 4). These studies resulted in the definition of the homogenized masonry constitutive function by means of the introduction of several parameters: called scale parameter which tended to zero (Figure 5a), which represents the ratio between the size of the cell and the dimension of the overall panel; =Em/Eb where Em is the Young’s modulus of the mortar and Eb is the Young’s modulus of the masonry unit; ϕ=e/a where “e” is the thickness of the joints and “a” is the size of the characteristic module.
Erasmus Mundus Programme
ADVANCED MASTERS IN STRUCTURAL ANALYSIS OF MONUMENTS AND HISTORICAL CONSTRUCTIONS 11
Then, when ϕ tends to zero the joint becomes an interface although if tend to zero the mortar becomes infinitely deformable with respect to the unit. In order to solve that problem of infinite deformations, Felice [12] and Cecchi and Sab [13] proposed to represent the joints by elastic springs, hence the Poisson effect of is neglected. Also, de Felice [12] assumed rigid masonry units. Cecchi and Sab [13], using mathematical software, discretized the elementary cell by means of a coarse triangular mesh, considering deformable masonry units and finite thickness of the joints (Figure 5b). In this way these authors were able to find ‘‘quasi-analytical’’ formulas.
Figure 5. a) Elementary cell considering zero thickness of mortar joints and triangular discretization, b) Elementary cell considering finite thickness of mortar joints and triangular discretization
The disadvantages of this approach are: The reduction of joints to interfaces, which may strongly reduce the accuracy of the results in the presence of thick mortar joints and ratios tending to zero[14]. The introduction of elastic masonry units leads to only “quasi-analytical’’ formulas for the homogenization problem but increases the computational cost. The influence of joint thickness is lost when the simplifications assumed. Compared with FE approaches in the case of nonlinear analysis, the errors in the result can be no negligible.
c) Finite element procedures
In this approach, all the features of units and mortar joints (thickness), perfect continuity between units and mortar are considered in the evaluation of the homogenized modulus. It is important to indicate that some engineering approaches do not consider all the features of units and mortar joints [15]; [16]. Nevertheless, the important limitation of this approach is that the computational cost of a FE procedure is much higher than macroscopic approaches, which is particularly demanding for nonlinear analysis
Erasmus Mundus Programme 12 ADVANCED MASTERS IN STRUCTURAL ANALYSIS OF MONUMENTS AND HISTORICAL CONSTRUCTIONS
2.3.2 Approaches for homogenization of masonry in inelastic range
For the non-linear analysis of masonry the most well-known approaches are briefly detailed next. a) Engineered approaches
An engineered approach can be based on a two-step homogenization, which, in order to use be for nonlinear analysis, must include a plasticity model[17], a damage model [18], a cracking model [19]. Furthermore, micromechanical homogenization approaches must consider additional internal deformation mechanisms, which have been derived namely by van der Pluijm [20], Lopez et al. [15], and Zucchini and Lourenco [16]. According to the observations by Luciano and Sacco [21]; Gambarotta and Lagomarsino [22]; Calderini and Lagomarsino [23], masonry failure occurs with damage of mortar joints. Then, masonry failure could be present as result of a combination of bed and head joints failures (Figure 6). It is important to stress some limitations of these approaches: In each joints, uniform stress and strain states are assumed, which is only an approximation.
Figure 6. Nonlinear approach with joints failure, damaged state of joint near collapse b) Limit analysis approaches
Limit analysis approaches [24], [7] are based on the assumption of a perfectly plastic behavior with an associated flow rule for the constituent materials. In this framework, Suquet [6] proved that both static and kinematic approaches can be used to obtain an upper- or lower-bound estimation of the homogenized failure surface of a periodic arrangement of rigid plastic materials. De Buhan and de Felice [10] were the first ones to apply the kinematic theorem of limit analysis in the masonry homogenization, assuming that joints are reduced to interfaces with a classic Mohr-Coulomb failure criterion and masonry units are infinitely resistant. Milani [7] adopted a static approach in which compressive failure, the thickness of the joints and unit crushing were considered.
Erasmus Mundus Programme
ADVANCED MASTERS IN STRUCTURAL ANALYSIS OF MONUMENTS AND HISTORICAL CONSTRUCTIONS 13
These approaches have the following advantages: The computational cost of the limit analysis approach can compete with macroscopic approaches, while providing reliable information about failure. They can also be implemented in FE limit analysis codes for collapse analysis. Some of the limitations of these approaches are worth noting: Limit analysis is not able to give information about displacements when collapse produces. IMasonry behavior is also quasi-brittle and the assumption that the ductility of masonry is infinite is only an approximation.
c) Finite element nonlinear approaches
This approach considers a nonlinear damage model, proposed by Pegon and Anthoine [5] and Massart [25] for the constituent materials. In the microscopic step, for each Gauss point, the stress–strain relation is obtained by solving the homogenization problem at a cell level. Then, in the macroscopic step, the structural nonlinear problem is solved using the Gauss points information collected in the microscopic phase. The advantages of these approaches are: Even under complex combination of loads the inelastic masonry behavior can be reproduce well. For panels of small dimension, the computational costs of these approaches at a cell level is not so high and provides results with enough accuracy when compared with experimental tests, as shown by Massart [26]. Nevertheless, these approaches also have limitations, as the computational cost for analysis complex structures or whole 3D building is very high.
Erasmus Mundus Programme 14 ADVANCED MASTERS IN STRUCTURAL ANALYSIS OF MONUMENTS AND HISTORICAL CONSTRUCTIONS
Erasmus Mundus Programme
ADVANCED MASTERS IN STRUCTURAL ANALYSIS OF MONUMENTS AND HISTORICAL CONSTRUCTIONS 15
3. GUIMARÃES CASTLE: BRIEF REVIEW
AND GEOMETRICAL CHARACTERIZATION
OF THE MASONRY UNITS
Abstract
In this chapter, a geometrical characterization of the masonry unit from the wall Guimarães castle is carried out. First, review of historical aspects and descriptions of Guimarães castle are presented, followed by a characterization of the masonry and statistical analysis. Finally, the history of interventions is presented.
Erasmus Mundus Programme 16 ADVANCED MASTERS IN STRUCTURAL ANALYSIS OF MONUMENTS AND HISTORICAL CONSTRUCTIONS
3.1 Historical aspects
The name of Portugal was not recognized in the Iberia nation until before the 10th century, before the widow of the Count of Tui, a Galician lady called the Countess Mumadona Dias, crossed all Minho region and settled in Vimaranes. Mumadona established her ownership in order to accomplish the Count of Tui wishes in his will, as he wanted to settle a monastery in his lands. Then, it was around this monastery that small early villages started to settle [27].
At that time, the Muslims invasions were repeated frequently. Due to the severity of attacks of the Muslims against the Lords of Leon, Mumadona decided that it was not enough to build a monastery with a firm foundation and solid walls to protect the monks and people. She ordered to build a castle, where religious and secular could be protected when the Muslim armies passed by. For the construction of the defensive structure, the Countess chose a hill called Monte Latito (Mount Latito). The castle was overlooking the place where the monastery was built. On this hill, the first walls of the castle were raised [27].
In the 11th century, Count D. Henrique and his wife D. Teresa, settled in Guimarães, remodeling and expanding the castle. Here was born D. Afonso Henriques, who, in 1128, fought the battle of Saint Mamede against the troops of his mother and Galician Count Fernão Peres de Trava, who tried to seize the government of the Portucalense County. D. Afonso Henriques gained independence and became the first king of Portugal.
Later, between 12th and 14th centuries, the castle of Guimarães suffered more changes. During the reign of D. Afonso III (1248-1279) the castle started to improve its defenses. This improvement was continued by his son D. Dinis and finished by D. Fernando in the 15th and 16th centuries. In this period, Portugal was looking for new frontiers across the seas and the old castle became the residence for the mayor. Years later, the castle was abandoned, and suffered damages caused by time and by the subsequent changes of use from a prison to military headquarters, and there was even a proposal for its demolition [28] The current condition is shown in Figure 7a.
3.2 Description
The plan view of the castle is pentagonal (Figure 7b). The castle is also surrounded by eight square towers, which delimit the main square, while in the center of the castle is settled the Tower of Menagem (main tower). The current version of the castle has Romanesque origin; it has a French model [29], with the geometric shield-shaped, with small central chamber and difficult access. It has many Gothic features
Erasmus Mundus Programme
ADVANCED MASTERS IN STRUCTURAL ANALYSIS OF MONUMENTS AND HISTORICAL CONSTRUCTIONS 17
and it has been modified since the end of the thirteen century and in the next century, for example the tower of Menagem and the walls of the Alcáçova were enlarged, probably built on top of existing buildings.
Figure 7. a) Panoramic View of Guimarães Castle, b) Plan view of Guimarães Castle.
3.3 Characterization of the masonry and statistical analysis
The masonry of the castle is made using granite stone ashlars in the external leaves. The masonry features horizontal courses and is relatively regular, despite the fact that the height of the courses is not constant and that the length of the units is rather variable (Figure 8a). In order to represent this feature, a statistical description considering mean, standard deviation, coefficient of variation and probability distribution of the size of the stone units from four walls to will be calculated. The statistical study starts with a visit to Guimarães castle where photograph of its walls were taken, in order to register the geometry of each stone, a scale ruler of 15 cm was placed on the walls while photographs were taken (Figure 8b).
Figure 8. a)Random patterns with horizontal alignment in Guimarães castle b)Scale ruler on the wall For the sake of simplicity the four walls that were chosen to this study will be called in hereafter Wall1, Wall2, Tower wall and Alcaçova wall will be located as it can be seen in the Figure 9.
Erasmus Mundus Programme 18 ADVANCED MASTERS IN STRUCTURAL ANALYSIS OF MONUMENTS AND HISTORICAL CONSTRUCTIONS
Then the statistical analysis was carried out as follows: the first statistical analysis is done for each wall independently and thereafter all walls are analyzed together in order to consider the castle as a whole. It is important to note that for starting the statistical analysis the variables and the population must to be defined whereby the length (l) and height (h) of stone units have been considered as variables and the numbers of stone units considered in each sample of walls are the following: Wall1 has 110 units; Wall2 has 110 units; the Tower wall has 110 units and Alcaçova wall has 308 units.
Figure 9. Location of the Wall1, Wall2, Tower wall and Alcaçova wall
The results from the statistical analysis of Wall1, Wall2, Tower wall, Alcaçova wall and the entire sample walls are presented below:
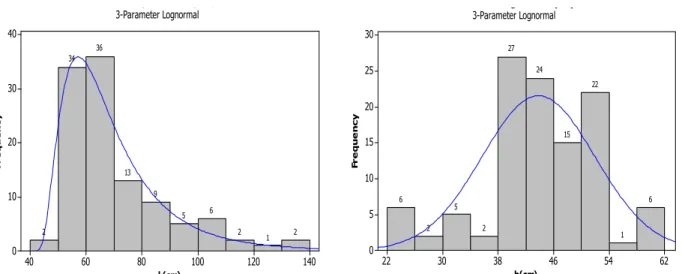
In Wall1 (Figure 10), the mean values of the length and height of the stones are 75.8 cm and 38.9 cm respectively; the standard deviation values for the length and height of the stones are 25.6 cm (coefficient of variation CoV of 34%) and 7.94 cm (CoV of 20%) respectively. The length of stones is typically about 67.5 cm. Unit lengths between 60 cm and 75 cm have the largest frequency with 30 out of 110 stones. The smallest lengths are about 37.5cm and the largest length is about 172.5 cm, which is atypical with frequency of only one stone. The histogram is slightly skewed to the right. The height of stones is typically about 40 cm. Heights between 36 cm and 44 cm have the largest frequency with 42 out 110 stones. The smallest height is about 18cm and the largest height is about 40 cm. There are atypical heights of 22 cm with a frequency of 2 stones. The best fit for probabilistic distributions for both variables is the 3-parameters lognormal (Figure 11), been a general skew distribution in which the logarithm of any linear function of the variables is normally distributed
Erasmus Mundus Programme
ADVANCED MASTERS IN STRUCTURAL ANALYSIS OF MONUMENTS AND HISTORICAL CONSTRUCTIONS 19
Figure 10 Identification of the stones inside the Wall1
Figure 11. Distribution of length (l) and the height (h) of the stones in the Wall 1
In Wall2 (Figure 12), the mean values of the length and height of the stones are 69.7 cm and 43.8cm, respectively; the standard deviation values the length and heights of the stones are 18.9 cm (CoV of 27%) and 8.17 cm (CoV of 19%) respectively. The length of stones is typically about 65 cm. Lengths between 60 cm and 70 cm have the largest frequency with 30 out of 110 stones. The smallest lengths are about 45cm and the largest length is about 135 cm. There is atypical length of 125 cm with a frequency of 1 stone. The histogram is slightly skewed to the right. The height of stones typically is about 40 cm. Heights between 38 cm and 40 cm have the largest frequency with 27 out 110 stones. Also there is a second group of stones with a frequency of 24 stones, with lengths between 44 and 46cm. The smallest height is
180 150 120 90 60 30 35 30 25 20 15 10 5 0 l (cm) F r e q u e n c y 1 0 0 5 13 11 17 30 29 4 3-Parameter Lognormal Wall1-Histogram of length (cm) 56 48 40 32 24 16 25 20 15 10 5 0 h (cm) F r e q u e n c y 4 13 16 21 21 12 14 4 2 3 3-Parameter Lognormal Wall1-Histogram of height (cm)
Erasmus Mundus Programme 20 ADVANCED MASTERS IN STRUCTURAL ANALYSIS OF MONUMENTS AND HISTORICAL CONSTRUCTIONS
about 24cm and the largest is about 60 cm. The best fit probabilistic distribution for both variables is the 3-parameters lognormal (Figure 13).
Figure 12. Identification of the stones inside the Wall2
Figure 13. Distribution of length (l) and the height (h) of the stones in the Wall 2
In the Tower wall (Figure 14), the mean values of the length and height of the stones are 85.2 cm and 45.7 cm, respectively; the standard deviation values the length and heights of the stones are 31.63 and 7.57 respectively. The length of stones (b) typically is about 62.5 cm. Lengths between 55 cm and 70 cm have frequency of 37 stones. The smallest lengths are about 47.5 cm and the largest is about 182.5 cm which is atypical with frequency of 2 stone. The histogram is slightly skewed to the right. The height of stones (h) typically is about 49.5 cm. Heights between 47 cm and 52 cm are quite frequent. The smallest
140 120 100 80 60 40 40 30 20 10 0 l (cm) F r e q u e n c y 2 1 2 6 5 9 13 36 34 2 3-Parameter Lognormal Wall2-Histogram of length (cm) 62 54 46 38 30 22 30 25 20 15 10 5 0 h(cm) F r e q u e n c y 6 1 22 15 24 27 2 5 2 6 3-Parameter Lognormal Wall2-Histogram of h(cm)
Erasmus Mundus Programme
ADVANCED MASTERS IN STRUCTURAL ANALYSIS OF MONUMENTS AND HISTORICAL CONSTRUCTIONS 21
heights are about 14.5 cm and the largest is about 59.5 cm which is frequency of 1 stone. The histogram is slightly skewed to the left. The probabilistic distribution for both variables is 3-parameters lognormal (Figure 15).
Figure 14. Identification of the stones inside the Tower wall
Figure 15. Distribution of length (l) and the height (h) of the stones in the Wall 1
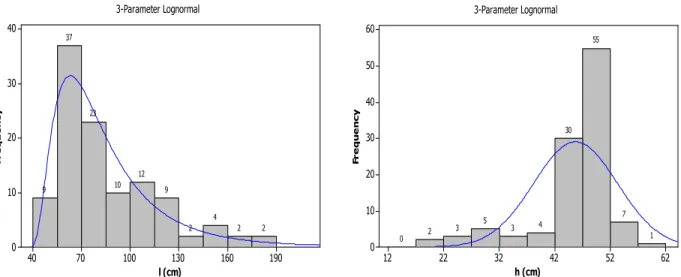
In Alcaçova wall (Figure 16), the mean values of the length and height of the stones are 59.8 cm and 33.5 cm, respectively; the standard deviation values the length and heights of the stones are 26.35 cm and 7.62cm respectively. The length of stones (b) typically is about 45 cm. Lengths between 40 cm and 50 cm have frequency of 77 stones. The smallest lengths are about 25 cm and the largest is about 210 cm which is atypical with frequency of only 1 stone. The histogram is slightly skewed to the right. The height of
190 160 130 100 70 40 40 30 20 10 0 l (cm) F r e q u e n c y 2 2 4 2 9 12 10 23 37 9 3-Parameter Lognormal Tower-Histogram of length (cm) 62 52 42 32 22 12 60 50 40 30 20 10 0 h (cm) F r e q u e n c y 1 7 55 30 4 3 5 3 2 0 3-Parameter Lognormal Tower-Histogram of h (cm)
Erasmus Mundus Programme 22 ADVANCED MASTERS IN STRUCTURAL ANALYSIS OF MONUMENTS AND HISTORICAL CONSTRUCTIONS
stones (h) typically is about 39 cm. Heights between 38 cm and 40 cm are quite frequent. Also there is a second group of stones with frequency of 50 whose lengths are between 26 and 28cm. The smallest heights are about 15 cm and the largest is about 62 cm which is atypical with frequency of 1 stone. The probabilistic distribution for both variables is 3-parameters lognormal. (Figure 17),
Figure 16. Identification of the stones inside the Alcaçova wall
Figure 17. Distribution of length (l) and the height (h) of the stones in the Alcaçova wall
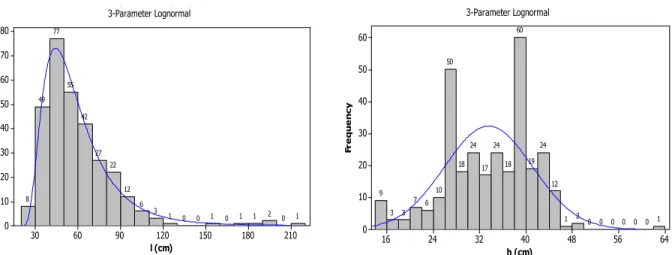
When all samples are considered together, the mean values of the length and height of the stones are 68.6 cm and 38.4, respectively; the standard deviation values the length and height of the stones are 27.8 cm (CoV of 40%) and 9.26 cm (CoV of 24%) respectively. The length of stones is typically about 55 cm. Lengths between 50 cm and 60 cm have the largest frequency (133 out 639 stones). Also there is a
210 180 150 120 90 60 30 80 70 60 50 40 30 20 10 0 l (cm) Fr e q u e n c y 1 0 2 1 1 0 1 0 0 1 3 6 12 22 27 42 55 77 49 8 3-Parameter Lognormal Histogram of length (cm) 64 56 48 40 32 24 16 60 50 40 30 20 10 0 h (cm) Fr e q u e n c y 1 0 0 0 0 0 0 2 1 12 24 19 60 18 24 17 24 18 50 10 6 7 3 3 9 3-Parameter Lognormal Histogram of height (cm)
Erasmus Mundus Programme
ADVANCED MASTERS IN STRUCTURAL ANALYSIS OF MONUMENTS AND HISTORICAL CONSTRUCTIONS 23
second group of stones with a large frequency (125 out 639 stones), with lengths between 60 and 70cm. The smallest lengths are about 25 cm and the largest is about 210 cm, being both atypical. The histogram is slightly skewed to the right. The height of stones is about typically 39 cm. Heights between 38 cm and 40 cm are quite frequent. The smallest heights are about 13 cm and the largest is about 62 cm, which are both very atypical. The probabilistic distribution for both variables is the 3-parameters lognormal (Figure 18).
Figure 18. Distribution of length (l) and the height (h) of the stones in the all samples together In the Table 1, it can see a summary of the more significant parameters that were by the statistical analysis
Table 1. Statistical parameters of wall samples from Guimarães castle From the statistical analysis is worth to note the following points:
There is a large variation between the mean value of the stone length and height in the four walls selected for sampling (60 to 80 cm in length and 34 to 46 m in height). The ratio between the maximum and minimum value found is similar to both quantities (about 75%).
210 180 150 120 90 60 30 140 120 100 80 60 40 20 0 l (cm) F r e q u e n c y 1 0 2 3 3 1 2 4 4 10 24 27 27 55 69 125 133 90 50 8 3-Parameter Lognormal
All samples together-Histogram of b (cm)
64 56 48 40 32 24 16 90 80 70 60 50 40 30 20 10 0 h (cm) F r e q u e n c y 1 4 3 3 4 11 51 34 33 44 49 60 80 28 32 26 39 27 54 18 9 8 8 3 9 3-Parameter Lognormal
All samples together-Histogram of h (cm)
Sample Mean Length (l) Mean Height (h) h/l
Wall1 75.79 38.94 0.51
Wall2 69.67 43.81 0.63
Tower wall 85.23 45.73 0.54
Alcaçova wall 59.81 33.55 0.56
Erasmus Mundus Programme 24 ADVANCED MASTERS IN STRUCTURAL ANALYSIS OF MONUMENTS AND HISTORICAL CONSTRUCTIONS
The stone geometrical ratio is rather important for the quality of the masonry bond. The value of h/b for the average geometrical dimensions is about 56% (1:1.8). Only in Wall2, a slightly different h/b ratio is found, equal to 63% (1:1.6).
The scatter found in the length is always much larger than the scatter found in the height, being the scatter in the full sample not so much different from the scatter in the individual samples.
Wall 2 is the sample with lowest scatter and the Alcaçova is the sample with the largest scatter, despite that fact that the Alcaçova sample is three times larger than Wall 2.
The difference between averaging the total sample, weighted by the number of samples or weighted equally is only moderate, with about 5% change in the dimensions.
The probabilistic distribution for the length is clearly skewed, requiring a lognormal distribution. The probabilistic distribution for the height is relatively symmetric, meaning that a normal distribution can be used.
3.4 History of interventions
The geometrical study carried out will be used to assess the safety of the Alcaçova wall, identified recently as the part of the castle presenting the largest structural vulnerability. For this purpose, the past, recent and planned interventions are briefly revised next.
3.4.1 Past interventions
The Castle of Guimarães is of military architecture, Romanesque and Gothic, but the currently building is the result of many interventions since the second half of the thirteenth century. According to Fonte [30] with the arrival of D. Henrique, the Castle suffered a series of changes, including the expansion of its area, the addition of the Tower of Menagem, the addition of the battlements and loopholes, the opening of two gates and the construction of the Alcazaba Condal (housing two floors) in the northern part.
Later on, D. Afonso III built the fence around the "Vila do Castelo" and D. Dinis and D. João I built the two towers flanking the entry doors. Along time, the use of the castle changed, from prison, military barracks, and finally the monument. The Capuchin friars were responsible for the disappearance of the Hall of the Castle (ruins of the citadel), because the stones were used to build a convent. Also the south part was severely damaged due to stones removed to pave the streets of Guimarães. For building the house of the guard, the battlements of the Tower of Menagem were cut down on three sides.
Erasmus Mundus Programme
ADVANCED MASTERS IN STRUCTURAL ANALYSIS OF MONUMENTS AND HISTORICAL CONSTRUCTIONS 25
By 1937, the original floors from the tower of Menagem had been replaced by others located at different levels than the originals. The old cover of roof was slated and supported by a timber truss poorly built and of poor quality. The part of the castle in worse condition of conservation was located on North area, specifically in the area of the Alcáçova. The south wall (angular part) was consolidated, together with the reconstruction of all timber floors, timber stairs and timber roof of the Menagem tower. In 1958, the bridge which connects the tower and the walls was installed. In 1971, stairs and floors of the north tower were reconstructed [31], [32]. The demolition of several masonry walls recently been built in the main square was made, as these walls covered up the foundations of the ancient citadel, whose plan is now clearly defined. Finally, the works also included consolidation of the walls of the Alcáçova, which were in ruin, and partial reconstruction of the chimney.
3.4.2 Recent Intervention
Between 2008 and 2009, interventions were conducted by Direcção de Serviços dos Bens Culturais da Direcção Regional de Cultura do Norte (DRCN) to consolidate the foundations and stabilization of the wall of the north west Tower due to damage such as openings in the walls. The wall of the Alcáçova was partly consolidated and conservations works were made at the entrance door of the Castle. In the Alcáçova, the chimney of the North wall was strengthened using a set of metal plates in its interior, together with the placement of a capping mortar on top of the wall of the Alcáçova in order to prevent water ingress.
3.4.3 Planned Intervention
As previously mentioned, the Guimarães city has several cultural and historic spaces of reference at a local and national level in Portugal, being Guimarães castle, one of icons of the Portuguese history and the independency of the country, home of the first King in 12th century. It is national monument since 1910 and forms part of a World Heritage Site; given the historical importance of the castle, over the years Guimarães castle been subjected to several interventions to conserve it. Then in 2008, TecMinho, a private non-profit association and sponsored by the University of Minho and the Association of Municipalities of Vale do Ave, at the request of the ICM (Instituto dos Museus e da Conservação) executed a set of non-destructive test to the Castle of Guimarães , carried out by the FEUP (Faculdade de Engenharia da Universidade do Porto) in 2008 to assess whether the anomalies in the Castle might create structural problems that jeopardizes the integrity of the building or not.
Non-destructive tests were carried out on the wooden roofs of the north tower, the south tower and the Menagem tower. In the wooden roofs of the towers, the tests were performed using a hygrometer, with
Erasmus Mundus Programme 26 ADVANCED MASTERS IN STRUCTURAL ANALYSIS OF MONUMENTS AND HISTORICAL CONSTRUCTIONS
pylodin and resistographer, while Alcaçova wall was carried out an inspection, using a baroscopic camera and sonic and dynamic tests (Figure 19). Visual inspection with the baroscopic camera allowed to verify that Alcaçova wall is built with granite stones and composed of two leaves and rubble infill. Each leaf is has a thickness between 30 and 40 cm equipped granite, while the infill is composed gravel and rubble, with the existence of voids. Through this inspection was also possible to identify several layers of mortar and water within of the walls. The sonic tests allow to verify as it was said before, the existence of voids within the wall that, been an alternative to solve this problem to consolidate the wall by means of the technique of injection of grout. Finally, the dynamic test has verified that the structure has a slightly high natural frequency as a consequence of some locking in the wall, providing by adjacent buildings.
Figure 19. Location of the non-destructive test [33]
At the present, due to the event Guimarães 2012 European Capital of Culture, a set of actions at the level of conservation, accessibility and communication have been raised, allowing the castle to be in proper
Erasmus Mundus Programme
ADVANCED MASTERS IN STRUCTURAL ANALYSIS OF MONUMENTS AND HISTORICAL CONSTRUCTIONS 27
condition to receive thousands of visitors, One of these actions is a project of intervention about one of the walls of the castle that is located in the north part and known as Alcáçova (Figure 9) in where it is planning to use injections of grout in the joint of the wall whereby, this thesis will be focused in particularly in Alcáçova, being one of its main characteristics the quasi periodic arrangement of the stones, this characteristic become a issue from the point of view of the structural analysis due to the difficulties for obtaining proper and efficient numerical models capable to predict its behavior under out-of-plane loads such as earthquakes loads. In the next chapter, samples (representative volume elements) will be taken from the wall in order to estimate the masonry properties.
Erasmus Mundus Programme 28 ADVANCED MASTERS IN STRUCTURAL ANALYSIS OF MONUMENTS AND HISTORICAL CONSTRUCTIONS
Erasmus Mundus Programme
ADVANCED MASTERS IN STRUCTURAL ANALYSIS OF MONUMENTS AND HISTORICAL CONSTRUCTIONS 29
4. HOMOGENIZED LIMIT ANALYSIS OF
REPRESENTATIVE VOLUME ELEMENTS
Abstract
This chapter presents homogenized the limit analysis of nine representative volume element (RVE) samples from the Alcaçova wall in the Guimarães castle, Portugal. The RVEs are analyzed under in-plane load in order to obtained the in-plane surface failure at different orientations of a load with respect to the bed joint, considering masonry with weak and strong mortar joint independently .Also, the RVEs are analyzed under out-of-plane load in order to obtained the out-of-plane surface failure at increasing compressive loads; again considering masonry with weak and strong mortar independently. The result allows subsequent implementation of the obtained failure surfaces in the study of the full masonry wall.