Luís Teotónio van Zeller Pamplona
do Canto Brum
Licenciado em Ciências de Engenharia e Gestão Industrial
Resilience of logistic service providers
facing a port strike: a case study
Dissertação para obtenção do Grau de Mestre em Engenharia e Gestão Industrial
Orientador: Professora Doutora Helena Maria Lourenço
Carvalho Remigio,
Professora Auxiliar, Faculdade de Ciências e Tecnologia
da Universidade
Nova de Lisboa
Co-orientador: Engenheiro José Guilherme Belo Tavares
Júri:
Presidente: Prof. Doutora Isabel Maria do Nascimento Lopes Nunes Arguente: Prof. Doutora Virgínia Helena Arimateia de Campos Machado
Vogal: Prof. Doutora Helena Maria Lourenço Carvalho Remigio
Resilience of logistic service providers facing a port strike: a case study
Copyright © Luís Teotónio van Zeller Pamplona do Canto Brum, Faculdade de Ciências e Tecnologia, Universidade Nova de Lisboa.
Acknowledgements
This thesis would not be possible without the collaboration and assistance of many persons, to whom I would like to express my gratitude for all their help and support:
To Professor Helena Carvalho Remígio, my dissertation advisor, for her unflagging availability and guidance during the writing of this thesis.
To the representatives of the companies under study, who kindly granted me their time, providing me with the indispensable information needed to develop this project: Dr. Caetano Costa Macedo (Transinsular), Eng. Eduardo Pimentel (Liscont) and Eng. José Guilherme Tavares (ETE–Logística). I also have to thank Dr. António Belmar da Costa for the disponibility and support provided.
To my university colleagues, always supportive along the way, making my years in FCT-UNL as good as I could wish for.
To my friends. You know who you are.
Resumo
O objectivo desta dissertação é estudar o impacto de uma greve portuária em empresas prestadoras de serviços logísticos na cadeia de abastecimento. No âmbito desta dissertação, estas empresas são denominadas como 3PL (third-party logistic providers). Estas empresas são altamente dependentes dos portos marítimos para prosseguir a sua actividade, visto que efectuam serviços a nível internacional. Consequentemente uma perturbação no funcionamento dos portos pode prejudicar gravemente o negócio deste tipo de empresas. Entre as perturbações ao normal funcionamento dos Portos encontra-se a greve dos estivadores. Pretende-se analisar os efeitos negativos que provêm desta perturbação, e estratégias que os 3PLs poderão implementar de forma a tentar manter os seus níveis de performance nivelados e um rápido tempo de recuperação.
Com este objectivo, primeiramente é desenvolvido o estudo do estado da arte que abrange o sector marítimo-portuário e dos 3PLs no contexto de uma cadeia de abastecimento, aprofundando-se em seguida o conceito de uma cadeia de abastecimento resiliente, e por fim é desenvolvido um enquadramento teórico de forma a contextualizar o caso de estudo. Seguidamente, é elaborado um caso de estudo composto por três empresas da área de distribuição terrestre e marítima e operadoras portuárias com o objectivo de quantificar os impactos da greve portuária. A recolha de informação de fontes primárias é dividida em duas fases, sendo a primeira via e-mail e a segunda através de entrevista pessoal. Informação de fontes secundária é obtida através de notícias televisivas, internet e conferências – de forma a ser possível o cruzamento de informação. Por fim, através da análise da informação, são retiradas conclusões das medidas efectuadas por cada empresa de forma a minimizarem o impacto da greve, contribuindo assim para uma cadeia de abastecimento mais resiliente.
Deste estudo pode-se concluir que uma greve de estivadores cria na cadeia de abastecimento uma sucessão de efeitos negativos interligados, degradando todos os KPIs (key performance indicators) relevantes para a análise da performance dos 3PLs em estudo, sem que estejam disponíveis estratégias de mitigação e contingência verdadeiramente eficazes para reduzir os efeitos negativos da perturbação provocada por uma greve portuária.
Abstract
The purpose of this thesis is to study the impact of a port strike on companies that perform as logistic service providers in a supply chain (SC), here denominated 3PL (third-party logistic providers). These companies are highly dependent on ports to perform their activity, since they provide international services. Consequently, a disruption in a port can seriously impair their business. A stevedores’ strike
is one of the possible disruptions that can affect ports. This study aims to analyze the negative effects caused by this disruption, and what strategies 3PLs may implement in order to keep their performance levels stable and have a quick recovery time.
Within this objective, the first step will be to establish a theoretical context about the maritime port’s
sector and 3PLs in a SC context, to then expand the concept of a resilient SC, and finally to develop a theoretical framework in order to better contextualize the case study. Subsequently, the impact of a port strike will be quantified by using a case study comprising three companies, covering the areas of land and sea distribution and port operations. Information from primary sources was assembled in two phases: first via e-mail and, in a second phase, through a personal interview. The information from secondary sources was obtained through television news, internet and conferences, enabling its cross-analysis. Finally, by analyzing the collected data, it will be possible to draw conclusions about the measures carried out by each company to minimize the negative effects of the strike, thus contributing to a more resilient SC.
As a conclusion, a stevedores’ strike will create a snow-ball of negative effects in the SC, degrading all relevant KPIs (key performance indicators) of the 3PLs under study. No mitigation and contingency strategies available proved really effective to reduce the negative effects of a port strike disruption.
Index
Resumo ... VII Abstract... IX
Chapter 1 - Introduction ... 1
1.1. Resilience in supply chains ... 1
1.2. Theme justification ... 2
1.3. Objective ... 3
1.4. Methodology ... 4
1.5. The content ... 4
Chapter 2 - Maritime port's sector ... 5
2.1. The contemporary worldwide sea trading system ... 5
2.2. Maritime cargo ... 7
2.3. Maritime ports ... 9
2.4. Ports in Portugal ... 13
2.5. Conclusion ... 15
Chapter 3 - Third-party logistics providers in the supply chain context ... 17
3.1. Third-party logistics providers ... 17
3.2. The importance of partnerships ... 19
3.3. Choosing a 3PL ... 20
3.4. Measuring the performance of logistics providers ... 22
3.5. Conclusion ... 24
Chapter 4 - Supply chain resilience ... 25
4.1. The resilience paradigm ... 25
4.2. Supply chain risk, vulnerability and disruptions ... 28
4.3. Mitigation and contingency strategies ... 34
4.4. Conclusion ... 35
Chapter 5 - Theoretical framework ... 37
5.1. Vulnerable areas for disruptions in a port environment ... 37
6.1. Selected research methodology ... 43
6.2. Case selection ... 44
6.3. Research phase ... 45
6.3.1. Data collection ... 45
6.3.2. Data analysis ... 46
6.4. Conclusion ... 48
Chapter 7 - Case study analysis ... 49
7.1. Port strike description ... 49
7.1.1. The Port of Lisbon’s characteristics and importance ... 49
7.1.2. The Port of Lisbon’s strike of 2012 ... 50
7.1.3. 2013 The Port of Lisbon strike ... 52
7.2. Case study description ... 54
7.2.1. ETE-Logística ... 54
7.2.2. Transinsular ... 56
7.2.3. Liscont ... 56
7.2.4. Case study synthesis ... 58
7.3. Data analysis ... 58
7.3.1. Port strike negative effects ... 58
7.3.2. Key performance indicators ... 63
7.3.3. Resilience strategies ... 66
7.3.4. Relationships between negative effects ... 69
7.3.5. Strike impact on the key performance indicators ... 72
7.4. Discussion ... 74
7.5. Conclusion ... 75
Chapter 8 - Conclusions and recommendations ... 77
8.1. Conclusions ... 77
References ... 83
Appendix A ... 91
Appendix B ... 97
List of Tables
Table 2.1 - TEU-ranking and growth% of the top 20 world container ports in 2011 ... 7
Table 2.2 - Domestic intermodal transportation by country: TEU and goods shipped 2009/2011 ... 11
Table 3.1 - Services provided by 3PL ... 17
Table 3.2 - Relevant decision factors ... 21
Table 3.3 – KPIs used in the physical distribution context ... 23
Table 4.1 - Resilience definitions ... 26
Table 4.2 – Supply chain vulnerability definitions ... 30
Table 4.3 - Relationship between disruptions and risk categories ... 31
Table 4.4 - Mitigation and contingency strategies ... 35
Table 5.1 - Impact and likelihood of occurrence for the main areas of vulnerability ... 38
Table 5.2 - Failure modes in a maritime transportation system ... 39
Table 5.3 - Contingency plans and mitigation actions ... 40
Table 6.1 - Data collection process ... 46
Table 6.2 - Research phase: Data reduction and display methods ... 47
Table 7.1 - Costs by mode of transport ... 50
Table 7.2 - Emission of greenhouse gas (CO2) into the atmosphere ... 50
Table 7.3 - Total annual handled containers (TEU) in the main national ports until 2012 ... 51
Table 7.4 - Total annual handled containers (TEU) in the main national ports in 2013 ... 53
Table 7.5 - Containers (TEU) handled per main ports in December 2013 ... 54
Table 7.6 - ETE-Logística operations ... 55
Table 7.7 - Transinsular services ... 56
Table 7.8 - 3PLs under study ... 58
Table 7.9 - Port strike negative effects: frequency of occurrence and severity ... 59
Table 7.10 - Key performance indicators relevance in a port strike period ... 63
Table 7.11 - Strategies implemented during a strike ... 66
Table 7.12 - Influences among the strike negative effects in ETE-Logística ... 69
Table 7.13 - Influences among the strike negative effects in Transinsular ... 70
Table 7.14 - Influences among the strike negative effects in Liscont ... 70
List of Figures
Figure 1.1 - Thesis workflow... 3
Figure 2.1 - Evolution of maritime commerce. ... 6
Figure 2.2 - Motorways of the sea ... 9
Figure 2.3 - A port as an integrated logistics center ... 12
Figure 2.4 - Structural scheme of the port authorities, IPTM and main operators in a concession regime in Portugal ... 14
Figure 3.1 - 3PLs characteristics ... 18
Figure 3.2 - Critical factors in choosing a 3PL... 21
Figure 4.1 - House of agility... 27
Figure 4.2 - The resilience triangle ... 27
Figure 4.3 - Risk global environment ... 29
Figure 4.4 - Example of a vulnerability map for a single company... 30
Figure 4.5 - Disruptive event: snowball effect ... 32
Figure 4.6 - Disruption profile ... 33
Figure 4.7 - Supply chain failure modes ... 34
Figure 4.8 - From a disruptive event to the normal state through mitigation and contingency strategies ... 35
Figure 5.1 - Port integrated in a supply chain... 37
Figure 5.2 - Process of the maritime transportation system ... 38
Figure 5.3 - A framework for maritime disruption strategies ... 39
Figure 5.4 - Contextualizing of a case study related to a port strike ... 41
Figure 5.5 - Theoretical framework ... 41
Figure 6.1 - Inductive and deductive research approaches ... 43
Figure 6.2 - Case study framework ... 45
Figure 6.3 - Components of Data Analysis: Interactive Model ... 47
Figure 7.1 –TEUs operated by ETE Group ... 55
Figure 7.2 - Liscont Hinterland ... 57
Figure 7.3 - Negative effects: severity x occurrence ... 62
Figure 7.4 - Influences between negative effects common to all three companies in the study ... 71
List of Abbreviations
3PL - Third party logistics KPI – Key performance indicator SC – Supply chain
Chapter 1 - Introduction
1.1. Resilience in supply chains
Nowadays customers expect the highest quality in products/services they purchase, not only because of the worldwide economic crisis, but also due to the vast number of alternatives they are able to find in a global market. Companies are, therefore, facing a much more competitive business environment. This increase in customer exigency led companies to focus on their core competence, and outsource other activities that, though also needed to have a functional and successful business, can be considered as auxiliary. This practice contributed (and is still contributing) to the growth of third-party logistics (3PLs) all over the globe. With burgeoning global trade, fierce competition, higher customer expectations, and ever-expanding supply chains (SCs) around the world, 3PLs play an increasingly important role in the prevailing dynamic and volatile environment (Murphy & Daley, 2001). 3PLs supply a wide range of logistic services related to freight forwarding, shipping, handling, storage and packaging of goods in different logistics flows and SCs (Kilibarda, Zečević, & Vidović, 2012), but they may also manage and develop features such as information systems, inventory and also provide customer order fulfillment services (Boyson, Corsi, Dresner, & Rabinovich, 1999).
Companies can no longer depend only on themselves to ensure the quality of their products/services will, not merely satisfy but, in fact, exceed their customer’s expectations. That is why companies’
success is highly dependent on the success of the SC they are part of, and that is why Christopher (2000) sustains that individual businesses no longer compete as stand-alone entities but rather as SCs. A SC consists of all parties involved, directly or indirectly, in fulfilling a customer request. The SC not only includes the manufacturer and suppliers, but also transporters, retailers, and customers themselves (Chopra & Meindl, 2004). SCs must be properly capable of overpassing adverse situations, or in other words, must be resilient.
The resiliency of a SC is its capacity to deal with unforeseen events, to respond to the disruptions they might cause, and to recover while maintaining the chain performance at a desired level (Ponomarov & Holcomb, 2009). According to Sheffi & Rice (2005) resilience can be achieved by either creating redundancy or increasing flexibility. Most common forms of redundancy (safety stocks, the deliberate use of multiple suppliers even when the secondary suppliers have higher costs, and deliberate low capacity utilization rates) although always part of any SC with a resilient strategy, represent high costs, and have limited benefits, unless needed due to a disruption (Sheffi & Rice Jr, 2005). According to Jüttner & Maklan (2011), flexibility “ensures that changes caused by the disruption can be absorbed
by the SC through effective responses”, making it possible to create competitiveness advantage in
enhances effectiveness and responsiveness in the SC, and it is a concept we will later analyze in more detail. Another measure to insure resilience in a SC is the employ of mitigation and contingency strategies. These strategies should be reinforced in the most vulnerable areas of the operation, to reduce the probability of occurrence of risks. Also important to provide a SC with resilience is the creation of partnerships and alliances between companies which by Lambert, Emmelhainz, & Gardner (1999), is “a tailored business relationship based upon mutual trust, openness, shared risk, and shared reward that yield a competitive advantage, resulting in business performance greater than would be achieved by the companies individually’’.
It is, therefore, plainly perceptible that SCs’ resilience is a key factor in any business, requiring and involving a vast array of other concepts.
1.2. Theme justification
For a country such as Portugal, with a large maritime coast serving as a door to the Atlantic Ocean, sea economy is of great importance. DGPM (2012) and Fórum Empresarial da Economia do Mar (2013) provide us with valuable statistical information about Portugal’s maritime economy:
i. In 2010 the total gross value added of uses and commercial activities of the maritime economy analyzed was 373x107 euros, representing 2,5% of the Portuguese gross value added. In 2006 it represented 2,2%.
ii. The value of production of the uses and activities of the maritime economy in Portugal reached 8.174x10⁶ euros in 2010, corresponding to 2,4% of national production. In 2006 this corresponded to 2,2%.
iii. The total employment in uses and activities of the sea in Portugal’s economy in 2010 came near to 109.000 employees in full time equivalent, which corresponded to 2,3% of national employment. In 2006 it corresponded to 2,1%.
iv. Portugal’s maritime exclusive economic zone is about 1.730.000 km2, equivalent to 20 times its land territory (which is around 91,470 km2), and with enormous unexplored potential in areas such as transport and ports, recreational navigation, nautical tourism, fisheries, aquaculture and fish processing, materials, energy and biotechnology.
v. At the moment, the sea economy contributes to 2% to the national gross domestic product, with the potential to reach 6% of the gross domestic product, and it is believed that at 2025 the sea economy will represent 12% of Portugal’s gross domestic product.
relation to the development of the economy of the sea?”, the result was extremely positive, reaching: i) 72% for a high correlation; ii) 25% for medium correlation; and iii) 3% for low correlation. This result reinforces the importance of developing this area, with vast untapped potential. Moreover, around 37% of European transports are made by sea, and the objective is to increase this percentage, by implementing concepts such as sea motorways (Fórum Empresarial da Economia do Mar, 2013).Thereby Portugal, with its great geographic location and sea territory, should take advantage of these natural conditions. In order to do so, ports, which are a key-point in all of this, must be functional at all times and must be aligned to excellence, so that fails in their performance do not affect the companies and respective SC. But recent history tells us this is not what has been happening, with the occurrence of prolonged port strikes. It is therefore of great importance for companies that rely on ports to be resilient and to find measures to minimize the impact of those strikes.
1.3. Objective
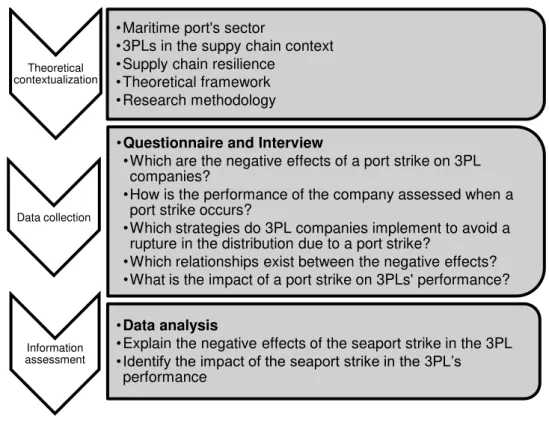
The study is focused on a particular disruption: the stevedores’ strike. The main objective of this study is to: i) evaluate the negative effects of a port strike in 3PL companies, ii) identify the impact of the negative effect in their performance levels, iii) find out what strategies the 3PL companies can implement so that the performance level does not decrease drastically and takes a minimum time to recover. The main contribution is to evaluate the role of 3PLs in the good functionality of a SC under a port disruption, so that their behavior will not compromise the performance of the entities downstream. Figure 1.1 provides an overview of the thesis work workflow.
Theoretical contextualization
•Maritime port's sector
•3PLs in the suppy chain context
•Supply chain resilience
•Theoretical framework
•Research methodology
Data collection
•Questionnaire and Interview
•Which are the negative effects of a port strike on 3PL companies?
•How is the performance of the company assessed when a port strike occurs?
•Which strategies do 3PL companies implement to avoid a rupture in the distribution due to a port strike?
•Which relationships exist between the negative effects?
•What is the impact of a port strike on 3PLs' performance?
Information assessment
•Data analysis
•Explain the negative effects of the seaport strike in the 3PL
•Identify the impact of the seaport strike in the 3PL’s
Which are the negative effects of a port strike on 3PL companies?
How is the performance of the company assessed when a port strike occurs?
Which strategies do 3PL companies implement to avoid a rupture in the distribution due to a port strike?
Which relationships exist between the negative effects? What is the impact of a port strike on 3PLs’ performance?
1.4. Methodology
This thesis follows a methodology of a case study, which we believe is the most adequate method when the objective is to understand, explore or describe events in a complex context in which several factors are simultaneously involved. As stated by Ponte (2006), a case study is an investigation that deliberately focuses on a specific situation that is supposed to be unique or special, at least in some aspects, seeking to discover in it the most essential and characteristic, and thereby contribute to the overall understanding of a certain phenomenon of interest.
The case study comprises three companies that perform services as logistics providers in the SC. One is an inland forwarder, another a shipping company and the third is a port operator. All of the three companies operate with containers in an international level, making them highly dependent of the good functionality of ports, a key point in their SC network. In this research, the investigation focuses on the impact of port strikes in 3PLs companies. The data consists in primary sources, involving questionnaires and interviews, and secondary sources like television news, websites and conferences. The primary data collection instrument is a questionnaire subdivided in two phases, a first phase answered via e-mail and a second phase consisting of a personal interview. The questions answered are based on the assumption of a long strike (more than 1 month) with medium-high adherence, similarly to the strikes in the Port of Lisbon that have been occurring since 2012.
1.5. The content
The structure of the thesis is divided in 7 chapters: Chapter I introduces the problem under study and the objective of this thesis. Chapter II presents an overall view of the worldwide port economy and its significance to Portugal. Chapter III introduces the concept of 3PL companies, their competences and importance. Chapter IV introduces the concept of SC resilience and associated aspects, such as: risk, disruptions, mitigation and contingency strategies and vulnerability. Chapter V provides a theoretical framework in order to better contextualize the case study. Chapter VI presents the methodology followed in this study, as well as the reasons behind it. Chapter VII introduces the companies within this study, along with results retrieved from the interviewees questionnaire answers. It also presents
Chapter 2 - Maritime port's sector
2.1. The contemporary worldwide sea trading system
The book “how the shipping container made the world smaller and the world economy bigger” by
(Levinson, 2008) provides a comprehensive history of containerization. The following text resumes some of the main facts retrieved from this book.
The idea of using containers as the main form of worldwide sea trading system was born in 1937, when Malcolm Mclean, a 24-years-old from New Jersey and founder of Sea-Land, had the idea of storing and shipping cotton in big metal boxes, that could be embarked in vessels. Over time, McLean improved his working methods as his company, Sea-Land (Maersk-Sealand later) expanded, making it one of the pioneers of the intermodal system, covering sea, river, rail, and port terminals.
The beginning of the container age was marked by the expedition of the ship IDEAL X on April 26, 1956, carrying 58 containers and 15.000 tons of oil. However it would take ten more years of hard work and planning before Sea-Land made an international containerization. On May 5, 1966, the adapted freighter "SS Fairland 'Sea Land, unloaded 50 units in Rotterdam, then the largest port in the world. As there was no proper equipment, the landing was done with the crane ship itself, another one
of McLean’s creations. This was the maiden voyage of the Sea-Land to the European market and the first step towards internationalization. The speed and efficiency of the discharge of containerized goods led the shipping industry to quickly realize that this was the trading method of the future.
At that time, there were 9.000 stevedores working in the large Dutch Harbor, linking 25 service companies. Foreshadowing the revolution that would occur in shipping industry, the port director, Frans Posthuma, got the exclusivity of receiving containers destined for Europe, committing himself to prepare a terminal to land them. Soon after, in 1967, five stevedores companies operating in Rotterdam created the Europe Container Terminals, with only 208 employees to meet the growing movement of containers. The industry reacted to navigation unimaginable investments in ships, containers and terminals, evolving along with the demand, creating new agreements between competitors, shipping agencies and shipowners.
With the increase of globalization, and the new economic geography it produced, many opposing barriers were overcome, allowing companies whose ambitions were purely domestic to become international companies exporting their products half way around the world almost as effortlessly as selling them nearby, and thus those who had no interest on going international, realized they had no other choice. One of the major changes that companies have to face, due to the globalization, is the challenge of transporting larger quantities for a smaller price (Buckley & Ghauri, 2004; Fawcett & Closs, 1993; Mussa, 2003).
With the increase of shipping demand and the evolution of technology, the costs associated with shipping decreased. Multinational manufacturers started to network their factories based on the cheapest location in which they could make a particular item, and to shift production from one place to another as costs or exchange rates might dictate (Levinson, 2008).
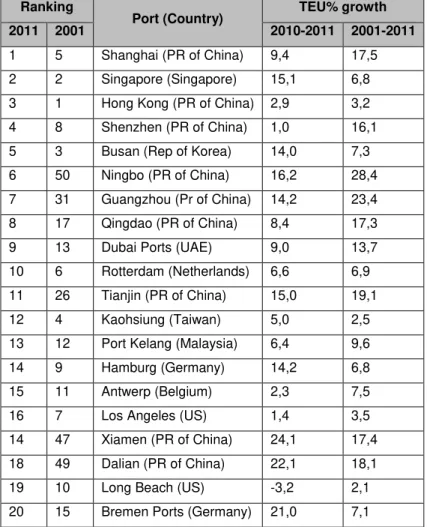
Due to the evolution of globalization, sea trade has changed considerably over the last years, and nowadays, in a global economy, ports are absolutely essential, as 90% of the European Union external merchandise trade and 40% EU internal merchandise trade is transported by ship (Buck Constultants, Catram Consultants, & ISL, 2009). Every year, over 35x108 tons of cargo passes through European ports (Da Cruz, Ferreira, & Azevedo, 2013). The worldwide container shipping industry is arguably one of the most critical links in the expansion of trade and global SCs (Doherty, Philip, & Misrahi, 2012).
Table 2.1 - TEU-ranking and growth% of the top 20 world container ports in 2011 Source: ISL (2012)
Ranking
Port (Country) TEU% growth
2011 2001 2010-2011 2001-2011
1 5 Shanghai (PR of China) 9,4 17,5 2 2 Singapore (Singapore) 15,1 6,8 3 1 Hong Kong (PR of China) 2,9 3,2 4 8 Shenzhen (PR of China) 1,0 16,1 5 3 Busan (Rep of Korea) 14,0 7,3 6 50 Ningbo (PR of China) 16,2 28,4 7 31 Guangzhou (Pr of China) 14,2 23,4 8 17 Qingdao (PR of China) 8,4 17,3 9 13 Dubai Ports (UAE) 9,0 13,7 10 6 Rotterdam (Netherlands) 6,6 6,9 11 26 Tianjin (PR of China) 15,0 19,1 12 4 Kaohsiung (Taiwan) 5,0 2,5 13 12 Port Kelang (Malaysia) 6,4 9,6 14 9 Hamburg (Germany) 14,2 6,8 15 11 Antwerp (Belgium) 2,3 7,5 16 7 Los Angeles (US) 1,4 3,5 14 47 Xiamen (PR of China) 24,1 17,4 18 49 Dalian (PR of China) 22,1 18,1 19 10 Long Beach (US) -3,2 2,1 20 15 Bremen Ports (Germany) 21,0 7,1
2.2. Maritime cargo
Cargo transported by port vessels may be primarily differentiated according to the type of material being carried. Cargo can be classified in the following categories:
General Cargo: Includes a large range of diverse goods, which can be subdivided in the following classes:
Pre-slung cargo: cargo remains trapped inside the slings that travel with the ships. This is a simple and inexpensive method, which can increase the productivity of stevedoring operations.
Pallet: cargo is transported and deposited on metal or wooden pallets of various dimensions, although there are trends to standardize them. They facilitate the load and discharge operation, with the use of specialized machinery.
and other materials. They may also have special features to ensure that the cargo is properly cooled and ventilated.
Roll-On/Roll-Off cargo: cargo is shipped in a horizontal movement by containers on chassis, for example. Vehicles like cars and trucks can also be included in this type of cargo.
Cargo shipped in barges: the cargo is stored in barges that ensure its transport to the main vessel. Subsequently, they are hoisted directly from the barge to the respective ship.
Bulk cargo: Covers all the products that are transported homogeneously and may be continuously manipulated. Bulk cargo can be classified in two major groups:
Solid Bulks: That can be further divided in:
o Ordinary Bulks: covers minor density granular substances like cereal, fertilizer or salt. o Ore Bulks: include substances of greater density.
Liquid Bulk: That can be subdivided in:
o Ordinary Bulk: Noncombustible and nontoxic liquid products, such as, water, wine, or olive oil, among others.
o Petroleum products: including crude oil and its derivatives.
o Liquefied Gases: includes natural gas, gases derived from oil distillation, like propane and butane, and chemicals such as methanol and various acids.
There are also two other different types of shipping between ports, according to the distance of the transport: i) deep sea shipping (ocean-crossing intercontinental shipping) and ii) short sea shipping, with no crossing of an ocean. The later can be further subdivided into:
Feedering services (small and medium TEU capacity feeder ships that transport shipping containers to central container terminals, to be consolidated for long distance transport in larger vessels).
Cabotage (shipping along coastal routes). Micro-cabotage.
River-sea transport.
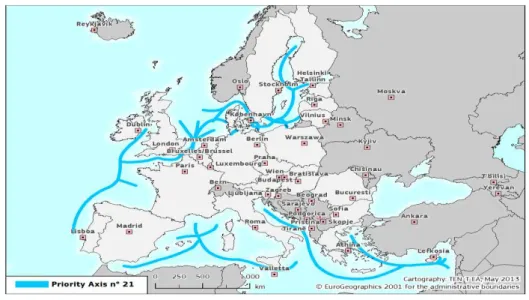
At this moment in the European Union, routes have been defined as shown in Figure 2.2, but not all of them are yet operational. Leixões, Lisbon, Sines, Setúbal and Aveiro are the Portuguese ports with the capacity to operate in motorways of the sea services. However only Leixões, Lisbon and Sines ports are actually in the Trans-European Transport Network, a network which objective is to create a coherent European transportation system. It includes: i) feedering to combine deep sea transport with redistribution per secondary ports on smaller vessels, structuring the activity in a network of small ports around the main port; and ii) cabotage to transport passengers and goods between ports.
Figure 2.2 - Motorways of the sea Source: TEN-T EA (2013)
2.3. Maritime ports
A port is an area sheltered from waves and currents, located on the edge of an ocean, sea, lake or river, for the mooring of boats and ships, with staff and services necessary to provide activity of loading and unloading cargo, and capable of temporarily stock cargo, as well as facilities with the capacity for the movement of people and cargo around the port sector (Brodie, 1997). According to Loh & Thai (2012), ports are companies where various individuals and interests coexist, and where internal and external groups collaborate to create and distribute value or wealth, while also pursuing their own interests and objectives. The port should be considered as a link between the maritime and land network and not just as an arrival or departure point (SaeR & ACL, 2009).
Different kind of port activity demands different kind of ships, carrying different kind of cargo, and consequently different kind of ports:
the sea, with the purpose of becoming a route’s strategic point and creating partnerships with other European ports.
Regional ports: ports with capabilities to perform commercial and distribution functions, within a regional scope.
Local ports: ports with clearly local functions without proficiency to operate in international transport networks, and more oriented to fishing activities and recreational boating.
Intermediate hub (or transshipment hub): is a port terminal used for ship-to-ship operations within a maritime transport system. These operations do not take place directly, which requires the temporary storage of containers in the port's yard (Rodrigue, Comtoisn, & Slack, 2006).
Ports have been natural sites for transshipment to transfer goods from one mode of transport to another, handling in the past two years, 90%of the volume of cargoes transported over the globe (UNCTAD, 2012). Every day at every major port, thousands of containers arrive and depart by truck and train, providing a link between maritime and inland transport and the interface between the sea and rivers and roads and railways. They establish the inter-modal interface between maritime, road and rail transport (Levinson, 2006; Radhika, 2012; Song & Parola, 2013).
Processes such as changes in containers and ship dimensions are forcing ports to improve their infrastructures in order to remain competitive, attract more shipping lines and consequently boost their performance (Da Cruz et al., 2013). In accordance to Islam & Olsen (2011), one of the most dynamic problems that maritime ports decision makers have, is the need to properly analyze where and how to upgrade the existing port capacity for rising port demands due to continuous growth in containerized trade and the tendency for bigger ships to harbor.
Itoh (2002), claims that for a port to be operationally efficient, it should take into consideration aspects such as the layout design, maintenance of berths, port strike ratio, gear of cargo handling, accessibility, warehouses, stacking areas, navigation assistance and other waterside and land-side facilities.
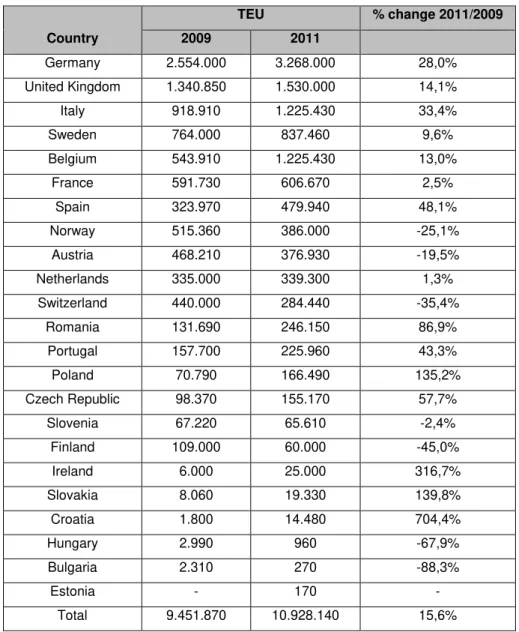
All these attributes and others such as geographic location, reliability, flexibility, capacity, traceability, but especially, proximity to other transportation methods (to allow intermodal transportation and the seamlessly transportation of cargo between ships, trains and trucks with minimum interruptions) will contribute to an increase in the demand of the port.
Table 2.2 - Domestic intermodal transportation by country: TEU and goods shipped 2009/2011 Source:International union of railways (2012)
Country
TEU % change 2011/2009
2009 2011
Germany 2.554.000 3.268.000 28,0% United Kingdom 1.340.850 1.530.000 14,1% Italy 918.910 1.225.430 33,4% Sweden 764.000 837.460 9,6% Belgium 543.910 1.225.430 13,0%
France 591.730 606.670 2,5% Spain 323.970 479.940 48,1% Norway 515.360 386.000 -25,1% Austria 468.210 376.930 -19,5% Netherlands 335.000 339.300 1,3% Switzerland 440.000 284.440 -35,4%
Romania 131.690 246.150 86,9% Portugal 157.700 225.960 43,3% Poland 70.790 166.490 135,2% Czech Republic 98.370 155.170 57,7%
Slovenia 67.220 65.610 -2,4% Finland 109.000 60.000 -45,0%
Ireland 6.000 25.000 316,7% Slovakia 8.060 19.330 139,8% Croatia 1.800 14.480 704,4% Hungary 2.990 960 -67,9% Bulgaria 2.310 270 -88,3%
Estonia - 170 -
Total 9.451.870 10.928.140 15,6%
In order to keep demand growing, and to be able to gain customer loyalty while facing companies pressure to decrease their costs, particularly logistics costs, ports started to invest in information and communication systems, intermodal systems and added-value services. Investments in infrastructures and the outsourcing of logistics teams to operate on the products of the ports’ clients are good
examples of port’s investments (Radhika, 2012; SaeR & ACL, 2009). This increase in integration between entities, and the increase in logistics complexity it implied, led to the necessity of having a better management system in the port environment. This way the port environment started to be taken as a crucial factor to be considered in SC management.
divided among numerous service providers. Altogether, this resulted in a lack of standardization of load units, information systems, administrative regulations and procedures. According to (OECD, 2002):
“Although the standardization of load units which is essential to improve efficiency, mainly because of the intermodal transportation, it has proven to be difficult to achieve it due to factors such as infrastructure restrictions, preferences of road haulers and the increasing container sizes in maritime transport.”
The application of advanced information and communications technology, has allowed noteworthy improvements in the providing of continuous service through the use of electronic data interchange. However, the success of electronic data interchange depends not only on standardized data sets but also on compatible electronic data interchange systems between and among the intermodal entities and governments.
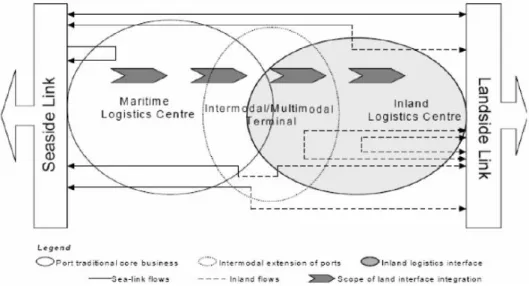
In maritime commerce there are numerous entities operating, and SCs can be extremely complex, with a lot of echelons and tiers. A simple disruption can widely propagate along the SC. In Figure 2.3 it is possible to see a port as an integrated logistics center with three main areas connecting the Landside link to the Seaside link. Within these three areas entities such as port authorities, customs, shipowners, freight forwarders, navigation agencies, port operators, stevedoring companies, among others, work together and are dependent on each other’s. Due to the high inter-dependence of these entities, if one of them stops all others may be affected - for example, if all stevedores’ strike, the intermodal terminal would not operate and could lead to a full stoppage of the port.
Figure 2.3 - A port as an integrated logistics center Source: SaeR & ACL (2009)
The stevedores are the intermediaries between the shipping lines and the transport operators. As well as undertaking stevedoring activities (lifting cargo on and off vessels –the “ship side” activities), they also provide terminals for container transit and for the loading of containers on and off trucks and rail
(the “landside” activities) (IPART, 2007).
2.4. Ports in Portugal
This section was written with data retrieved from the conference Fórum Empresarial da Economia do Mar (2013), a study made by the associations SaeR & ACL (2009), and using the IPTM (2012) statistics.
Portugal’s geographical position and the Portuguese know-how about exploration and exploitation of the oceans, is a potential generator of business opportunities. The Portuguese ports management and regulations changed over the years due to economic and political issues and at the moment, they are structured as follows:
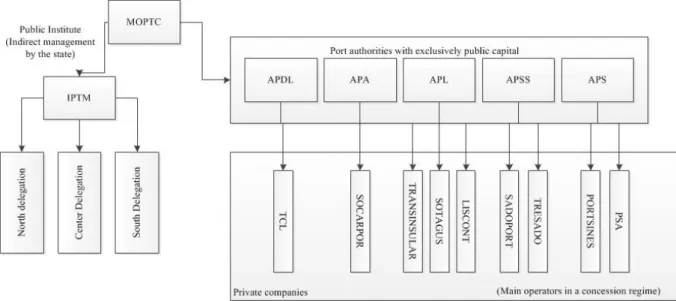
Main ports: located in Leixões, Aveiro, Lisbon, Setúbal and Sines. They are managed by port authorities, which are companies with exclusively public capital operating under the auspices of two ministries: Ministério das Obras Públicas, Transportes e Comunicações (MOPTC –
Ministry of Public Works, Transport and Communication) and Ministério Finanças e Administração Pública (MFAP – Ministry of Finance and Public Administration). These authorities have the form of limited companies with state capital and with full management autonomy, although superior overseen by the central administration.
Secondary ports: located in Viana do Castelo, Figueira da Foz, Portimão, Faro and other ports situated in the Douro region. These ports are regulated by the Instituto Portuário e dos Transportes Marítimos regulations (IPTM – Institute of Ports and Maritime Transport).
Figure 2.4 - Structural scheme of the port authorities, IPTM and main operators in a concession regime in Portugal
Adapted from: Brito (2013)
Leixões port is the major port infrastructure of the North Portugal handling around 16.000.000 tons (along with the Douro port). Half of the cargo handled is Liquid Bulk, although it has capacity to accommodate every type of cargo. The privileged geographic position also allows this port to be part of touristic cruise ships route.
With a capacity to accommodate containerized or Ro-Ro cargo, the port of Aveiro is classified as a main port. Currently it handles a little more than 3x10⁶ tons, divided between general fractional cargo and liquid bulk. The port has the capacity to enter into the Motorways of the Sea network.
The Port of Lisbon presents very good maritime conditions, in terms of accessibility and shelter, with a privileged location that grants strategic value. Despite being in the urban center of Lisbon, it has a high handling capacity of transoceanic containerized cargo and short sea shipping which represents 40% of the current 11.000.000 tons. It is also a privileged place for the reception of tourism cruises.
The port of Setubal, handles about 6.000.000 tons, and it ensures the highest portion of general cargo among the national ports and almost the all of the Ro-Ro cargo. His Multipurpose Terminal 2 is ready to handle moving containers, accommodate transoceanic vessels. In addition to general and Ro-Ro cargo, the port handles countless products which are associated to nearby industries.
2.5. Conclusion
Chapter 3 - Third-party logistics providers in the supply chain
context
3.1. Third-party logistics providers
The process of globalization and economic integration between countries has pushed companies to redesign themselves so they can survive. With flourishing global trade, fierce competition, higher customer expectations, and ever-expanding SCs around the world. 3PL play an increasingly important role in the prevailing dynamic and volatile environment (Murphy & Daley, 2001). In the last few years there has been considerable interest in the growth of 3PL all over the globe. Companies are rapidly focusing on one-stop global logistics services. 3PL’s can improve logistics processes by allowing the
companies to focus on their core competencies, ultimately reducing business costs and increasing client satisfaction (Sheikh & Rana, 2011). Table 3.1 lists the usual services performed by 3PL’s.
Table 3.1 - Services provided by 3PL Source: Regan & Song (2000)
Type of service Examples
Transportation Distribution General trucking/shipping service
Intermodal transportation service (rail, road, ocean, air freight)
Specialized services (bulk, tank, hazardous material, refrigerated…)
Time-constrained services (just-in-time, overnight, same day…)
Shipment tracking & tracing
Warehousing/Distribution Public / Contract / Regional warehouse
Operation technology (bar coding, radio frequency…)
Value-added services (cross-docking, freight consolidation, pick & pack…)
Order processing and fulfillment Custom Services Custom brokerage
Duty drawback Freight Finance Services Freight audit
Freight bill payment IT Support EDI capability
Logistics information system & other software’s
Product Support Services Reverse logistics
Value-added services (package, label, mark…)
Logistics Management/ Consulting Fleet operation
Distribution network design
3PL companies provide a wide range of logistic services related to freight forwarding, shipping, handling, storage and packaging of goods in different logistics flows and SCs (Kilibarda et al., 2012). But they may also manage and develop features such as information systems and inventory, and also provide customer-order fulfillment services (Boyson et al., 1999). These interactions can turn into partnerships or alliances, which many authors consider as a crucial strategy to increase service value. According to Berglund, Laarhoven, Sharman, & Wandel (1999): 3PLs add value to users through improvement in operations and efficiency, getting results to their shareholders. Therefore, logistics outsourcing could bring a handsome payoff and become a part of corporate strategy (Sahay & Mohan, 2006).
So we can define a 3PL as an external provider who manages, controls, and delivers logistics activities of their clients. This relationship can be formal or informal, the intention is that this should be a mutually beneficial and continuous relationship. A strategic alliance between the 3PL provider and the client is often necessary to guarantee the quality of the performance (Hertz & Alfredsson, 2003).
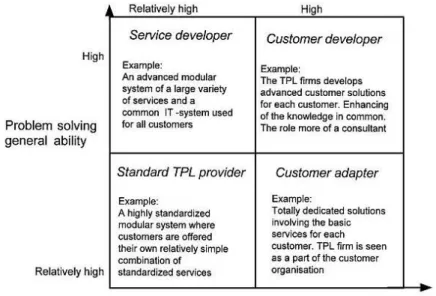
Two major skills in a 3PL are: i) the ability to balance between adaptation and general ability of problem solving, and ii) the aptitude to balance between capability to highly adapt to individual costumers and organizing the systems and business in order to coordinate several costumers. Hertz & Alfredsson (2003), delineated four types of TPL providers based on 3PL providers’ “ability of problem solving” and their “ability of customer adaptation”. In Figure 3.1 it is possible to analyze the characteristics of third-party logistics with high ability of problem solving and high ability of costumer adaptation.
Figure 3.1 - 3PLs characteristics Source: Hertz & Alfredsson (2003)
services. For example, this entity differentiates services according to customers, reduces stocking costs through cross-docking, offers personalized security systems and personalizes packages to different occasions.
An advanced service package often requires diverse sets of standardized activities that, when turned
into models, can be connected according to each customer’s characteristics. The “customer adapter" improves handling efficiency by taking over their activities and not necessarily developing services.
This type of provider takes responsibility of all customers’ warehouses and logistics activities,
therefore, pledging to a short number of close clients. The most complex and advanced 3PL form is the "customer developer". This type of 3PL often takes over all of the customer’s logistics operations,
which involves a high integration with the client. In order to be efficient in this type of operation, 3PL must have a huge know-how and accurate methods. 3PL with costumer developer scope has fewer costumers than the others, due to the extensive and complex work they perform for each costumer.
3.2. The importance of partnerships
The establishment of strategic alliances has been used as a reaction to globalization and to the increase of uncertainty and complexity in business (Išoraitė, 2009). According to McKeon (1988), the traditional business-to-business relationship is transactional, while in a strategic alliance relationship it extends over a long period of time, involves sharing of benefits and burdens, involves extensive planning and includes detailed operational information exchange. This way both parties can profit from the collaboration, and a continuum relationship may lead to a higher dependency, cooperation and trust, if the parties involved are focusing on customer satisfaction. And when businesses do not go as planned, the risk can also be minimized.
A partnership is defined as ‘‘a tailored business relationship based upon mutual trust, openness, shared risk, and shared reward that yield a competitive advantage, resulting in business performance greater than would be achieved by the companies individually’’ (Lambert et al., 1999). In order to have a functional long-term alliance, the partnership should be able to provide flexibility (Lambert et al., 1999). A well-succeeded partnership will ensure advantages such as, decreased storage and labor costs, increased productivity, increased know-how, market expansion, and because of the
dependency, the parties involved will reach out and help one another’s. An example is the resilient practice of aiding the suppliers financially when they are in a bankruptcy or insolvency situation.
Also Carbone & De Martino (2003); Heaver, Meersman, & Van de Voorde (2001), referred the case of port operators working within ports
There are several of other strategic alliances that may be made in the port environment. An example is CMA-CGM, a liner shipping company that has a concession on the port of Le Havre, which supplies value added logistics services to European retailers (e.g. Carrefour and Danone) through a strategic alliance with SDV international logistics (Brooks et al., 2013). Le Havre port also provides Renault with advantages in their productive process, through storage decentralization downstream in the SC with the vehicle preparation center in Le Havre, minimizing stock level and related costs for Renault. Renault also benefits in terms of transportation costs and capacity through the completely knock-down transportation method, performed by CMA-CGM (Carbone & De Martino, 2003). In this method the automobile parts are built in the factories/distribution centers and later on exported to be assembled in the destination point; in this case, the vehicle preparation center in Le Havre.
It is easily comprehensible why such partnerships are of great interest. For example, a shipowner will have interest in creating a partnership with a distributing company that operates in ports, because in situations such as a strike of truck drivers in the distribution sector, he will have a partner that is able to aid him, and he may even end up with a better outcome due to a higher performance comparatively to competitors. But, as studies demonstrate, 55% of 3PL relationships end after three to five years (Gulisano, 1997; Sahay & Mohan, 2006). Lambert et al. (1999), notes the main reasons for partnership failures: i) lack of shared/clear goals, ii) lack of communication, iii) lack of top management support, iv) lack of strategic direction, v) lack of mutual benefits, vi) uncertainty about provider’s service levels, vii) unrealistic expectations, viii) uncertainty about provider’s, ix) poor service levels, x) unrealistic expectations, among others.
3.3. Choosing a 3PL
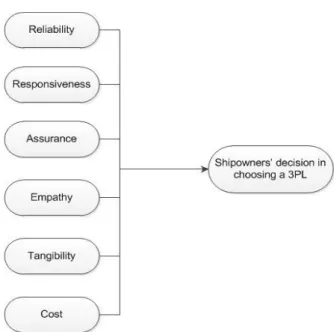
When companies choose to outsource activities in their business, some critical factors need to be taken into account: reliability, responsiveness, assurance, empathy, tangibility, cost. The wrong decision when choosing an outsourcing company can jeopardize the business and image of a company, which in turn may lead to long-term negative impact.
Figure 3.2 - Critical factors in choosing a 3PL Source:Banomyong & Supatn (2011)
Table 3.2 - Relevant decision factors Source: Banomyong & Supatn (2011)
Reliability Responsiveness Assurance Empathy Tangibility Cost
Transit time Service consistency
Document accuracy
Responsiveness Variety of services
Express delivery Global coverage Updated rates Track and trace Containerization Consolidation
Reputation No goods damages
CRM Employee
courtesy
Location Modern equipment
Own CFS E-services Electronic data interchange
Price Discount Credit term
Legend: CRM: Customer relationship management; CFS: Container freight station; E-services: Use of
information communication technologies
A successful shipowner-3PL relationship, is characterized in the literature by the following features, as cited by Makukha & Gray (2004):
Operational efficiency and effectiveness orientation. Cost reduction is a major driver.
It is also imperative to emphasize the importance of a proper information system when using 3PLs: these alliances can only work properly if the information-flow between the parties involved is efficient and organized (Lai, Zhao, & Wang, 2006). Information technology in 3PL companies plays a vital role in synchronizing complex SC activities across logistics entities and their customers, working as a bridge, connecting customers in SC and logistics users (Lai et al., 2006).
Technology is critical since it increases SC visibility: for instance, the port community information system is an example of technology that has allowed the port to expand its own boundaries towards the hinterland. In this system, generally managed by the port authority, each network entity (shipping companies, terminal operating companies, port service providers, maritime agents, multimodal transport operators, freight forwarders, logistics operators, distributors, retailers and manufacturing companies) shares customized information on inbound and outbound flows, increasing the communication efficiency and effectiveness in the port (Brooks et al., 2013).
3.4. Measuring the performance of logistics providers
Key performance indicators (KPIs) gather a compilation of information that can be analyzed, with the objective of better understanding the company’s overall performance (Torres et al., 2012). The KPIs help the company to recognize the problems in a certain activity. Moreover, they assist in the evaluation of the company’s efficiency and effectiveness. They represent the basis for measuring business and project success. The purpose is to empower the measurement of performance within companies and the industry, allowing to companies to perform benchmarking (Konsta & Plomaritou, 2012).
Konsta & Plomaritou (2012) quotes Neely (1998), who states that in the management world there are seven reasons to use performance measurement’s: the changing nature of work; increasing competition; specific improvement initiatives; national and international quality awards; changing organizational roles; changing external demands; and the power of information technology. Other reasons for using KPIs that aim to align business activities with the strategy of the organization performance against strategic goals are: increase focus on strategy and results, measure what matters and improve performance, align strategy with what human resource can do, improve communication, and put in priority projects (Konsta & Plomaritou, 2012). As affirmed by Maskel (1991), KPIs must:
Be directly related to the manufacturing strategy. Primarily use non-financial measures.
Change over time as needs change. Be simple and easy to use.
Provide fast feedback to operators and managers.
Be intended to foster improvement rather than just monitor performance. Be visible and shared with all employees.
Be used to drive the continuous improvement process.
uncertainty in the SC (Andreoli, Goodchild, & Vitasek, 2010). In the context of this thesis, the KPI’s of physical distribution activities are of great importance, as it aims to study the negative impact of a disruption (port strike) on 3PL performance. Table 3.3 contains some of the most common KPIs and respective measure, relative to physical distribution.
Table 3.3 – KPIs used in the physical distribution context
Source: Freight Best Pratice (2005); Konsta & Plomaritou (2012); Varma (2008)
KPIs Measures
Total order lead time Average order to invoice time
On-schedule service Percentage of on-schedule services
Cargo availability at destination point Ratio between total available and total cargo
Transport lead time Average time per order
Overall cargo damages/losses/thefts Percentage of unavailable cargo
Delays Delays percentage
Total greenhouse emissions Average Diesel consumption
Transport cost Average transportation cost
Cargo backlog Percentage of backlogged cargo
Travel speed Average speed per transport
Cargo re-routing Percentage of diverted cargo
Injuries and fatalities Percentage of Injuries and fatalities
Quantity per travel Tones carried per travel
Documentation sent out within 48 hours of freight
departure Percentage of on-time documentation
Some of the most used KPIs in the port sector are identified in the following list, as provided by several works, e.g. Soberón (2012), Smith (2012), Olivier (2011), Marques & Carvalho (2007):
Cargo handled per year.
Containers effectively handled per month. Maximum handling capacity per month. Global operational area.
3.5. Conclusion
Chapter 4 - Supply chain resilience
4.1. The resilience paradigm
Nowadays factors such as global economic performance, market and competitors’ expansion and high expectancies in quality services from costumers, lead to the necessity for SC to have a quick recovery in case of a disruption (Carvalho, 2012). Also, companies need to minimize the severity of the damaged caused by disruptions. They realize that disruptions, such as a loss of one critical supplier due to a fire in the factory or even because of a terrorist attack, cause high operational and financial undesirable impacts (Stecke & Kumar, 2009). Over the years, the trend focuses on SCs’ search for procedures that can handle these types of situations. It is in this context that the resilience paradigm has a significant importance.
Resilience is described as an attribute that allows the SCs to be more competitive when disruptions occur (Christopher & Peck, 2004; Ponomarov & Holcomb, 2009; Sheffi, 2005b). The correct implementation of this paradigm allows companies and their SCs to handle the always inevitable disruptions, with more efficiency. Modern SCs are in fact dynamic networks connecting companies and industries. No organization is an island – even the processes which are carefully controlled, are only as good as the connections and knots that support them (Christopher & Peck, 2004). The problem is that many companies left risk management and the permanency of the business in hands of safety and insurance professionals. However, the construction of a resilient organization must be a strategic initiative that changes the operational way and increases competitiveness (Sheffi & Rice Jr, 2005).
Decreasing of vulnerability means not only the reduction of the probability of the occurrence of a disruption, but also more resilience – the capacity to recover from a disruption. Resilience can be achieved through creation of redundancy or at least flexibility (Sheffi & Rice Jr, 2005). To be able to reduce the risk (probability of occurring a disruption), SC strategies must be developed, allowing it to incorporate readiness, provide efficient and effective answer to the risk, and be able to recover to its original state, or even achieve a better one after a disruption (Ponomarov & Holcomb, 2009). But, as many authors like Greening & Rutherford (2011) state, the unpredictable nature of disruption makes it difficult to mitigate risk, and because of this, high-management should focus on the possible consequences that the disruption can cause, instead of what can originate them (Sheffi, Rice, Fleck, & Caniato, 2003).
Table 4.1 - Resilience definitions
Author Resilience definition
Christopher & Peck
(2004) Resilience capability helps a SC to get back to original state followed by disruptions Masten, Best &
Garmezy (2008) The process of, capacity for, or outcome of successful adaptation despite challenging or threatening circumstances
Gordon (2009) In the world of science, the resilience concept can be initially traced back in engineering, representing the quality of a material of being able to store strain energy and then upon unloading to have this energy recovered, without breaking or being deformed
(Ponomarov & Holcomb, 2009).
The resiliency of a SC is its capacity to deal with unforeseen events, to respond to the disruptions they might cause, and to recover while maintaining the chain performance at a desired level
Hong, Paul & Hwang
(2011) SC resilience supports companies in proactively responding to changing market demand and disruption ahead of their competitors
Carvalho, Guilherme Tavares, &
Cruz-Machado (2012)
SC resilience is concerned with the system ability to return to its original state or to a new one, more desirable, after experiencing a disruption, and avoiding the occurrence of failure modes. The goal of SC resilience analysis and management is to prevent the shifting to undesirable states, i.e., the ones where failure modes could occur
According to Sheffi & Rice (2005) resilience can be achieved by either creating redundancy or increasing flexibility. To Jüttner & Maklan (2011) redundancy is “related with the number of possible
states a SC can take and number of changes it is able to cope with”. As already stated above, common forms of redundancy in SC are constitution of safety stocks, the deliberate use of multiple suppliers (even when the secondary suppliers have higher costs), and deliberately low capacity utilization rates, and although redundancy is always present in SC with a resilient strategy, it represents high costs, and limited benefits, unless needed. As for flexibility, “it ensures that changes
caused by the disruption can be absorbed by the SC through effective responses” (Jüttner & Maklan, 2011). According to Yossi Sheffi (2005), flexibility uses practices such as:
Adopting standardizing processes to master the ability to move production among plants by using interchangeable and generic parts in many products.
Planning to postpone, designing products and processes for maximum postponement of as many operations and decisions as possible in the SC, keeping products in semi-finished form affords flexibility to move products from surplus to deficit areas.
Aligning procurement strategy with supplier relationships, since companies with strong relationships oriented to the same goal and sharing common objectives are less likely to be forewarned about supply problems.
Implementing continuous communication among informed employees, to keep the personnel aware of the strategic goals, tactical factors, and day-by-day and even minute-by-minute pulse of the business.
The deployment of such practices makes it possible to create a competitive advantage in daily operations, although, an accurate cost/benefit analysis must be done previously to reach an internal functional equilibrium, so that resilient practices do not consume all company’s resources. According to Sodhi & Chopra (2004), “The big challenge for managers is how to mitigate risk intelligently
positioning and sizing SC without decreasing profits. So while stockpiling inventory may shield a company against delivery delays by suppliers, building reserves in an undisciplined fashion also drives
up costs and hurts the bottom line”.
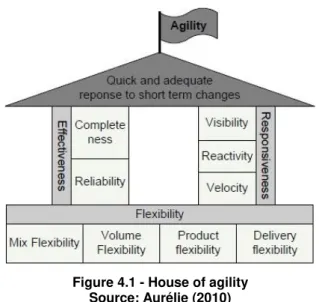
A resilient SC must be agile and the concept of SC agility appears associated to flexibility, as seen in the "House of Agility" illustrated in Figure 4.1.Although flexibility is a key component, it is not the only capability needed to achieve SC agility. Enhanced responsiveness and effectiveness are also major capabilities of an agile SC. The capacity of adaptation is also of major importance, because it is necessary to a SC to be prepared for the occurrence of unexpected events and to be able to quickly respond and recuperate from the negative effects, so it can return to the pre-disruption state, or adapt to a better one.
Figure 4.1 - House of agility Source: Aurélie (2010)
Another common characteristic in the several definitions of resilience is "speed”. A key concern of resilient SCs is to have a quick recovery to its normal behavior after the disruption. The variation of performance and speed recovery due to a disruption is related to the concept of “resilience triangle”, that helps visualize the magnitude of the negative impact of the disruption (Figure 4.2).
P
erform
anc
e
P
erform
anc
e ????
The "resilience triangle" has limitations such as the incapability to capture the disruption probability of occurrence, since it only models the systems behavior when subjected to a disruption. Additionally the
“resilience triangle” does not consider the situations in which the performance is improved after the disruption, or where the performance does not recover back to its original state (Carvalho, 2012).
4.2. Supply chain risk, vulnerability and disruptions
The concept of risk is often confused with disruption. Many authors define, characterize and analyze the concept of risk inherent to a SC as being a kind of disruption or a source of disruption. So it is important to differentiate and define what is a risk and what is a disruption. Literature about risk is very rich and provides us with a lot of different, but yet similar definitions:
Risk can be broadly defined as a chance of danger, damage, loss, injury or any other undesired consequences (Harland, Brenchley, & Walker, 2003).
The probability that a particular adverse event occurs during a stated period of time, or results from a particular challenge (Royal Society, 1992).
The probability of loss and the significance of that loss to the organization or individual (Mitchell, 1995).
Risks in SCs are dynamic in nature; the frequency and severity of risk events keep changing. Some risks can be reduced or even eliminated, while new ones may appear anytime (Ravindran, Ufuk Bilsel, Wadhwa, & Yang, 2010).
Risk in general can be defined as a collection of pairs of likelihood and outcomes (or impact) (McCormack et al., 2008).
One of many possible models for the connection and relation between possible risks and the SC is the one presented by Wagner & Bode (2006), which distinguishes four interrelated terms:
Supply chain risk: is the deviancy between the expected value of a definite performance measure, which results in an undesirable consequence for the main organization. Therefore risk is equated to the loss due to the disruption of the SC. In this model the risk is taken as a purely negative event, not considering situations where it turns out to be a “pleasant adversity”, since it is not likely to turn out in real situations.
Supply chain disruption: is an unintended, untoward situation, which leads to SC risk. For the affected companies, is a rare and anomalous situation in comparison to the daily-business. The nature of the risk can be vastly divergent, since SC disruptions can materialize from various areas internal and external to a SC.
Supply chain vulnerability: While a SC disruption is the condition that leads to the occurrence of risk, it is not the only basis of the final outcome. It is logical that vulnerable SC has a higher probability to suffer a disruption which consequently leads to a SC risk.
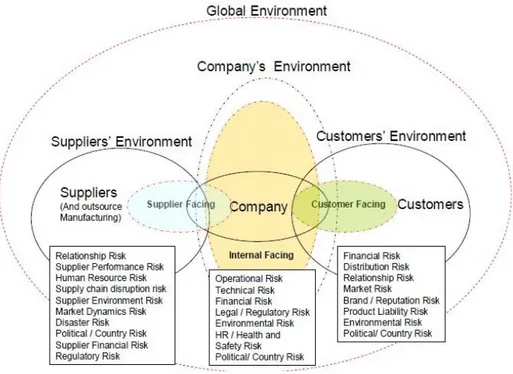
For a better comprehension of the SC environment and the definition of risk (McCormack et al., 2008) considers three perspectives: i) supplier facing, ii) internal facing and iii) customer facing, of the SC with the association of the respective risk. According to these authors: "Supplier facing looks at the
network of suppliers, their markets and their relationship with the “company”. Customer facing looks at
the network of customers and intermediaries, their markets and their relationships with the “company”.
Internal facing looks at the company, their network of assets, processes, products, systems and
people as well as the company’s markets" (McCormack et al., 2008). Figure 4.3 shows how the aggregation of the three perspectives forms a global risk environment. It also shows risks associated to each environment.
Figure 4.3 - Risk global environment Source: McCormack et al. (2008)