Pedro Miguel Vicente Bila Rodrigues
Licenciado em Ciências de Engenharia e Gestão Industrial
Developing an input-output model for
benchmarking company resource usage
Dissertação para obtenção do Grau de Mestre em Engenharia e Gestão Industrial
Orientadora: Prof. Dr. Isabel Maria do Nascimento Lopes Nunes,
Professora Auxiliar da Faculdade de Ciências e Tecnologia da
Universidade Nova de Lisboa
Co-orientadora: Prof. Dr. Agnes Pechmann, University of
Applied Sciences Emden/Leer
Júri:
Presidente: Prof. Doutor Rogério Salema de Araújo Puga Leal
Arguente: Prof. Doutora Helena Maria Lourenço Carvalho Remígio
Vogal: Prof. Doutora Agnes Pechmann
i
Developing an input-output model for benchmarking company resource usage
Copyright © Pedro Miguel Vicente Bila Rodrigues, Faculdade de Ciências e Tecnologia, Universidade Nova de Lisboa.
iii
ACKNOWLEDGEMENTS
I would like to thank my supervisors Prof. Dr. Isabel L. Nunes and Prof. Dr. Agnes Pechmann for all their support, availability and guidance that contributed for this dissertation development and completion.
v
ABSTRACT
The intensive exploitation of natural resources and the increased awareness regarding the impact of their consumption on the environment suggests the need to be more efficient and to encourage a sustainable use of these resources. This is also a major goal for all industrial companies that are currently facing high costs related to energy, water, and material resources for production while aiming to remain competitive in the market.
This dissertation introduces the development of a model, which through data input proceeding
from resource’s consumption in manufacturing companies generates an output of resource efficiency indicators in six different categories (materials, energy, water, wastewater, solid-waste; air-emissions) which are in turn used for benchmarking company resource usage and then provide a solid basis for decision-making regarding the implementation of resource efficiency measures, that shall lead companies to improve their overall efficiency and
profitability. In order to further assess the companies’ performance in terms of resource efficiency, it is applied a ranking system using fuzzy logic due to its ability to model complex realities and use subjective information based on human knowledge and experience.
vii
RESUMO
A exploração intensiva dos recursos naturais e o aumento na consciencialização do impacto que o consumo dos mesmos tem no ambiente sugerem a necessidade de aumentar a eficiência e encorajar o uso sustentável destes recursos. Este é também um objetivo essencial para empresas da indústria transformadora que enfrentam elevados custos de produção relacionados com o consumo de matérias-primas, energia e água ao mesmo tempo que tentam permanecer competitivas no mercado.
Esta dissertação introduz o desenvolvimento de um modelo no qual dados resultantes do consumo de recursos em empresas da indústria transformadora geram um conjunto de indicadores específicos para a eficiência de recursos, divididos em seis categorias (materiais, energia, água, desperdícios de água e de materiais e emissões) que permitem efetuar a comparação do desempenho relativo à utilização de recursos pelas empresas e fornecer uma base sólida de apoio à tomada de decisão relativamente à implementação de medidas de modo a aumentar a eficiência e rentabilidade das mesmas. De modo a avaliar o desempenho das empresas é desenvolvido um sistema de classificação assente na lógica difusa, devido à sua capacidade em modelar realidades complexas e usar informação subjetiva baseada no conhecimento e experiência humanos.
ix
Table of Contents
ABSTRACT ... v
RESUMO ... vii
List of Figures ... xi
List of Tables ... xiii
List of Abbreviations ... xv
Chapter 1 - Introduction ... 1
1.1 Framework ... 1
1.2 Scope and objectives ... 1
1.3 Structure ... 2
Chapter 2 - Theoretical background: Model framework ... 5
2.1 Resources and related efficiency measures ... 5
2.1.1 Concepts ... 5
2.1.2 European policies and international programmes ... 8
2.1.3 Implementing resource efficiency in manufacturing small and medium-sized enterprises 9 2.2 Benchmarking process ...12
2.3 Performance indicators ...15
2.3.1 Indicators: General definition and selection ... 15
2.3.2 Resource efficiency context: Overview of existing indicators ... 18
2.4 Fuzzy set theory...21
Chapter 3 - Methodology...23
Chapter 4 - Model Development ...27
4.1 Select and define an indicator set ...27
4.2 Boundaries definition, data collection and measurement procedures ...29
4.3 Resource usage benchmarking – Ranking System ...34
4.4 Verification of the model with theoretical values ...38
Chapter 5 - Conclusions and Future outlook ...45
xi
List of Figures
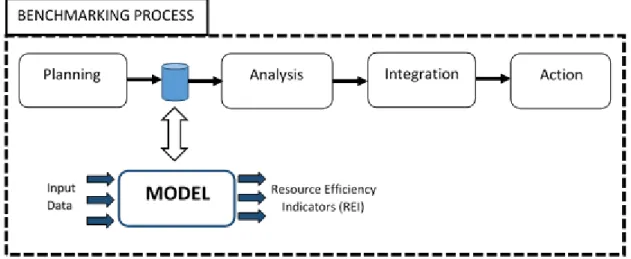
Figure 1.1 Model framework in a general benchmarking process ... 2
Figure 2.1 Relationship between resource efficiency and resources conservation... 5
Figure 2.2 Managing resources selection and flows to minimize waste and emissions from production, and consumption... 6
Figure 2.3 Link between resource efficiency and sustainability ... 7
Figure 2.4 Resource efficiency at different levels of organizational change ...10
Figure 2.5 Xerox benchmarking model ...13
Figure 2.6 Association of a sustainability measurement process with the stages of a general benchmarking process ...14
Figure 2.7 Types of performance measures ...16
Figure 2.8 Indicator categories needed to measure resource efficiency ...19
Figure 2.9 Typical continuous fuzzy set membership function shapes: (a) trapezoidal, (b) Bell or Gaussian, (c) triangular, (d) Z – shape and (e) S – shape ...22
Figure 3.1 Model development stages ...23
Figure 3.2 A) S-shaped and B) Z-shaped fuzzy-sets ...24
Figure 4.1 Boundaries definition for data collection ...30
Figure 4.2 Indicators’ results evolution graphs. ...36
Figure 4.3 E2 indicator S-shaped fuzzy-set ...40
Figure 4.4 E1 indicator Z-shaped fuzzy-set ...41
xiii
List of Tables
Table 2-1 Categories of sets of indicators for sustainable manufacturing ...20
Table 4-1 Resource efficiency indicators set ...27
Table 4-2 Materials data collection template ...31
Table 4-3 Energy data collection template ...32
Table 4-4 Water consumption data collection template ...32
Table 4-5 Solid-waste data collection template ...33
Table 4-6 Wastewater data collection template ...33
Table 4-7 Air emissions data collection template ...34
Table 4-8 Final products data collection template ...34
Table 4-9 Companies’ general information collection template ...35
Table 4-10 Companies’ indicators results calculation template ...35
Table 4-11 Indicators’ best and worst performance results presentation template ...36
Table 4-12 Parametric equation values matrix template ...37
Table 4-13 Categories and indicators weights matrix template ...37
Table 4-14 Inference process matrix template ...38
Table 4-15 Companies general information. ...38
Table 4-16 REI results of the previous and current years ...39
Table 4-17 membf parameters used for the fuzzification of the REI ...40
Table 4-18 Weight of each Category (wi) and FREI (wij) ...42
Table 4-19 Fuzzy indicators (FREI), performance Category Indicators (CI) and Performance Index (PI) of company #0021...42
Table 4-20 Fuzzy indicators (FREI), performance Category Indicators (CI) and Performance Index (PI) of company #0078...42
xv
List of Abbreviations
BAT Best Available Techniques
CI Category Indicator
EEA European Environment Agency
ERP Enterprise resource planning
EU European Union
FREI Fuzzy resource efficiency indicators
FST Fuzzy Set Theory
ID Identification number
NF Normalization factor
OECD Organization for Economic Cooperation and Development
OIA Outdoor Industry Association
PI Performance Index
RE Resource efficiency
RECP Resource Efficient and Cleaner Production
REI Resource efficiency indicators
SME Small and medium-sized enterprise
UN United Nations
UNEP United Nations Environment Programme
1
Chapter 1 - Introduction
1.1 Framework
Over the last decades, the increase in world population and a fast-growing global economy are causing an unsustainable use of natural resources. This unsustainable use combined with waste disposal and emissions associated with the burning of fossil fuels contributes to an alarming environmental degradation, which is perceived through the change in the global climate and the scarcity of natural resources.
The challenge is then to sustain these growths while reducing the impact of production and consumption patterns. Hence the need to create an awareness regarding the impact of these patterns and the importance of improving resource efficiency. This need is enhanced by the new European policies and international programmes that promote a wise and efficient resource usage, for both companies and nations reduce their vulnerability. In order to assess said vulnerabilities and develop strong strategies to guarantee resources for the future, more specific data and expertise are required (Weterings et al., 2013).
In comparison to personnel costs, materials and energy costs represent the major expenditures for manufacturing companies and therefore a critical factor for their competitiveness (Greenovate! Europe, 2012). It is also important to note that companies’
clients and customers are becoming more aware of the goods and services environmental impact and this awareness is significantly influencing their product choices, becoming a factor that should promote companies drive for change (Zero Waste Scotland, 2011). Through the optimization of resource usage, resource efficiency and process improvement the manufacturing companies aside from becoming more competitive and profitable can also reduce their environmental impacts.
1.2 Scope and objectives
2 The main objectives of this study are:
To develop a model, based on adequate data input and on the output of resource efficiency indicators (REI), for benchmarking company resource usage;
To establish, when performing the benchmarking, an approach to assess the results through the creation of a ranking system using the Fuzzy Set Theory (FST).
The model development will be focused on its future implementation in manufacturing SME’s
due to the identified lack, in comparison to larger enterprises, in terms of access to knowledge, available resources and sharing of best practices, among others.
The model will be designed to be integrated between the planning and the analysis phase of a general benchmarking process, as showed in Figure 1.1. The entire benchmarking process implementation, will not be part of this study, however the goal of this study is for the creation of the model to be the starting point in encouraging companies to collect resource usage data, to analyse and realize their current situation in terms of resources consumption and to create an awareness regarding the importance of taking and integrate resource efficiency actions.
1.3 Structure
The dissertation is divided into five chapters as follows:
Chapter 1 – Clarifies the framework, scope and objectives of the dissertation;
Chapter 2 – Covers a literature research about resource dimensions and its usage in manufacturing companies and about the resource efficiency concept, presenting the related
3
European policies and international programmes and the benefits of taking efficiency measures. This chapter also provides a theoretical background about benchmarking processes, the creation of performance indicators and the fuzzy set theory, that will support the model development;
Chapter 3 – Explains the methodology followed in this study;
Chapter 4 – Describes in detail all the stages of the model development and performs the model verification with theoretical values;
Chapter 5 – Presents the conclusions and limitations of this study and what should be addressed in future studies.
5
Chapter 2 - Theoretical background: Model framework
2.1 Resources and related efficiency measures
2.1.1
Concepts
Natural resources availability is vital for the sustained functioning of both industrialised and developing societies. According to the EU Commission’s Communication Towards a Thematic
Strategy on the Sustainable Use of Natural Resources (EU-COM 2003: 84) cited in (Nilsson et al., 2007), natural resources include:
o Raw materials - minerals (including fossil energy carriers and metal ores) and biomass;
o Environmental media - air, water and soil;
o Flow resources - wind, geothermal, tidal and solar energy;
o Physical space - required to produce or sustain all the above-mentioned resources, as eg.
land-use for human settlements or infrastructure.
When considering the life-cycle of a product, the term ‘resources’ can be associated, not only with natural resources, but with different interlinked dimensions such as raw materials, energy sources, supplies and wastes (Greenovate! Europe, 2012).
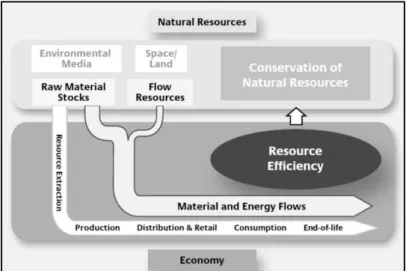
In order to guarantee the conservation of natural resources, referred as stocks, and the sustainable use of the economically utilized resources (material and energy) , referred as flows, resource efficiency measures must be implemented in all the product life cycle levels, as exposed in Figure 2.1 (BMZ, 2012).
6
The European Environment Agency has conducted a survey to determine how European countries define or interpret the terms 'resources' and 'resource efficiency'. This survey has revealed that there is a widespread uncertainty regarding the definition of 'resource efficiency' and its relationship to other concepts such as 'sustainable consumption and production' and ' green economy' (EEA, 2011).
This is also recognised in a study conducted by The German Federal Ministry for Economic Cooperation and Development, which states that the concept of resource efficiency has a strait relationship with other concepts, such as: Low-Carbon Economy, Cleaner Production, Eco-Efficiency, Resource productivity, among others (BMZ, 2012).
Resource efficiency has then become a widespread topic in the recent years which still lacks a clear definition or interpretation, it is important however to understand the concept behind it.
Resource efficiency can be described as the optimal use of materials across the product lifecycle and value chain, from raw material extraction and conversion, product design and manufacture, transportation, consumption to re-use, recovery, disposal or recycling ((ERT, 2013).
This is a perspective which considers only the materials, but there are various other aspects of resource efficiency that must also be considered, such as energy efficiency, water efficiency, land use and emissions intensity (UNEP & SETAC, 2009).
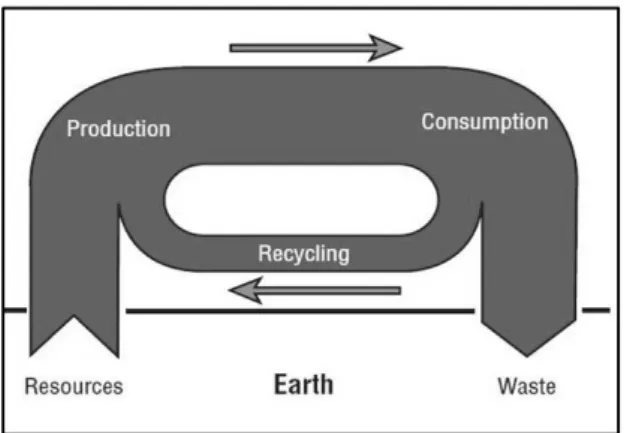
According to the United Nations Environment Programme (UNEP) resource efficiency is related to the product life cycle, exposed in Figure 2.2, as the careful selection of raw materials, energy and water sources, the responsible management of resources flows during the production and consumption, and the attention to recycling and to the minimization of waste and emissions disposal (UNEP, 2010).
7
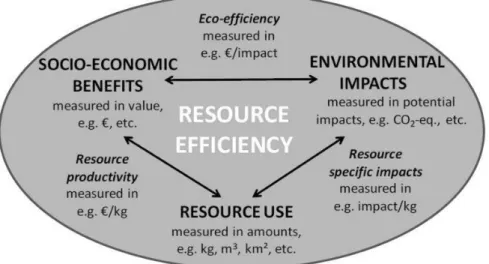
Resource efficiency can also be referred as any improvement that increases the benefits obtained per unit of resource use (productivity) or any improvement that reduces the environmental impacts per unit of resource use (AMEC & BIO, 2013).
These improvements can be achieved through the decoupling of economic growth from resource usage and environmental impacts, which means the reduction of energy, land, water and the materials needed for economic growth. For business this means changes in the design, production and marketing activities (UNEP, 2010).
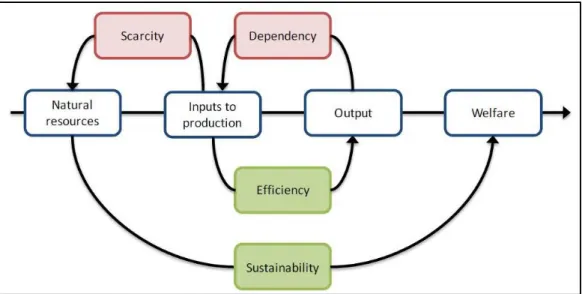
A report prepared for the European Commission approaches the link that exists between efficiency and the general concept of sustainability, as Figure 2.3 demonstrates in a simplified scheme. This report states that resource efficiency is more focused on the use of resources as inputs to production, how they contribute to the economy output and the need to limit the risks linked with the scarcity and the dependency of supply of resources. While sustainability aside from aiming to develop the economy, is also concerned with the welfare by preserving the environment and improving social issues (BIO et al., 2012).
Figure 2.3 Link between resource efficiency and sustainability (source: (BIO et al., 2012))
8
2.1.2
European policies and international programmes
Our society is facing the challenge of restructuring its industrialized economy, based on the intensive use of resources, in order to ensure a sustainable future. This challenge requires collaboration across traditional institutional boundaries, where a policy framework plays an extremely important role (Weterings et al., 2013).
Policies provide the necessary coherence, consistency and certainty, creating the conditions for companies to invest in innovation and take sustainable management practices, that should lead to a decoupling of growth from resource use (Rademaekers et al., 2011b).
The Study on the Competitiveness of the European Companies and Resource Efficiency mentions that the European Union (EU) is aware of this issue and the need to provide sustainable policy solutions for the European economy and its business sectors (Rademaekers et al., 2011a).
The European Commission has already put in place numerous initiatives related to 'Resource efficiency' in order to promote a long-term vision of economic development while reducing the levels and impact of resource use. Some of these initiatives are (European Commission 2011; EREP, 2013; Rademaekers et al., 2011a; Greenovate! Europe, 2012):
o Roadmap for a resource-efficient Europe;
o Eco-innovation Action Plan;
o Resource Efficient Europe Flagship Initiative;
o Low-carbon economy 2050 roadmap;
o European Energy Efficiency Plan 2020;
o 2020 EU biodiversity policy and strategy;
o Energy Roadmap 2050;
o Security of energy supply and international cooperation;
o Action Plan towards a sustainable bio-based economy by 2020;
o Revision of the legislation on monitoring and reporting of greenhouse gas emissions.
o Review of Sustainable Consumption and Production/ Sustainable Industrial Policy Action
Plan;
9
EU policy initiatives can be a strong driver of national policies and they should contribute to develop a common understanding of key concepts around resource efficiency, enabling the sharing of knowledge and experience and stimulating a discussion on targets for consumption and overall resource usage reduction (EEA, 2011).
In order to focus the policy measures on the industry needs to implement resource efficiency at a broad scale, there should be a good coordination and correlation between different EU policies, a better integration of development and innovation researches and the establishment of standards, regulations and Best Available Techniques (BAT) reference documents (Greenovate! Europe, 2012).
Taking into account the global dimension of resource efficiency issues and in order to achieve their objectives of sustainable development, the EU has the need to address these issues internationally, promoting a close cooperation with global partners (European Commission 2011).
This global cooperation is enhanced through several international programmes promoted by the United Nations (UN). An example, is the strategic joint programme Resource Efficient and Cleaner Production (RECP) developed by the United Nations Industrial Development Organization (UNIDO) and the United Nations Environment Programme (UNEP), that has produced a number of technical tools and trainings on sustainable consumption and production (UNEP, 2010).
This programme aims to advance production efficiency, environmental conservation and to reduce the risks to people and communities. For the promotion and implementation of RECP methods, UNIDO and UNEP have established, and currently support, National Cleaner Production Centres, which provide services to businesses, governments and other stakeholders, in over 45 countries (UNIDO & UNEP, 2010).
In June 2012 it was organized the United Nations Conference Rio+20, where world leaders, participants from governments, the private sector, NGO’s and other stakeholders have discussed strategies to push towards sustainable development, which is seen as the guiding principle for long-term global development (UNCSD, 2011).
2.1.3
Implementing resource efficiency in manufacturing small and
medium-sized enterprises
10
Implementing resource efficiency measures should then be a high priority for these companies since it contributes to gain competitive advantage and reduce their environmental impact (UNEP, 2010).
Resource efficiency measures and the promotion of sustainable manufacturing present several benefits for manufacturing companies in terms of production, financial and environmental performances such as (OECD, 2011; Madden et al., n.a.; AMEC & BIO, 2013):
Cost savings and avoidance, by reducing materials inputs, energy consumption, disposal of waste, treatment of emissions, and regulatory burdens;
Sales increment, by anticipating changes better than the competitors and by enhancing the company’s reputation;
Employees’ morale and retention rate growths, since the employees realize how their
daily work is also contributing to a better environment and to a more productive business;
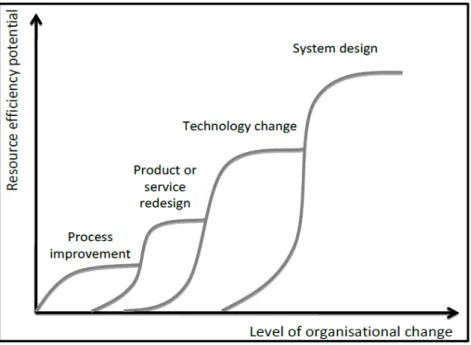
(AMEC & BIO, 2013) recommend that the best way for companies to recognize the potential of the efficiency gains is to consider resource efficiency at different levels of organizational change, starting from implementing simple process improvements to a complete restructuration of their processes, as showed in Figure 2.4.
11
The Guide to resource efficiency in manufacturing also suggests that resource efficiency in manufacturing SMEs can be improved at three interconnected levels of innovation: 1) resource efficient manufacturing and recycling processes; 2) Eco-efficient product design; 3) integrated optimisation across the various interfaces of the complex manufacturing value chains (Greenovate! Europe, 2012).
Implementing resource efficiency, aside from the mentioned benefits, has obviously, some investment costs associated. Even if the balance between costs and benefits is favourable to companies, studies have shown that some barriers against innovation towards resource efficiency exist (Rademaekers et al., 2011a).
The guide developed by Greenovate! Europe (2012) identifies the lack of awareness by SMEs decision-makers regarding the relevance of resource efficiency and the opportunities related with optimising manufacturing processes, the insufficient and unreliable data sharing availability and the knowledge gaps concerning access to technologies and innovative solutions as the main reasons why SMEs have been slow to adopt resource efficiency measures.
AMEC and BIO (2013) have also reviewed some external barriers, that are influencing companies when seeking to implement resource efficiency measures in their businesses, such as inconsistent policies, supply chain constraints, physical limitations and lack of support and assistance.
In order to tackle some of these barriers and to enhance resource efficiency, it is also necessary to promote a higher collaboration and interaction between companies, suppliers and customers in the supply chain. This means that industries should be able to find synergies to coordinate the use of resources in the most efficient way. For instance, through a symbiotic network, one company, in some of its processes, could replace costly virgin resources by resources originated from the waste flows of another company processes (Duflou et al., 2012; EREP, 2013).
Considering the impact, all the resource efficiency improvement options should be evaluated and the implementation costs, financial benefits, risks and possible synergies have to be
12
2.2 Benchmarking process
In a review of different types of benchmarking models Anand and Kodali (2008) highlighted a Camp (1989) definition of benchmarking:
“Benchmarking is the search for the best industry practices which will lead to exceptional
performance through the implementation of these practices.”
Benchmarking includes comparing the business performance against the same baseline every year, tracking patterns and analysing variations within a company – internal benchmarking - and/or comparing to other companies which perform similar operations – external benchmarking (UNEP, 2010).
This comparison can be quantitative, through numerical measures of performance (indicators), or qualitative, comparing management and operational practices (EPA, 2008). Both benchmarking approaches allow companies to realize their current situation regarding their performance strengths and weaknesses and also to assess the result of improvement actions.
An evaluation and comparison related to industry standards can also be made, which allows
organizations to develop improvements in order to achieve sector’s best practices. The use of benchmarks and standards enhances the need to identify priorities, introduce long-term targets and improve data and information access and collection (Rademaekers et al., 2011a).
The inclusion of a benchmarking process or plan, when implementing resource efficiency measures, allows performing a more structured analysis of the current situation and a better research for potential improvements (UNEP, 2010).
A study conducted by Bohs and Diehl (2009) lists some of the potential benefits for organizations when implementing a benchmarking plan:
Helping a company to understand and develop a critical attitude to its own business
processes;
Promoting an active process of learning in the company and motivating change;
Providing new sources for improvement and a creative basis for finding solutions;
Establishing reference points for measuring performance and correcting inaccurate
13
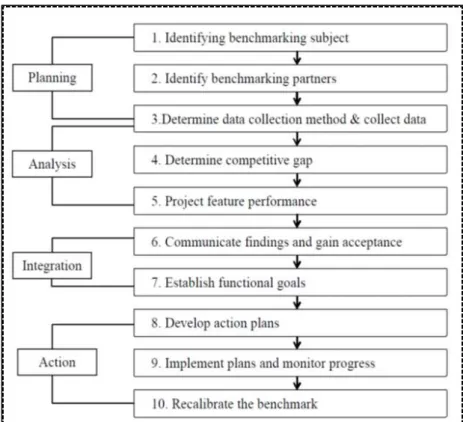
The Xerox model is general benchmarking model which clearly identifies the steps that need to be followed in order to perform a benchmarking process, as showed in Figure 2.5 ((Anand & Kodali, 2008).
This process starts with the planning phase, where one identifies the subject or area that will be the reason for implementing a benchmarking study, presenting the problem statement and the challenges that will be faced. Having that well defined, and if the intention is to perform an external benchmarking, there is the need to identify partners, a group of companies that have agreed to have their data compared with each other. How this data is collected has also to be defined and measurement procedures must be determined in order to obtain the desired outputs, which in a quantitative comparison will be a set of adequate indicators.
After the planning phase, in the analysis phase, the collected data has to be evaluated in order to determine the competitive gap and to project the feature performance. The target is to set the best performance which will be the benchmark value.
This target has to be communicated within the organizations to gain acceptance and to establish functional goals, in the integration phase. Gaining the acceptance from all levels of the organization is important to guarantee the implementation success of the actions that are developed in order to achieve the best performance.
14
An implementation plan is defined in the action phase, the progress must be monitored and the impact evaluated. Once achieved or exceeded the target, the benchmark value is recalibrated to promote a continuous process in which companies continually seek to improve their performances.
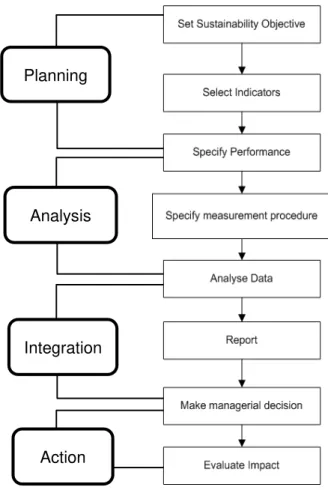
This general and widely used model provides the ideal framework for a good understanding, however its phases and steps are easily adapted according to the established objectives. For instance, a sustainability measurement process as the one presented by Joung and co-workers (2013) can easily be adapted into a benchmarking process, following a similar structure, as showed in Figure 2.6.
After having the sustainability goal defined, the right indicators selected the performance specification for each period determined, can then the continuous benchmarking process mentioned in the action phase be applied.
Planning
Analysis
Integration
Action
15
2.3 Performance indicators
To provide a solid basis for decision-making and to measure the progress of company resource efficiency there is a need to select and define specific performance indicators. This chapter provides the requirements to create or select a set of useful indicators and an overview of already in place performance indicators regarding resource efficiency.
2.3.1
Indicators: General definition and selection
An indicator is used to monitor an issue or condition and demonstrate a desired outcome. Indicators are varied and depend on the type of systems they are monitoring, with different levels of complexity.
An indicator does not mean the same as an indication or goal, an indicator is generally quantifiable, by aggregating different and multiple data. The resulting information is synthesised and is used to measure goals achievement. Indicators should be based on criteria and present some characteristics, such as (Joung et al., 2013; Hart, 2010; Shahin & Mahbod, 2007):
Specific
An indicator should be detailed and specific as possible, precisely formulated in order to measure only the desired output;
Measurable
In a clearly and concrete way the indicator defines the measurement type, allowing data collection to be consistent and comparable. It can be simply and easily measured by quantitative or qualitative means;
Understandable
An indicator should be easily interpreted and one should know exactly what the output of an indicator demonstrates, in order to act accordingly to the needs;
Relevant and realistic
An indicator must be relevant, fitting the measuring purpose and underlying the pointed issue, directly related to meaningful and purposeful aspects; and realistic considering that the needed data to calculate the indicators should be collected only through available resources, not being the collection too difficult or too expensive;
Reliable
16
Timely manner
The data collection, calculation, and evaluation must be done in a timely manner, providing a structure that allows a meaningful progress monitoring. In other words, it should be perfectly stated the desired frequency for calculating the indicator, to better track the outcome results;
Long term-oriented
It must ensure their future use, and reflect the development and adoption of organizational, process or product changes.
The EEA (2003) report also states that the main function of indicators is to communicate, promoting the information exchange according to an observed value representative of a phenomenon of study. This communication should be done in order to simplify complex realities, assuring that the indicators are easy to interpret, match the target audience interest and allow the comparison of changes over time along with an explanation of causes behind trends.
Knowing what should be the main characteristics and functions of the indicators, it is necessary to define indicator sets according to the established targets or goals. Parmenter (2007) argues that many companies are working with the wrong measures and not defining correctly their performance indicators, and defines then three types of performance measures, as presented in Figure 2.7.
Key result indicators (KRIs): indicate what have been done in a perspective, measuring the activities and reporting the results, but not considering the cause;
Performance indicators (PIs): express what needs to be done, it is a metric that informs how a business is running and what are the needed actions; A metric, which is a calculated
17
number expressed as a ratio, average or rate, should not be confused with a measure, which is only a raw number resulting from measurement procedures;
Key performance indicators (KPIs): represent a set of metrics directly related with strategic decisions, providing the crucial feedback to highly increase organizational performance.
A framework and understanding of various types of presenting indicators are not enough to develop an indicator set. Developing an indicator set is a process that involves scientific and technical knowledge about what is going to be measured and how it should be tracked (EEA, 2003).
When creating an indicator set, additional attributes should be attached to promote a better specification and comprehension (Joung et al., 2013):
Identification (ID): exclusive alphanumeric identifier;
Name: distinctive designation;
Definition: expressing the essential characteristics and function;
Measurement type: quantitative or qualitative;
Unit of measure: the unit of the value of the indicator;
References: citable documents of existing indicator sets or specific indicators;
Application level: the application level in a hierarchical organization.
Furthermore, an important step when creating any indicator set is to determine where and how to obtain the data, that will be used to calculate the indicators, and to clarify the collection requirements. Different data sources lead to different types of values and could not present the desired level of detail or reliability.
This issue can be surpassed by installing adequate metering devices and by establishing standard data collection procedures. Clear guidelines ensure that the methods used for indicator set construction, data collection and data processing are clear, transparent and replicable (UNIDO & UNEP, 2010).
To summarize, in order to select the right indicators and guarantee the implementation success is important to (OECD, 2011):
Identify what is relevant, reflecting the business priorities;
18
Set a data collection process, ensuring data is collected and managed in a robust
and meaningful way to guarantee data quality and reliability;
Report progress, by tracking and communicating the results;
Review periodically the indicator set, in order to retain its relevance and
effectiveness.
2.3.2
Resource efficiency context: Overview of existing indicators
Before selecting an indicator set, it is important to perform an overview about the existing indicators according to the study objectives. This overview allows to a have broad picture regarding what is currently being tracked and how the measuring processes are being developed and implemented in regard to resource efficiency.
Rademaekers and co-workers (2011b) understood that European companies are not measuring all the resources they use and they are only focusing in implementing specific indicators to monitor the resources they consider to be the most important in the respective sector. The study has concluded that there is a lack of a comprehensive approach to resource efficiency, which means companies do not realize the importance of monitoring all the resources they use in order to achieve a better performance. Companies then should create and implement indicators that show progress in a comparative or weighted manner or that show the benefits of increasing resource efficiency measures.
At the policy level there are already plenty of indicators established, such as life cycle indicators, to monitor the progress towards sustainable development by providing insights into decoupling environmental impacts from economic growth. These indicators monitor the consumption, production and waste management (Science Communication Unit, University of the West of England, 2013).
19
UNIDO and UNEP (2010) distinguish different types of indicators, such as:
Absolute indicators in a given time frame, as e.g. the annual amount of wastes
generated or carbon dioxide emitted;
Productivity ratios, that quantify the amount of product output per unit of resource use;
Intensity ratios, which quantify the amount of resources used or the amount of emissions
per unit of production.
The Outdoor Industry Association also presents a set of Eco-Index indicators, based on three categories - Product Indicators, Facility Systems Indicators, and Footprinting Indicators - to establish a baseline that will determine companies’ current performance and allow them to better identify improvement opportunities and to encourage companies to strive towards sustainable production (OIA, 2010).
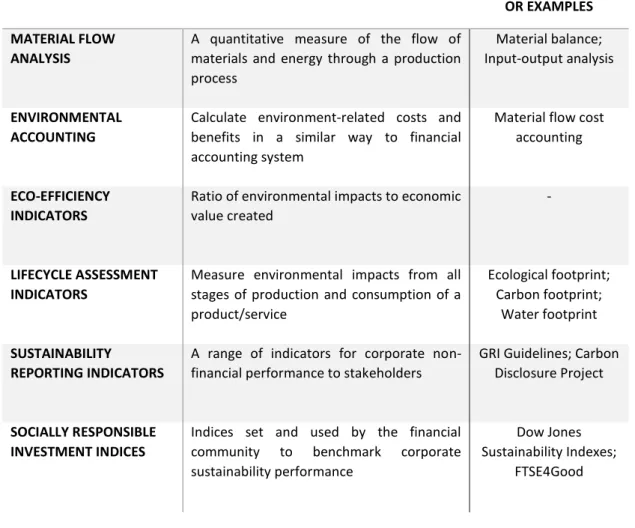
A project developed by the (OECD, 2009) (2009) reviews several categories of existing sets of indicators, presented in Table 2-1. These indicators were developed to support manufacturing companies understand existing production systems, define specific objectives and monitor progress towards resource efficiency and sustainability.
In this project a comparison is also performed between the different indicator sets regarding their potential effectiveness in advancing sustainable manufacturing upon these criteria (OECD, 2009):
o Comparability for external benchmarking;
20
o Applicability for SMEs;
o Usefulness for management decision making;
o Effectiveness for improvement at the operational level;
o Possibility of data aggregation and standardisation;
o Effectiveness for finding innovative products or solution.
Table 2-1 Categories of sets of indicators for sustainable manufacturing (source: (OECD, 2009))
CATEGORY DESCRIPTION SIMILAR INDICATORS
OR EXAMPLES
MATERIAL FLOW ANALYSIS
A quantitative measure of the flow of materials and energy through a production process
Material balance; Input-output analysis
ENVIRONMENTAL ACCOUNTING
Calculate environment-related costs and benefits in a similar way to financial accounting system
Material flow cost accounting
ECO-EFFICIENCY INDICATORS
Ratio of environmental impacts to economic value created
-
LIFECYCLE ASSESSMENT INDICATORS
Measure environmental impacts from all stages of production and consumption of a product/service Ecological footprint; Carbon footprint; Water footprint SUSTAINABILITY REPORTING INDICATORS
A range of indicators for corporate non-financial performance to stakeholders
GRI Guidelines; Carbon Disclosure Project
SOCIALLY RESPONSIBLE INVESTMENT INDICES
Indices set and used by the financial
community to benchmark corporate
sustainability performance
Dow Jones Sustainability Indexes;
FTSE4Good
21
Apart from what has already been mentioned in this section, there are many other performance measurements and indicators to monitor resource use and efficiency measures that have been developed in studies, for project purposes, as a standard or as part of legislation. Some of them have supported this study and can be found in (BMZ, 2012; Science Communication Unit, University of the West of England, 2013; UNIDO & UNEP, 2010; OIA, 2010; UNIDO & UNEP, 2010; Zero Waste Scotland, 2011; BIO et al., 2012; NIST, 2010; OECD, 2011).
2.4 Fuzzy set theory
The Fuzzy Set theory (FST), introduced by Zadeh (1965), allows to solve problems that deal with uncertainty, vagueness and imprecision.
The FST was formulated in a time where the existing modelling tools were based on the classic Boolean logic, in which either a statement is considered to be true or false. Since most of the real problems cannot be treated as deterministic, there was the need to develop a new methodology to deal with these uncertainties. A fuzzy set is a class of objects, with a continuum of membership grades, where the membership grade can be taken as an intermediate value between 0 and 1, which means that, unlike the crisp sets that correspond to binary logic [0, 1], in the FST each number between 0 and 1 indicates a partial truth. The FST allows the use of mathematical operators such as addition, subtraction, multiplication and division, among others to be applied to the fuzzy sets (Zadeh, 1965).
According to the objectives of this study, following are presented some useful definitions and notations, captured on revisions about the topic (Nunes, 2010; Ganga & Carpinetti, 2011; Lin et al., 2007):
1) A fuzzy set à in X is defined by
in which à represents the fuzzy set, X the universe of discourse, x a generic element of the universe and µ A(X) is the degree of pertinence of x in Ã.
2) Fuzzification: a process that converts numeric values of the crisp input variables into grades of membership corresponding to fuzzy sets; this process can be easily coupled with nonfuzzy forms of knowledge representation and can be manipulated by a variety of evaluation methods;
22
3) Membership function: numeric graphic function, which attribute values of pertinence to discrete values of a variable, in its universe of discourse.
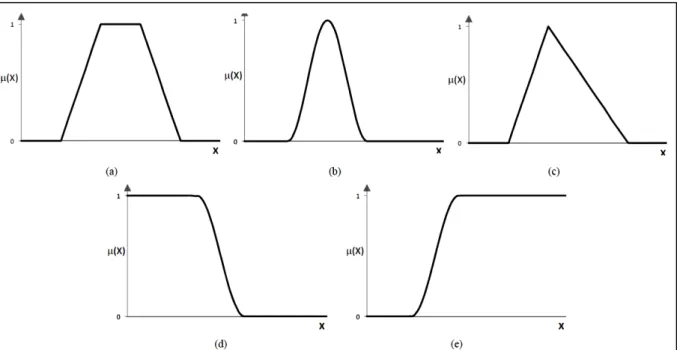
The membership function of a fuzzy set can be seen as a predicate, since µ A(X) indicates the degree to which X has the property represented by the fuzzy set Ã. The membership functions differ according to the object of study. The most typical shapes used to represent the fuzzy sets are the trapezoidal, triangular, Gaussian, Z-shape and S-shape functions, as showed in Figure 2.9.
Figure 2.9 Typical continuous fuzzy set membership function shapes: (a) trapezoidal, (b) Bell or Gaussian, (c) triangular, (d) Z – shape and (e) S – shape (source: (Nunes, 2010))
Canavese and co-workers (2014), based on several studies, suggests that the FST can function has an adequate modelling tool to determine qualitative measures, since it provides the ability to model complex realities and to use subjective information based on human knowledge and experience. In other words, it allows the formalization of the human ability to perform approximate reasoning under uncertainty conditions (Nunes, 2010).
23
Chapter 3 - Methodology
According to the objectives and the scope of this study, defined in Chapter 1, initially a literature research was done to obtain a general comprehension and understanding about resource usage in manufacturing companies and about related measures that can be carried out in order to improve resource efficiency. Interviews with manufacturing SME’s managers
were conducted to understand their perception of the importance of this topic and to obtain their feedback about the needed requirements for a future successful model implementation.
Considering that the model will be developed for benchmarking purposes it was also performed a research about how a benchmarking process should be built and then associate it with the implementation of a sustainability measurement process, by taking into account that the companies that will implement the model should also aim to achieve sustainability in their operations.
Having acquired the previous knowledge and also supported by a theoretical background on the creation of performance indicators and on the fuzzy set theory, the stages for the model development were defined, as presented in Figure 3.1.
1.
Selection and definition of a Resource Efficiency Indicator set2.
Boundaries definition, data collection and measurement procedures3.
Resource Usage BenchmarkingRanking System Fuzzy Set Theory
4.
Verification of the model with theoretical values24
The four stages of the model development will be fully described in Chapter 4 according to the following methodology:
STAGE 1 - Select and define the resource efficiency indicators (REI), which are the output metrics, that will be used to compare the performance of the different companies, among them or regarding a pre-established best value in the sector provided by, for example, an international organization - section 4.1.
STAGE 2 - Having defined the indicator set, the next step is to determine where the data should be collected in order to calculate and obtain the desired output, which means defining the boundaries. Knowing where the data should be collected, a standard procedure for data collection was created - section 4.2.
STAGE 3 - After selecting the indicator set and having available all the needed data, the final step is to calculate the indicators and to analyse the results in order to perform the benchmarking. In this stage, it was applied an approach to assess the results proceeding from the data collected in the companies, through the creation of a ranking system that uses Fuzzy set theory - section 4.3.
The ranking system was adapted from studies carried out by Nunes and co-workers (2011, 2012), which present Fuzzy decision support systems designed to support supply chains disturbance decision making processes. The application of the ranking system comprises the following steps:
1) Fuzzifying the Resource Efficiency Indicators (REI) into fuzzy indicators (FREI); Fuzzy sets allow the normalization of the indicators, i.e., fuzzy values in the interval [0, 1], where a fuzzy value close to 0 is considered to be in the bottom of the performance scale and the fuzzy value 1 states the top of the performance scale. In this study were used S-shaped and Z-shaped fuzzy sets, as illustrated in Figure 3.2.
A B
25
The fuzzification is done using a parametrically defined membership function membf, which converts the indicators values (x) in a membership degree µ(x), according to the following expression:
where:
minr – rise minimum: abscissa value where a section of a membership function curve stops being 0, starting to rise up to 1;
maxr – rise maximum: abscissa value where a rising section of a membership function curve reaches the value 1;
maxf – fall maximum: abscissa value where a section of a membership function curve stops being 1, starting to fall dawn to 0;
minf – fall minimum: abscissa value where a falling section of a membership function curve reaches the value 0;
linear – parameter that indicates if the membership function is of a linear (1) or quadratic (0) type.
2) Computing of a fuzzy performance Category Indicator (CI) for each indicator category using the weighted aggregation of FREI, through the expression:
where:
CIi – is the fuzzy performance Category Indicatorfor ith category of FREI;
FREIij – is the jth Fuzzy Resource Efficiency Indicatorof the ith category of REI;
wij – is the weight of jth Fuzzy Resource Efficiency Indicator of the ith category of REI;
3) Computing of a fuzzy Performance Indicator (PI) for each company using a weighted aggregation of CI, using the following expression:
where:
PI– is the Performance Index;
CIi – is the fuzzy performance Category Indicator for ith category of FREI;
wi – is the weight of the ith category of REI.
( )
x
membf x
( , min , max , max , min ,
r
r
f
f linear
)
1
n
i ij ij
j
CI
w
FREI
1
n
i i
i
PI
w
CI
(3.1)
(3.2)
26
4) The companies are ranked based on their PI, where the company with the highest value is considered the best performer concerning resource usage and efficiency measures;
27
Chapter 4 - Model Development
Throughout this chapter the stages for the model development will be described in detail, following the previously presented methodology.
4.1 Select and define an indicator set
Based on the theoretical background about the needed requirements to create useful performance indicators and according to the overview of already existing indicators on this topic, presented in Chapter 2, a resource efficiency indicator set was defined. The indicator set aim to provide in a simplified manner several resource dimensions and comprises six different categories and ten indicators, as shown in Table 4-1. These categories and indicators were selected regarding their relevance for a company to better understand the use of its resources and to access, through the result’s analysis, its efficiency, sustainability and environmental impact.
Table 4-1 Resource efficiency indicators set
Category RE Indicators
ID Name Expression Unit
Materials
M1 Materials Intensity Total weight of materials inputs /
Normalisation factor kg /NF
M2 Purchased recycled
materials input
(Weight of recycled materials input / Total
weight of all material inputs) *100 %
Energy
E1 Energy Intensity Total energy consumed in main production
processes / Normalisation factor kWh/NF
E2 Renewable energy use (Renewable energy consumed / Total
energy consumed) *100 %
Water W1 Water Intensity
Total volume of water consumed in main
production processes / Normalisation
factor
m3/NF
Wastewater
X1 Wastewater Intensity Total volume of wastewater generation /
Normalisation factor m3/NF
X2 Water reused on-site Total volume of reused water on-site /
Total volume of wastewater generation %
Solid Waste
Z1 Solid waste Intensity Total solid waste generated /
Normalisation factor kg/NF
Z2 Solid waste
reused/recycled on-site
(Weight of recycled and reused solid waste
/ Total solid waste generated) *100 %
Air-Emissions A1 Air Emissions Intensity Emissions released in kg of CO2 eq. /
Normalisation factor
28
In the denominator of some expressions a “normalization factor” is used. This factor allows to present the indicators in relative terms as a consumption or generation rate per specific unit of output (NF). This is extremely important, since the indicators will be compared between several companies with different dimensions in regard to production amounts or volume sales.
An example of this application can be found in OECD (2011, pp. 21–24) toolkit for sustainable manufacturing, which also suggests some factors that may be used to normalize the performance:
o Number, weight or volume of final products; o Sales volume;
o Person-hours worked;
According to the defined target for the model implementation and how complex is data access and availability, the indicators can consider all or only specific types of each resource. Following, are some further descriptions about the indicators, grouped by categories:
Materials - concerning the total amount of all materials inputs or by type (e.g. raw materials, packaging material);
Materials Intensity (M1): Rate of material consumption per unit of output (NF); A lower intensity represents a better performance;
Purchased recycled materials input (M2): Ratio of purchased recycled materials among all materials inputs; A higher percentage denotes a better performance.
Energy - concerning the total of all energy sources or by type (e.g. fuel, electricity, heating);
Energy Intensity (E1): Rate of energy consumption in main production processes per unit of output (NF) - a lower intensity represents a better performance;
Renewable energy use (E2): Ratio of total annual consumption of energy (electricity and heat) produced by the organization from renewable energy sources - a higher percentage denotes a better performance.
Water - concerning the total of all water sources or by type (e.g. municipal water, harvested rainwater);
29
Wastewater - concerning the total of all wastewater generated or by type;
Wastewater Intensity (X1): Rate of wastewater generation per unit of output (NF) - a lower intensity represents a better performance;
Water reused on-site (X2): Ratio of water reused on-site (treated and not-treated) - a higher percentage denotes a better performance.
Solid Waste – concerning the total amount of solid waste generated or by type (e.g. paper, plastic, metal);
Solid waste Intensity (Z1): Rate of solid waste generation per unit of output (NF) - a lower intensity represents a better performance;
Solid waste reused/recycled site (Z2): Ratio of recycled or reused solid waste on-site - a higher percentage denotes a better performance.
Air-Emissions - direct and indirect greenhouse gas (GHG) emissions.
Air Emissions Intensity (A1): Ratio of emissions released, in kg of CO2 eq., per unit of
output (NF) - a lower intensity represents a better performance;
4.2 Boundaries definition, data collection and measurement
procedures
The first step before starting with data collection is to define the boundaries, in order to delimit where the data should be collected.
The data that will be used for benchmarking purposes can be collected in any of the following levels illustrated in Figure 4.1, considering either all the supply chain entities or only the manufacturing company. It is also possible to assess and compare inside the company the different units/departments or, in a more detailed level, individual processes or products. However, for this study it was decided to focus on the company site and then perform the benchmarking among different manufacturing companies (same level in different supply-chains).
As it is also possible to visualise in Figure 4.1 the model’s input data will be collected from
30
This data should be collected on a regular basis and, as a study conducted by (Nilsson et al., 2007) suggests, the reliability of the collection method must be ensured. Thus, it is extremely important, when applying benchmarking approaches, to guarantee that the several companies, that make part of the benchmarking programme, use the same type of measurement equipment and follow the same collection standards.
This data may be collected from different possible sources, as for example:
o Invoices from suppliers o Weighbridge data o Sales Figures o Inventory o Calculations o Estimates
o Incoming goods records o Receipts/bills
The collection can be eased when using production data acquisition systems and/or when the information is recorded in management software’s (e.g. ERP – enterprise resource planning systems). Any of these systems or software’s are part this study and therefore, in a more conceptual way, some templates, developed using the software Microsoft Excel®, will be presented as a starting point for data collection. Studies conducted by OECD (2011) and UNIDO and UNEP (2010) supported the creation of these matrixes.
31
To gather data about materials inputs a template, Table 4-2, was created. It is important to distinguish the material's types and then to list all of them - as operating supplies, are considered to be the associated process materials (materials that are needed for production but are not part of the final product) and the semi-finished products. To perform a more accurate analysis the purpose of each material (in which processes or in which products they will be consumed) could also be listed.
For each material the purchased quantity, with its respective unit, is recorded. The conversion factor allows comparing the data, gathered from different sources, in the same unit. In this study, as e.g., if one material is recorded in tons (t), for calculation purposes it should be converted into kilogrammes (kg).
Whenever a purchased material comes from recycled sources, or even only part of its content, the recycled content data should be collected.
Table 4-2 Materials data collection template
Regarding energy, Table 4-3, the data is also compiled by different categories and sources, for e.g. if the energy is purchased from suppliers or generated on-site, and within each category the source of the energy (electricity, gas, etc.). The recording of consumption quantities and their conversion follows the same principle as the one used for materials, being the kilowatt-hour (kWh), the unit used for calculations.
It was decided to make the assessment only considering the main production processes, so it is necessary to evaluate the amount of the total energy that is consumed for this purpose and the one that is not consumed by equipment directly used to add value to the final product (e.g. illumination, office equipment, etc.).
Inputs of Materials Processes / Products
(Output) Quantity Unit Conversion Factor kg
% Recycled content*(2)
Raw materials
X
Y
Operating supplies*(1)
Packaging
32
Table 4-3 Energy data collection template
The matrix created to collect data concerning water consumption, Table 4-4, is similar to the one used for energy, and in this case the volume of the consumed amount should be converted to cubic meters (m3).
Table 4-4 Water consumption data collection template
Table 4-6 and Table 4-5 present the needed data to calculate the indicators regarding the wastes generated by the manufacturing processes. The type of solid waste should be defined as well as the amount that is being reused or recycled on-site/outside the company
Energy Sources Quantity Unit Conversion Factor kWh
Purchased from suppliers
Electricity
Gas
Power generated On-site
Renewable sources
Fuel oil / Coal / Gas
Total Energy consumption
Type of consumption kWh %
Main production processes
Auxiliary/Overheads*
Water Sources Quantity Unit Conversion Factor m³
Municipal water supplies or other utilities
Harvested rainwater
From utility (water from company own wells)
Surface water (wetlands, rivers, lakes, oceans)
Total water consumption
Type of consumption m3 %
Main production processes
33 .
In relation to wastewater, besides the type - where “other applications” is the water used, as
for example, cooling, sanitary or cleaning - should be also considered if the water is being collected and reused for lower grade uses, where the water quality does not have to be so high (non-treated), or if it is being reused but needs previous treatment.
The most demanding collection is measuring data of air emissions, Table 4-7 . This can be done through direct measurements with specific equipment or through calculated estimations.
In this study, the assessment was grounded on a research that sets out broad general principles for measuring and reporting greenhouse gas emissions, developed by (Defra, 2009). This publication presents a calculation method for estimating the amount of released air emissions, based on the amount of consumed energy. The mass of CO2 equivalent, in
Type of wastewater Quantity Unit Conversion Factor m³ From processes
From other applications*(1) Unplanned discharges
Total
Water reused on-site m3 %
Not-treated*(2) Treated*(3) Wastewater
Table 4-6 Wastewater data collection template Type of solid waste Quantity Unit Conversion Factor kg Paper
Plastic Glass Metal
Municipal waste Hazardous waste
Total
Waste recycled and reused kg %
On-site
Outside Solid waste
34
kilograms (kg), is the result of multiplying the consumed energy quantity by a pre-defined emission factor.
Depending on the type of industry and whether possible, through specific equipment, the emissions resulting from physical or chemical processing should also be recorded. Once again, it is important to know if the company follows air treatment procedures and then evaluate the percentage that is being treated regarding the total emissions.
Table 4-7 Air emissions data collection template
To define the normalisation factor expressed in section 4.1, it is necessary to collect all the available data regarding to the final products, as showed in Table 4-8.
Table 4-8 Final products data collection template
4.3 Resource usage benchmarking
–
Ranking System
A database to register general information about the companies that are interested to be part of the benchmarking programme has to be created, exemplified in Table 4-9, where each
Type of Air emissions Quantity Unit Emission Factor (g/kWh) CO2 eq. (kg)
From energy consumption
Electricity
Combustion processes
From other sources
Physical or chemical processing Venting
Total
Treatment of air emissions %
Article No. Article Group Name Weight (kg) Volume (m3) Nº of units (Finished goods)
Total
35
company will have associated an identification number (ID). This information is useful, since it allows sorting and creating groups of organizations that conduct similar operations and therefore performing a more accurate comparison.
Table 4-9 Companies’ general information collection template
Linked to the companies’ IDs, a table was created, Table 4-10 , to calculate and to present the
indicators’ results of each company according to the defined indicator set and using the collected data, as explained in section 4.2. This table aside from the results from the current year (n) allows visualizing the results from the previous year (n-1), thus providing also the ability to perform the already mentioned internal benchmarking.
Table 4-10 Companies’ indicators results calculation template
As it is possible to visualize the table has also two columns allocated for the ranking position of the company in each category and regarding its overall performance, which will be further explained in this section.
Having available all the results from all the companies other table was created, Table 4-11, which presents for each indicator the best and the worst value, as well as the best performer among all the benchmarking partners. The best value of the current year might be the
ID Organization Name Location Contact Industrial Field Nº employees Sales Volume (€)
Company ID RE Indicators Unit Previous year (n-1) result
Current year (n) result
M1 kg /NF M2 %
E1 kWh/NF E2 % W1 m3/NF
X1 m3/NF X2 % Z1 kg/NF Z2 %
A1 CO2 eq. (kg) /NF
36
benchmark - performance that all the companies should aim to achieve or to surpass - for the next year.
Table 4-11 Indicators’ best and worst performance results presentation template
In order to ease the visualization and analysis of the results, graphs are developed, like the ones in Figure 4.2. Each graph is perfectly identified with the indicator’s name and with a
different colour tone. They allow to evaluate the evolution of the company in each category and to see the gap in comparison to the best result (benchmark value) from the previous (n-1) and the current (n) year among all the companies involved.
Ranking system
After collecting the data and calculating the resource efficiency indicators for all the companies, it is already possible to perform the benchmarking and to identify the best performer for each indicator, however, for this study it was decide to create a ranking system, following the methodology previously exposed in Chapter 3.
RE Indicators Worst value (n-1) Best Value (n-1) Worst value (n) Best Value (n) Company ID
M1 M2 E1 E2 W1 X1 X2 Z1 Z2
A1
37
At first, the values used in the parametric equation that allows to build the fuzzy sets for
“fuzzifying” the indicators, have to be defined and recorded, Table 4-12. The definition of the parameters minr, maxr, maxf, and minf for specific fuzzy sets is customized for each resource efficiency indicator and should be defined by a group of experts or based on established best available practices.
There is also the possibility to define these parameters considering the analysis of historical data and taking into account realistic achievable performances. These values have to be adjusted before each benchmarking assessment according to defined targets and to the evolution of the best practices.
Table 4-12 Parametric equation values matrix template
The weights of each indicator and of each category also have to be defined and recorded, in order to calculate the Category Index (CI) and the Performance Index (PI), as presented in
Table 4-13. The definition of the weights given to the different indicators and categories should also be defined by a group of experts, that based on their experience and business priorities decide on how each indicator and category influence companies’ overall performance.
Table 4-13 Categories and indicators weights matrix template
Category Water Air-Emissions
REI M1 (kg /NF) M2 (%) E1 (kWh/NF) E2 (%) W1 (m3/NF) X1 (m3/NF) X2 (%) Z1 (kg/NF) Z2 (%) A1 [CO2 eq. (kg) /NF] minr maxr maxf minf Solid Waste Materials Energy Wastewater