A QUANTITATIVE APPROACH ON LABOUR FORCE IN ROMANIA
IN 2003 -2011
ZAHARIA MARIAN,
Ph.D., Professor, Petroleum-Gas University of Ploiesti, Romania, [email protected]
BĂLĂCESCU ANIELA,
Lecturer Ph.D., „Constantin Brancusi” University of Targu Jiu,
Faculty of Economics and
Business Administration, Romania, [email protected]
ABSTRACT: In this article we present a quantitative approach to employment in Romania. In 2003 - 2011, the three main indicators of labour: Total Labour Force Resource (TLFR) Civilian Employment (CE) and Civil Economically Active Population (CEAP) had an oscillating evolution, but not necessarily simultaneous evolution.
To better highlight how these indicators have evolved in the period under review we determined their dynamic indices and we have seen that the largest variations are recorded the Indices of Civilian Employment (ICE). The increases and decreases of ICE describe the characteristics of the Romanian economy evolution in period under review In the second part of the article we are surprised the significant structural changes in the civilian employed population who have reduced activity of branches and the emergence and growth of others.
Keywords: labour market, labour force resource, civil employment, correlation, ANOVA
Cod JEL: C10, C20, C22. Cod REL: 10A 10C,12L
The evolution of Labour Force Resource, Civil Employment and Civil Economically
Active Population
In this chapter we stop briefly on three main indicators of labour: Total Labour Force Resource (TLFR) Civilian Employment (CE), and Civil Economically Active Population (CEAP).
The Labour Resource is "a category of persons who have all the physical and intellectual capabilities that allow it to perform useful work in one of the national economic activities" (Labour Force Balance at January 1, 2011, p.7) and includes working age population able to work (men aged 16-64 years; women aged 16-59 years) and persons younger and older than working age in operation.
The below figure illustrates the evolution of the labour force in the period 2003-2011 in Romania by gender.
Figure 1 Labour resources by gender in Romania in 2003-2011
As can be seen from Figure. 1 labour resources distributed by gender indicates that males are dominant in the throughout period.
6857.7
6951.6
7098.8
7142.3
7115.4 7103.3
7151.4
7222.7 7233
6686.3 6750.3
6718.1
6659.3 6657.3 6644.1
6724.5
6824.9 6814.7
6300 6400 6500 6600 6700 6800 6900 7000 7100 7200 7300
2003 2004 2005 2006 2007 2008 2009 2010 2011
Male
Civil Employment includes “all persons who, during the reference year, carried out a socio-economic lucrative activity, excepting military staff and similar (Ministry of National Defence, Ministry of Administration and Interior,
Romanian Intelligence Service staff), political and community organizations employees and the convicts”. (Statistical
Yearbook of Romania 2011, p84).
Civil Economically Active Population includes Civil Employment and Registered Unemployed (RU). The sum of CEAP and PTOCWP is TLRF.
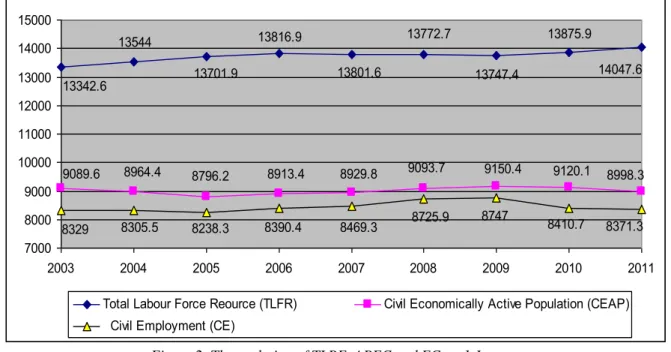
Between January 1, 2003, and January 1, 2011, development of indicators TLRF, CEAP and CE is illustrated in Figure 1.
As you can see the three indicators have an oscillatory evolution, but not necessarily simultaneously. Thus, if after a maximum of 13,816,900 persons registered on 1 January 2006, TLRF passes through a minimum of 13,747,400 on January 1, 2009 after which an upward trend, registering on 1 January 2011 the maximum period, i.e. 14 047, 6 000 people, CEAP and EC end the analyzed period in a downtrend. On January 1, 2011 CEAP include 8,998,300 persons (1.66% less than the peak reached in January 1, 2009 to 9,150,400 people) and the number of 8,371,300 people, with 24.4% less than the peak reached in January 1, 2009 to 8747.0 thousand people, decreasing categorically due of the economic crisis broke.
Analyzing the evolution of indicators presented in Figure 1, at first sight, we make the assumption that they
are linear. But the assumption is verified only for TLRF, for which the coefficient of determination
R
2
0
.
7729
; themodel, in this case, being:
13417
375
.
64
t
TLRF
(1)According to (1), in the analyzed period, TLRF had an upward trend with an annual increase of approximately 64375 persons.
Figure 2. The evolution of TLRF, APEC and EC on 1 January
For CEAP and EC indicators the values
R
CEAP2
0
.
1504
and respectively0
.
22
2
CER
invalidate theassumption of linearity. For these indicators may be accepted with reservations, polynomial models of degree 3:
912
.
0
4
.
8902
3
.
492
86
.
110
2352
.
7
3
2
2
t
t
t
cu
R
CEAP
(2)787
.
0
4
.
8602
69
.
363
86
.
110
2296
.
8
3
2
2
t
t
t
cu
R
CE
(3)Given the value of the coefficient of determination 0.787 and the small volume of data for a polynomial model of degree 3, the model (3) must be considered with major reserve.
14047.6 13875.9
13747.4 13772.7
13801.6 13816.9
13701.9 13544
13342.6
8998.3 9120.1
9150.4 9093.7
8929.8 8913.4
8796.2 8964.4
9089.6
8371.3 8410.7
8747 8725.9
8469.3 8390.4
8238.3 8305.5
8329 7000 8000 9000 10000 11000 12000 13000 14000 15000
2003 2004 2005 2006 2007 2008 2009 2010 2011
Total Labour Force Reource (TLFR) Civil Economically Active Population (CEAP)
Figure 3. Dynamic indices of TLRF, CEAP and EC indicators (previous year = 100)
To better highlight how indicators examined above have evolved during this period, we determined their dynamic indices; indices illustrated in Figure 2. As can be observed, annual changes recorded of the values of EC and CEAP are significant. The biggest changes are recorded to the Indices of Civilian Employment (ICE). Its increases and decreases describe the characteristics of the evolution of the Romanian economy in the period under review.
The ICE values, registered over the period 1 January 2005 1 January 2008,are in a continuous increase, correspond to the previous period of the economic crisis broke. Since 2008 ICE decreases two consecutive years, leading to slow growth in 2008 and to a strong decline in 2009, so that, on 1 January 2010 indicator value representing 96.2% compared to its value on January 1, 2009. Even if on January 1, 2011 the value of ICE (99.5%), is higher than the minimum recorded at January 1, 2010, because it is less than 100%, the decline continues, although with a slower pace.
The Indices of Civil Economically Active Population (ICEAP) has a similar pattern, but with a smaller amplitude. Note that on 1 January 2011 value of ICE is greater than the value of ICEAP, which is a positive fact.
The Indices of Total Labour Force Resource (ITLFR) register, from 1 January 2004, to 1 January 2011, relatively small fluctuations around the value of 100%, between a maximum of 101.5% on 1 January 2004 and a low of 99.8% on January 1, 2008. This confirms the assumption of linearity and model (1) validated above.
Evolutions and structural changes of Civil Employment
Economic evolutions that took place in Romania since 1990 have been characterized by strong and significant structural changes, which have reduced economic activity of some sectors, and the emergence and growth of others. If overall, both agriculture and industry have experienced significant decline, the services both the business as well as for population, have experienced significant growth and diversification.
The evolution of Civil Employment (CE) by activity of national economy is presented in figure 3.
Figure 4 The evolution of Civil Employment (CE), by activity of national economy 95.0
96.0 97.0 98.0 99.0 100.0 101.0 102.0 103.0 104.0
2004 2005 2006 2007 2008 2009 2010 2011
TLFR Indices CEAP Indices CE Indices (previous year=100)
0 500 1000 1500 2000 2500 3000 3500 4000 4500
1990 1991 1992 1993 1994 1995 1996 1997 1998 1999 2000 2001 2002 2003 2004 2005 2006 2007 2008 2009 2010
Agriculture, forestry and fishing Industry
Construction
Trade
Hotels and restaurants
Education
The significant decrease, in the period 1990 2010, was registered by Industry which, since 1993, has been surpassed by Agriculture, forestry and fishing. Employed population in Industry fell from 4.005 million persons in 1990 (34.96% of EC), to 2.052 million people in 2004 (24.90% of EC) and to 1.733 million people in 2010 (20.70% of EC).
The Civilian Employment in Agriculture, forestry and fishing has been a fluctuating evolution around a downward trend, without a significant change in its share of CE. Thus, from 3.144 million persons in 1990 (29.0% of EC) it drops to 2.638 million persons in 2004 (32.02% of EC) and to 2.398 million persons in 2010 (28.64% of EC). As already noted, the most significant increase, in this period, was registered by the Civil Employment in Trade, from 538,000 persons in 1990 (4.96% of EC), to 938,000 persons in 2004 (11.38% of EC) respectively, to 1.04 million persons in 2010 (12.42% of EC).
To highlight the structural changes of Civilian Employment, by activity of national economy and a deeper analysis, we present structures Civilian Employment, by activity of national economy in 2004 and in 2010. These are shown in Figures 4 and 5.
Figure 5.The structure of Civil Employment, by activity of national economy in 2004
As can be seen in Figure 4, the largest share has Agriculture, forestry and fishing (32% of CE), followed by Industry (25% of CE) and Trade (11% of CE). Education, Construction and Transport, storage and communications have each 5% of CE. Health and social assistance has 4% of CE, Public administration and defence has 2% of CE and Financial intermediations 1% of CE. That means that in 2004 the Trade and Services have 38% of CE.
Figure 6.The structure of Civil Employment, by activity of national economy in 2005
In 2010 the Trade and Services have 44% of EC by 6 percentage points more than in 2004. Also, a growth is recorded by Construction, from 5% of the EC, in 2004, to 7% of the EC in 2010. The share of Agriculture, forestry and fishing in EC decreased from 32% in 2004 to 28% in 2010, while the share of Industry in CE decreased from 25% in 2004 to 21% in 2010.
Agriculture, forestry and fishing
32%
Trade 11%
Construction 5% Financial
intermediations 1%
Transport, storage and communications
5%
Hotels and restaurants
2%
Other activities of the national economy
3% Education
5% Public administration
and defense 2%
Health and social assistance
4%
Industry 25%
Hotels and restaurants 2%
Education 5%
Information and communication
2%
Financial intermediation and
insurance 2% Professional, scientific and technical activities
2%
Other service activities 2%
Health and social assistance
5%
Shows, culture and recreation activities
1% Public administration
and defence; social insurance of public
sector 2% Activities of
administrative services and of support services
2%
T ransport and storage 5%
Wholesale and retail; repair of motor vehicles
and motorcycles 14%
Construction 7%
Agriculture, forestry and fishing
28%
Some aspects of the correlation between Working Age Population Unoccupied,
Registered Unemployed and Population in Training and Other Categories of Working
Age Population
In this chapter we test the existence of any correlation between the Working Age Population Unoccupied (WAPU), Registered Unemployed (RU) and Population in Training and Other Categories of Working Age Population (PTOCWAP).
The Population in Training and Other Categories of Working Age Population (TOCWAP) "includes students and full time college students by working age, housewives, the persons exempt from civil employment and other categories of people unemployed" (Labour Force Balance on 1 January 2011, p.8). Working Age Population Unoccupied (WAPU) is the sum of RU and PTOCWP.
Based on data series recorded values WAPU, RU and PTOCWP between 1 January 2003 and 1 January 2011, in a first phase, were determined the correlation coefficients of these; the results are presented in Table 1.
Table 1 Correlations of initial series Table 2 Correlations of modified series
RU PTOCWAP WAPU RU PTOCWAP WAPU
RU 1 RU 1
PTOCWAP -0.2904 1 PTOCWAP -0.33315 1
WAPU -0.2256 0.45731 1 WAPU 0.200293 0.857038 1
Values of correlation coefficients between RU and PTOCWAP (-0.2904), respectively WAPU (-0.2256) means an insignificant correlation between them. On the other hand, the value of 0.45731 indicates a possible correlation between WAPU and PTOCWAP. To check the existence or lack thereof, it was plotted, in Figure 7, "the point cloud" generated by WAPU and PTOCWAP combinations for each year of the analyzed period.
Figure 7 Initial series Figure 8. Corrected series
As you can see there is a point that is significantly away from the others. This corresponds to the values recorded at January 1, 2010. Given that at the respectively time we were in full economic crisis and the fact that it is a singular point, it was excluded from data series. The values of correlation coefficients for the modified series are presented in Table 2.
In case of the correct series, correlation between PTACWAP and WAPU seems obvious. To certify this assumption we use ARIMA and Fisher test.
The results are presented in Table 3. Value
R
0
.
857
indicates a strong enough correlation between WAPUand PTOCWAP and also indicates that 73.4% of WAPU evolution is given by PTOCEAP, the rest 26.6% being caused by other factors. Dependence between the two indicators is one linear form:
0
.
824792
PTOCWAP
1373
.
597
WAPU
(4)Given that for implicit significance level
0
.
05
we haveF
16
.
6
F
0.05;1;5
6
.
61
, the model (4) is valid (same conclusion emerges from the fact that the Significance F=0.00654 <0.05).Table 3 Testing dependence of WAPU and PTOCWAP
SUMMARY OUTPUT ANOVA
df SS MS F Significance F
Regression Statistics Regression 1 308488.4 308488.4 16.6 0.00654
Multiple R 0.857 Residual 6 111500.9 18583.5
R Square 0.734 Total 7 419989.4
3000 3500 4000 4500 5000 5500 6000
4000 4500 5000 5500 6000 WAPU
P
T
A
C
W
A
P
R2 = 0.7345
3000 3500 4000 4500 5000 5500 6000
4000 4500 5000 5500 6000
WAPU
P
T
A
C
W
A
Coefficients Std. Error t Stat P-value
Lower 95%
Upper 95%
Intercept 1373.597 958.7086278 1.43275 0.20190 -972.278 3719.472
PTOCWAP 0.824792 0.202436407 4.07432 0.00654 0.329 1.320
In terms of model coefficients (3), we emphasize that the coefficient of PTOCWAP is statistically significant
and can take values in the range of
0
.
329
,
1
.
320
, signifying that a change with 1000 persons PTOCWAP, the value ofWAPU changes in the same direction, with approximately 825 people.
Conclusions
Analysis of the three main indicators of labour: Total Labour Force Resource (TLFR) Civilian Employment (CE) and Civil Economically Active Population (CEAP) highlight the fact that the three indicators have a fluctuant evolution, but not necessarily simultaneous evolution. Thus, if TLRF has recorded on 1 January 2006, a maximum of 13816.9 thousand persons, as of January 1 2009 he recorded a minimum of 13747.4 thousand persons after an ascending evolution, recording on 1 January 2011 maximum analysis period, respectively 14047,6 thousand persons, CEAP and CE conclude the analysis period by a downtrend. At January 1, 2011 CEAP count 8998.3 thousand people (with 66% less than peak reached on 1 January 2009 by 9150.4), and CE counted 8371.3 thousand persons, with 4.24 percent less than the maximum reached at 1 January 2009 of 8747.0 thousand persons, decreasing due to actual economic crisis.
Dynamic analysis of the three indicators shows us that the biggest variations record the Indices of Civilian Employment (ICE). The Indices of Civil Economically Active Population (ICEAP) has a similar evolution, but with a lower amplitude. Note that from 1 January 2011 ICE value is greater than value ICEAP, which is a positive fact. The Indices of Total Labour Force Resource (ITLFR) register, during the period 2004-2011, relatively small fluctuations around 100%, i.e. between a maximum of 101.5% from 1 January 2004 and a minimum of 99.8% from 1 January 2008. This development confirms the hypothesis of linearity and model (1).
In terms of civil population structure on activities of the national economy it can be seen that during the period 2004-2010, the largest share of the Agriculture, forestry and fishing (32% of CE), followed by Industry (25% of CE) and Trade (11% of CE), Education, Construction and Transport, storage and communications have each 5% of CE. Health and social assistance has 4% of CE, Public administration and defence has 2% of CE and Financial intermediations 1% of CE. In 2010 the Trade and Services have 44% of CE with 6 percentage points more than in 2004. Share of CE in Agriculture, forestry and fishing decreases from 32% in 2004 to 28% in 2010, and share of CE in Industry decreases from 25% in 2004 to 21% in 2010.
At the end of the paper we tested the existence of possible correlations between Working Age Population Unoccupied (WAPU), Registered Unemployed (RU) and Population in Training and Other Categories of Working Age
Population (PTOCWAP). The obtained results (
R
0
.
857
) show the existence of a fairly strong correlations betweenWAPU and PTOCWAP, and
R
2
0
.
734
indicates that 73.4% of the evolution of WAPU is given by PTOCEAP, therest of the 26.6% being determined by other factors.
BIBLIOGRAPHY
1. A. Kavkler, D. E., Danacica, A., G., Babucea, I., Bicanic, B., Bohm, D. Tevdovski, K. Tosevska, D.,
Borsic,Cox regression models for unemployment duration in Romania, Austria, Slovenia, Croatia and
Macedonia, Romanian Journal of Economic Forecasting, 2009
2. Oprea C., Zaharia M., Elemente de analiza datelor şi modelare utilizând Excel, Editura Universitară,
Bucureşti, 2011
3. Labour Force Balance at January 1, 2011, p.7
4. Romania in figures