Climate Impacts on Extreme Energy
Consumption of Different Types of Buildings
Mingcai Li1¤*, Jun Shi1¤, Jun Guo1¤, Jingfu Cao1¤, Jide Niu2, Mingming Xiong1¤
1Tianjin Climate Center, Tianjin, 300074, China,2School of Environmental Science and Engineering, Tianjin University, Tianjin, 300072, China
¤ Current address: Tianjin Climate Center, No. 100 Qixiangtai Road, Hexi District, Tianjin, 300074, P.R. China
Abstract
Exploring changes of building energy consumption and its relationships with climate can provide basis for energy-saving and carbon emission reduction. Heating and cooling energy consumption of different types of buildings during 1981-2010 in Tianjin city, was simulated by using TRNSYS software. Daily or hourly extreme energy consumption was determined by percentile methods, and the climate impact on extreme energy consumption was ana-lyzed. The results showed that days of extreme heating consumption showed apparent de-crease during the recent 30 years for residential and large venue buildings, whereas days of extreme cooling consumption increased in large venue building. No significant variations were found for the days of extreme energy consumption for commercial building, although a decreasing trend in extreme heating energy consumption. Daily extreme energy consump-tion for large venue building had no relaconsump-tionship with climate parameters, whereas extreme energy consumption for commercial and residential buildings was related to various climate parameters. Further multiple regression analysis suggested heating energy consumption for commercial building was affected by maximum temperature, dry bulb temperature, solar radiation and minimum temperature, which together can explain 71.5 % of the variation of the daily extreme heating energy consumption. The daily extreme cooling energy consump-tion for commercial building was only related to the wet bulb temperature (R2= 0.382). The daily extreme heating energy consumption for residential building was affected by 4 climate parameters, but the dry bulb temperature had the main impact. The impacts of climate on hourly extreme heating energy consumption has a 1-3 hour delay in all three types of build-ings, but no delay was found in the impacts of climate on hourly extreme cooling energy consumption for the selected buildings.
Introduction
Global surface temperature increased 0.4 ~ 0.8°C between the start and the end of the 20th cen-tury and the temperature will rise between 1.8 ~ 4.0°C at the end of the 21stcentury with an in-crease in extreme events [1]. Climate change is strongly affecting diverse aspects of human a11111
OPEN ACCESS
Citation:Li M, Shi J, Guo J, Cao J, Niu J, Xiong M (2015) Climate Impacts on Extreme Energy Consumption of Different Types of Buildings. PLoS ONE 10(4): e0124413. doi:10.1371/journal. pone.0124413
Academic Editor:João Miguel Dias, University of Aveiro, PORTUGAL
Received:December 4, 2014
Accepted:March 13, 2015
Published:April 29, 2015
Copyright:© 2015 Li et al. This is an open access article distributed under the terms of theCreative Commons Attribution License, which permits unrestricted use, distribution, and reproduction in any medium, provided the original author and source are credited.
Data Availability Statement:All relevant data are within the paper and Supporting Information files.
Funding:This study was supported by Climate Change Special Funding (CCSF201332,
CCSF201423) of China Meteorological Bureau (http:// www.cma.gov.cn/) to LMC. The funders had no role in study design, data collection and analysis, decision to publish, or preparation of the manuscript.
Competing Interests:The authors have declared
society and the natural world. The significant warming climate of the whole world due to the global climate change is considered to have strong effects on a building’s energy requirement or usage as their heating and cooling needs are related to temperature conditions and weather variations [2,3]. Many previous studies have concerned the climate impact on building energy usage in recent years by using cooling/heating degree days [4,5,6], or by simulating energy con-sumption [7,8,9]. Revealing the impact of climate change on building energy concon-sumption is beneficial for not only making efficient energy saving measures but also reducing pollutant or greenhouse gas emission [3,10,11]. However, the previous studies concerning the climate change impact on energy consumption or demand primarily focused on the average energy usage. To our knowledge, except some previous studies concerning on peak electrical energy demand [12,13], no corresponding study has, so far, been attempted for the extreme energy consumption that is related to the energy saving measures or safety operation of Heating, Ven-tilation and Air Conditioning (HVAC).
In China, building is playing an extremely important role in the energy demand sector be-cause buildings account for up to 30% of the total national energy consumption (TNEC) and may be projected to contribute 35% till 2020 [8,10,14]. Many effort and measures have been taken to improve the energy efficiency of buildings since 1986 when the first building code was introduced to China [14]. However, the energy efficiency is generally still very low in China. Particularly, heating energy consumption per unit area is 2–4 times higher than developed countries [10]. The lower energy efficiency is to a large extent due to the lack of detailed infor-mation on the climate impacts on building energy consumption, efficient energy saving mea-sures, therefore, were not made according to the climate change.
Buildings designed according to climatic condition of past years may become increasingly costly to operate and maintain in the present and future [3]. Under the conditions of changing climate, especially in summer, the buildings will consume more energy but with poorer indoor air quality and lower thermal comfort. Increase in temperature and extreme weather events, temperature swings, changes in relative humidity and solar radiation should be taken into ac-count to ensure that current and future buildings are able to adapt to these changes and thus minimize the potentially destructive impacts, such as energy use and carbon emissions [3]. In the recent 100 years, China is experiencing an apparently increasing temperature, with average surface temperature increasing 0.5~0.8°C that is slightly higher the global average [15]. The in-creasing rate of temperature change is even more apparent in large cities due to the urban heat island effect [16,17]. The continuous increase of temperature companied with extreme weather or climate events will largely affect the building energy requirement or consumption. However, to our knowledge, responses of building energy usage to climate and its change are very limited in China [8,10,18]. Also, no corresponding study has yet been attempted for the climate im-pacts on energy consumption for different types of buildings. Previous studies on building en-ergy consumption are mainly concentrated on analyses by using constant increase in the annual average temperature or changes in degree-days [4,6,19]. This may, to some extent, lead to insufficient estimation of energy consumption requirement by degree-days if adjustment of appropriate parameters was not made [2,5] due to the lack of changing information of relevant variables, such as humidity, solar radiation, and wind speed.
Simulation Program, TRYSNS). Daily or hourly extreme energy consumption was determined by percentile methods and the climate impact on extreme energy consumption was analyzed. This study aimed: (1) to examine the variations of days of extreme energy consumption under the changing climate conditions, (2) to investigate the dominant climatic parameters affecting daily extreme energy consumption for different building types, (3) to study whether there are apparent delays in the effects of climatic parameters on hourly extreme energy consumption.
Methodology
Study area
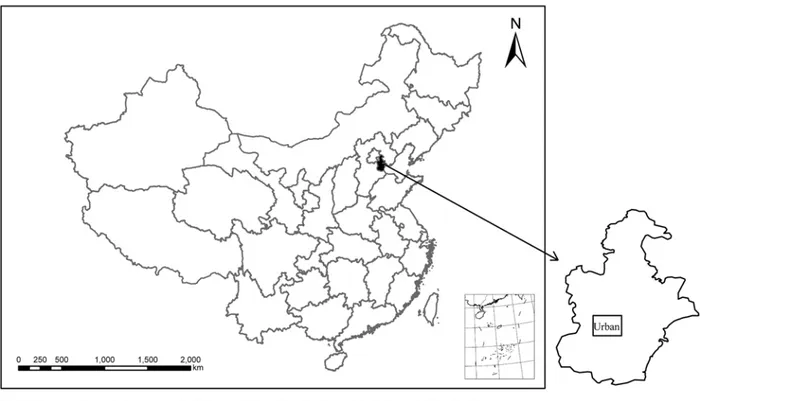
Tianjin is the second largest city by urban population after Beijing in Northern China (Fig 1, 39°100N, 117°100E), with a population of approximately 10 million in 11, 919 km2. It is located in the north of China, on the lower reaches of the Haihe River and is adjacent to the Bohai Sea. Tianjin has a semi-moist continental monsoon climate, with monsoon prevailing all year round and distinct four seasons. The annual precipitation of Tianjin city is 570 mm, most of which occurs during June to August. The mean annual temperature is 12.3°C, with annual ex-tremes of 41.7°C and -23.3°C.
Selection of buildings
To reveal the effect of climate on energy consumption for different types of buildings, residen-tial, commercial and large venue buildings in the central urban area of Tianjin (Fig 1) were se-lected. No specific permissions are required for this city and these selected building types because the selected study area does not belong to protected area or private land. Also, there are not endangered or protected species. The residential buildings generally uses coal for winter heating, whereas natural gas and electricity for both heating and cooling of commercial and
Fig 1. The location of study area in China and the site of selected buildings in Tianjin City.
large venue buildings, respectively. In the present study, a 9-storey residential building with a total area of 2, 790 m2and a 2.8 m floor-to-floor height was selected for energy consumption simulation. A generic commercial building (year-round use with air-conditioning) was select-ed. It is a 5-storey building with a curtain walling design, a 5 m floor-to-floor height and a total gross floor area of 17, 024 m2. The selected large venue building has a 4.8 m floor-to-floor height and a total gross floor area of 25, 900 m2. A summary of the key design parameters is shown inTable 1.
Multiyear simulation of building energy consumption
Energy consumption simulation was carried out using the TRNSYS software. The TRNSYS is transient system simulation program with a modular structure that was designed to solve com-plex energy system problems by breaking comcom-plex problem down into a serious of smaller components [21]. The smaller components will be integrated together as a visual interface known as the TRNSYS Simulation Studio, and building parameters are inputted through a ded-icated visual interface. TRNSYS has been commercially available since 1975 and is widely used for simulating solar energy applications, conventional buildings, and even biological processes.
Besides building input data, weather data files was also built into the software as an input file. To obtain the hour-by-hour energy consumption during the 30 years (1981–2010), data for multiple climatic variables in the form of 8760 hourly records per variable (dry bulb tem-perature, DBT; wet bulb temtem-perature, WBT; global solar radiation, GSR; wind speed, WS; and wind direction, WD) for each year from 1981 to 2010 rather than typical meteorological year (TMY) data were required for the energy simulation. The data of required climatic variables is from Tianjin Meteorological Information Center and the meteorological observation station is located in the urban center of city (Fig 1). The homogeneity of the selected meteorological data has been strictly tested to ensure the reliability and accuracy of data. The WS and WD were di-rectly collected from observed data. The dry-bulb temperature and relative humidity recorded for 4 times per day were used to generate the hourly data through cubic spline interpolation and then to permit calculation of the wet-bulb temperature. The hourly solar radiation was first generated from daily total solar radiation by using the Collores-Perein and Rabl model and then adjusted for rainy, foggy and sunny weather conditions. Comparisons of the generat-ed hourly dry-bulb temperature, relative humidity and solar radiation with the observgenerat-ed hourly data from 5 recent years (2006–2010) were conducted to verify the reliability of the generated data. The building heating (in the winter period from 15 November to 15 March in the next year) and cooling (in the summer period from 1 June to 30 August) energy consumption was analyzed and compared for each type of buildings.
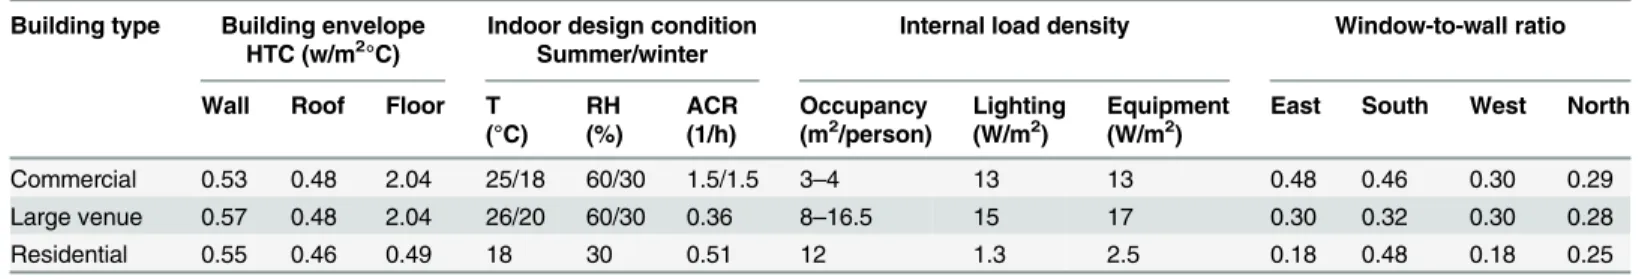
Table 1. Design data for the selected commercial, large venue and residential buildings.
Building type Building envelope HTC (w/m2°C)
Indoor design condition Summer/winter
Internal load density Window-to-wall ratio
Wall Roof Floor T RH ACR Occupancy Lighting Equipment East South West North (°C) (%) (1/h) (m2/person) (W/m2) (W/m2)
Commercial 0.53 0.48 2.04 25/18 60/30 1.5/1.5 3–4 13 13 0.48 0.46 0.30 0.29
Large venue 0.57 0.48 2.04 26/20 60/30 0.36 8–16.5 15 17 0.30 0.32 0.30 0.28
Residential 0.55 0.46 0.49 18 30 0.51 12 1.3 2.5 0.18 0.48 0.18 0.25
Note: HTC, heat transfer coefficient; T, Temperature; RH, Relative humidity; ACR, Air change rate
Monitoring of building energy consumption
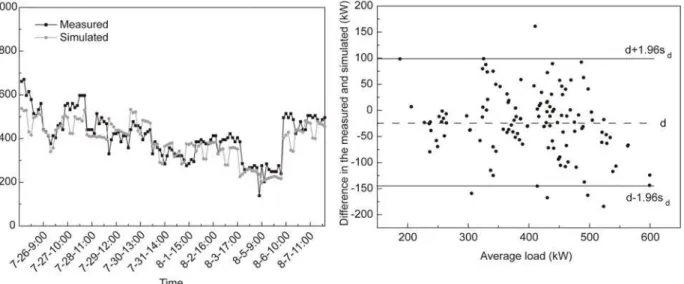
To guarantee reliability of the simulated data, energy consumption of the three types of build-ings was monitored during the heating period in 2010–2011 and the cooling period in 2010. The cooling energy consumption of commercial building was taken as an example to show the comparison between the measured and simulated energy consumption.Fig 2showed that the measured and simulated energy consumption had very similar hourly pattern and very small difference. Bland-Altman analyses revealed the good agreement between the measured and simulated energy consumption because the differences between the measured and simulated data is in a small range and only few points are outside the 95% limits of the agreement. This indicates the energy consumption simulation could be efficiently reflected the real energy con-sumption. Similar comparison results were found for other buildings.
Determinant of extreme energy consumption
Percentile methods were used to determine the extreme energy consumption for building heat-ing or coolheat-ing. Based on the number of energy consumption data, the 95thpercentile of daily energy consumption was defined daily extreme energy consumption and the 99thpercentile of hourly energy consumption was used to define the hourly extreme energy consumption.
Statistical analysis
Simple linear regression analysis was performed to examine days of extreme energy consump-tion for the different kinds of buildings. As the climate parameters themselves and their inter-action are critical for determining the impact on energy consumption, stepwise multiple linear regressions were used. Briefly, stepwise multiple linear regressions on the daily extreme energy consumption was performed against the possible climatic parameters, i.e., mean temperature, maximum temperature, minimum temperature, wet bulb temperature, solar radiation, sun-shine duration, and wind speed. Correlation analysis was used to examine the effects of climatic parameters on hourly extreme energy consumption and further determine if there were delays in the effects of climatic parameters on hourly extreme energy consumption. Statistical analyses were performed using SPSS 11.0 for Windows, and significance levels were set atP<0.05.
Fig 2. Comparisons between hourly measured and simulated cooling loads during the period from 26 July—7 August in 2010 (a) and the
Bland-Altman plot of the measured and simulated loads (b).The upper and lower solid lines in Fig 2b represent the limits of agreement, and the middle horizontal dashed line shows the mean differences.
Results
Variations of days of extreme energy consumption for different types of
buildings
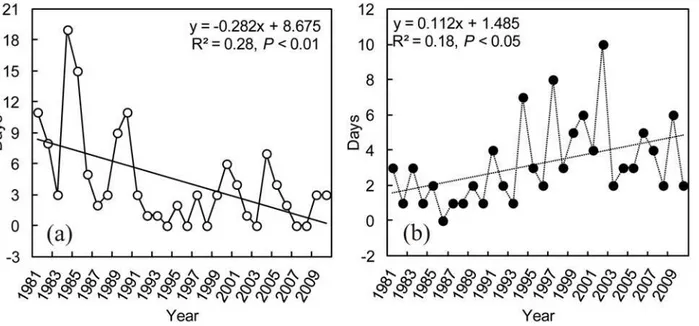
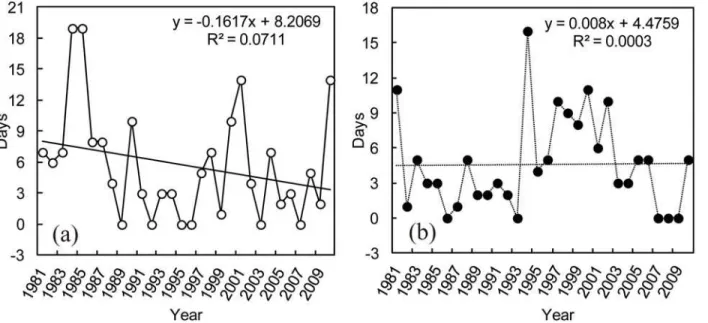
Days of extreme heating energy (electricity) consumption of large venue building showed large and significant decrease from 1981 to 2010 (R2= 0.28,P<0.01) (Fig 3a), with a decreasing rate of average 2.8 d/10a. By contrast, the days of extreme cooling energy (electricity) consump-tion had significant increase during the recent 30 years (R2= 0.18,P<0.05) (Fig 3b). The in-creasing rate (1.1 d/10a) of extreme cooling energy consumption is lower than the dein-creasing rate of extreme heating energy consumption. In addition, large interannual fluctuations were found for the days of extreme heating or cooling energy consumption, with the highest days of extreme heating (19d) and cooling (10d) energy consumption occurring in 1984 and 2002, respectively.
For commercial building, days of extreme heating or cooling energy (natural gas) consump-tion did not have significant variaconsump-tions from 1981 to 2010 (P>0.05) (Fig 4) although there was a weak decrease (1.6 d/10a) in the extreme heating energy consumption (Fig 4a). There were large interannual fluctuations for the days of extreme heating and cooling energy con-sumption. The highest days of extreme heating (19d) energy consumption occurred in 1984 and 1985, and extreme cooling (16d) energy consumption was in 1994. The same to large venue building, days of extreme heating energy (coal) consumption of residential building showed significant decrease during the last 30 years (R2= 0.15,P<0.05) (Fig 5), with the de-creasing rate of 2.59 d/10a. There were also interannual fluctuations for the days of extreme heating energy consumption, with the highest days of extreme heating (21d) in 1985.
Climate impacts on daily extreme energy consumption
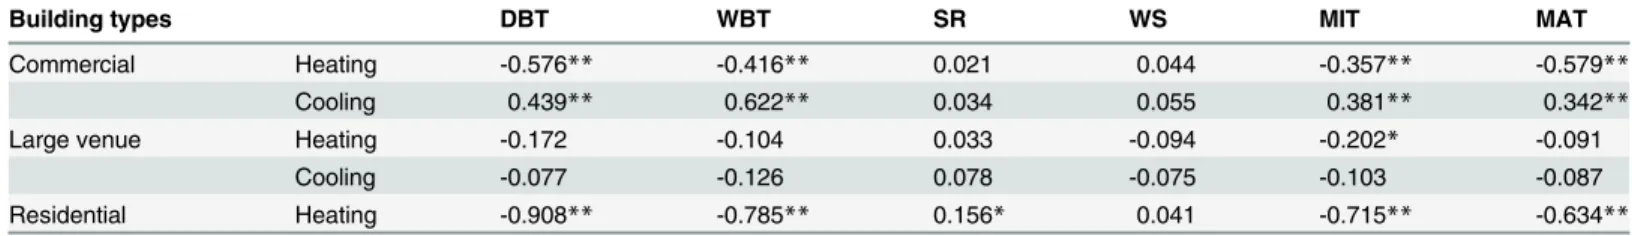
Table 2showed the correlations between daily extreme energy consumption and climatic pa-rameters for the selected different types of buildings. Daily extreme heating or cooling energy consumptions for large venue building were not impacted by climate parameters except a weakly negative correlation between extreme heating energy consumption and minimum
Fig 3. Yearly variations in days for extreme heating (a) and cooling (b) energy consumption of large venue building.
temperature (Table 2). By contrast, daily extreme heating energy consumption for commercial or residential buildings and daily extreme cooling energy consumption for commercial build-ing had significant correlations with various climatic parameters (Table 2).
In order to reveal the dominant climatic parameters impacting daily extreme energy con-sumption, stepwise multiple regressions were performed. For commercial building, MAT, DBT, SR and MIT entered the regression model for the analysis of daily extreme heating energy
Fig 4. Yearly variations in days for extreme heating (a) and cooling (b) energy consumption of commercial building.
doi:10.1371/journal.pone.0124413.g004
Fig 5. Yearly variations in days for extreme heating (a) and cooling (b) energy consumption of residential building.
consumption (Table 3). In addition, with the increase of climatic parameters, the R2showed apparent increase from 0.33 to 0.71, indicating these climatic parameters together can explain 71% of the variations of daily extreme heating energy consumption. Daily extreme cooling en-ergy consumption for commercial building was only affected by the WBT that could explain 38% of the variations of daily extreme cooling energy consumption (R2= 0.382) (Table 3).
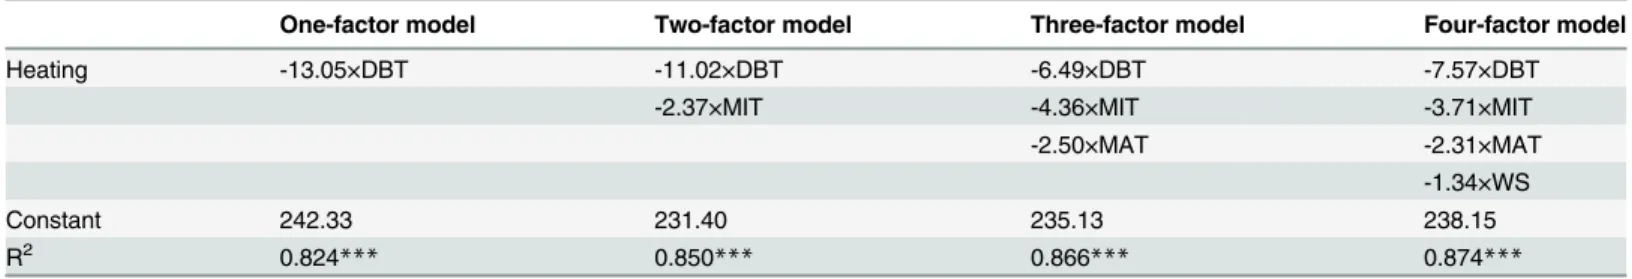
Regression analysis suggests the daily extreme heating or cooling energy consumptions for large venue building is not related to climatic parameters although there was a significant re-lationship between the daily extreme value and MIT at the 0.05 significant level (Table 4, R2= 0.033). Four climatic parameters (DBT, MIT, MAT, WS) entered the regression model for the daily extreme heating energy consumption of residential building, but the R2did not show apparent increase from one-factor model to four-factor model (Table 5). This indicates the daily extreme heating energy consumption for residential building is dominantly affected DBT and DBT can explain 82% of the variations of extreme value (R2= 0.824).
Climatic impacts on hourly extreme energy consumption
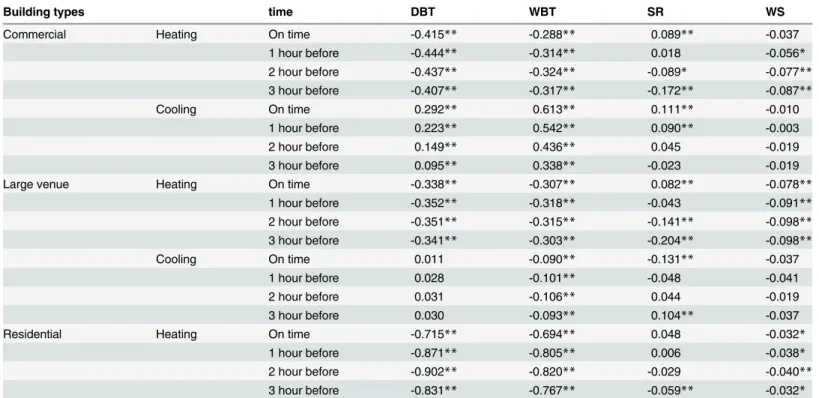
The correlation analysis between hourly extreme energy consumption and climatic parameters were shown inTable 6. Hourly extreme heating energy consumption had negative correlations with DBT, WBT and WS in all the three types of buildings. The correlation coefficient with
Table 2. Correlations between daily extreme energy consumption and climatic parameters for different kinds of buildings.
Building types DBT WBT SR WS MIT MAT
Commercial Heating -0.576** -0.416** 0.021 0.044 -0.357** -0.579**
Cooling 0.439** 0.622** 0.034 0.055 0.381** 0.342**
Large venue Heating -0.172 -0.104 0.033 -0.094 -0.202* -0.091
Cooling -0.077 -0.126 0.078 -0.075 -0.103 -0.087
Residential Heating -0.908** -0.785** 0.156* 0.041 -0.715** -0.634**
Note:
*P<0.05; **P<0.01;
DBT, dry bulb temperature; WBT, wet bulb temperature; SR, solar radiation; WS, wind speed; MIT, minimum temperature; MAT, maximum temperature. The same below.
doi:10.1371/journal.pone.0124413.t002
Table 3. Regression analysis for daily extreme energy consumption of commercial building against the climatic parameters.
One-factor model Two-factor model Three-factor model Four-factor model
Heating -27.68×MAT -17.03×MAT -9.86×MAT -1.95×MAT
-16.78×DBT -48.69×DBT -75.17×DBT
-20.79×SR -20.58×SR
16.844×MIT
Constant 931.09 853.37 794.98 803.27
R2 0.332
*** 0.399*** 0.677*** 0.715***
Cooling 51.48×WBT
Constant -69.15
R2 0.382
***
Note:
***P<0.001
DBT was higher than WBT. This indicates hourly extreme heating energy consumption is dominantly affected by the DBT, followed by WBT. The WS has little effect due to the very small correlation coefficient. The hourly extreme cooling energy consumption for commercial building had positive correlations with DBT, WBT and SR, with the highest correlation coeffi-cient with WBT, indicating the hourly extreme cooling energy consumption is mainly impact-ed by WBT. For large venue building, hourly extreme cooling energy consumption may not be affected by climatic parameters because the correlation coefficient was very small although sig-nificant correlations were found.
For commercial building, the correlation coefficient between hourly extreme heating energy consumption and DBT and WBT showed weak increase from the climatic parameters on time to the climatic parameters 1 or 2 hour before, indicating that the climate impact on the hourly extreme heating energy consumption has about 1 or 2 hour delay. The correlation analysis for large venue building suggests that there are 1–2 hour delay for the DBT and WBT impacts and 3 hour delay for the SR impact. The DBT and WBT impacts on hourly extreme heating energy consumption for residential building have 2 hour delay. Although there were significant im-pacts of WBT and DBT from on time to 3 hour before on the hourly extreme cooling energy consumption, the correlation coefficient weakly decreased, indicating no apparent delay for the climate impacts on the hourly extreme cooling energy consumption.
Discussion and Conclusions
The paper simulated heating and cooling energy consumption for three types of buildings by TRNSYS software and the simulated data were compared with measured data to guarantee reli-ability of the simulated data. The 95thand 99thpercentile of obtained energy consumption
Table 4. Regression analysis for daily extreme energy consumption of large venue building against the climatic parameters.
One-factor model
Heating -2.78×MIT
Constant 3367.84
R2 0.033
*
Cooling NS
Note:
*P<0.05; NS, no significance
doi:10.1371/journal.pone.0124413.t004
Table 5. Regression analysis for daily extreme energy consumption of residential building against the climatic parameters.
One-factor model Two-factor model Three-factor model Four-factor model
Heating -13.05×DBT -11.02×DBT -6.49×DBT -7.57×DBT
-2.37×MIT -4.36×MIT -3.71×MIT
-2.50×MAT -2.31×MAT
-1.34×WS
Constant 242.33 231.40 235.13 238.15
R2 0.824
*** 0.850*** 0.866*** 0.874***
Note:
***P<0.001
were used to define the daily and hourly extreme energy consumption, respectively. The cli-mate impacts on daily and hourly extreme heating and cooling energy consumption were determined.
Days of extreme heating energy consumption generally showed decreasing trend in the last 30 years for all the three types of buildings although the decreasing trend is not significant at the 0.05 level for the commercial building. The decreasing trend is consistent with the varia-tions of average heating energy consumption in previous studies that determined the energy consumption by using degree-days [4,6,19]. Tianjin, especially in the urban area, has experi-enced substantial increase in temperature in the last decades due to the rapid urbanization [16,20]. With the continuous increase of greenhouse and urban expansion, the climate in the large city will undoubtedly show apparent warming in the future, as pointed by Argüesoet al.
(2014) who concluded the temperature increase by the combined effects of GHGs and urban expansion could be double the increase due to the global warming alone at 2050 [22]. The con-tinuously significant warming in urban climate will decrease the energy demand for building heating. These may be used to make measures for saving energy consumption of building heat-ing at the conditions of higher indoor thermal comfort. In addition, the decrease of days of ex-treme heating energy consumption is beneficial for safety operation of Heating systems because the occurrence of extreme energy consumption may be further less in the future. How-ever, it is necessary to note that although the days of extreme heating energy consumption de-creased, there are large interannual fluctuations that should be taken account to design the capacity of Heating systems.
Table 6. Correlations between hourly extreme energy consumption for different types of buildings and climatic parameters.
Building types time DBT WBT SR WS
Commercial Heating On time -0.415** -0.288** 0.089** -0.037
1 hour before -0.444** -0.314** 0.018 -0.056*
2 hour before -0.437** -0.324** -0.089* -0.077**
3 hour before -0.407** -0.317** -0.172** -0.087**
Cooling On time 0.292** 0.613** 0.111** -0.010
1 hour before 0.223** 0.542** 0.090** -0.003
2 hour before 0.149** 0.436** 0.045 -0.019
3 hour before 0.095** 0.338** -0.023 -0.019
Large venue Heating On time -0.338** -0.307** 0.082** -0.078**
1 hour before -0.352** -0.318** -0.043 -0.091**
2 hour before -0.351** -0.315** -0.141** -0.098**
3 hour before -0.341** -0.303** -0.204** -0.098**
Cooling On time 0.011 -0.090** -0.131** -0.037
1 hour before 0.028 -0.101** -0.048 -0.041
2 hour before 0.031 -0.106** 0.044 -0.019
3 hour before 0.030 -0.093** 0.104** -0.037
Residential Heating On time -0.715** -0.694** 0.048 -0.032*
1 hour before -0.871** -0.805** 0.006 -0.038*
2 hour before -0.902** -0.820** -0.029 -0.040**
3 hour before -0.831** -0.767** -0.059** -0.032*
Note:
*P<0.05; **P<0.01
The days of extreme cooling energy consumption, difference from heating energy consump-tion, showed very significant increase (large venue building) or no variation but with very large interannual fluctuations (commercial building). Just pointed out above, significant warming will continue in northern China in the future [23], especially in the urban areas of large cities due to the increase of greenhouse and urban expansion [22]. This will lead to significant crease or large interannual fluctuations of extreme cooling energy consumption as well as in-creasing average energy consumption, which should fully be considered when correcting or optimizing Air conditioning system design because the increase in energy consumption, espe-cially extreme energy consumption may have risen to values above design conditions of Air-conditioning systems of buildings.
From the correlation and regression analyses, it is found that the relationships of daily treme energy consumption to climate parameters vary with the types of buildings. Daily ex-treme heating or cooling energy consumption for large venue building is not affected by climate parameters. Daily extreme heating energy consumption for commercial buildings is closely related with MAT, DBT, SR, MIT, whereas it is only impacted by DBT for residential building. For the extreme cooling energy consumption of commercial building, the WBT is the dominant affecting climatic parameter, which means that the cooling energy consumption is impacted by the combination of temperature and humidity. The hourly extreme heating energy consumption is dominantly impacted by DBT, followed by WBT for all the three types of buildings, whereas cooling energy consumption is closely related with WBT for commercial building or has no apparent relationship to climate for the large venue building. The climate impacts on hourly extreme heating energy consumption have 1–3 hour delay for three build-ings, dependent of climatic parameters. This information may be useful for giving a basis for energy-saving or adjusting operation of Heating or Air conditioning systems when taking into account the climate impacts.
In summary, the climate impacts on extreme energy consumption of different types of buildings are determined in this study. Days of extreme heating energy consumption generally showed decreasing trend in the last 30 years and days of extreme cooling energy consumption showed increase or no variation. However, large interannual fluctuations exist in the extreme heating and cooling energy consumption. This would be helpful for researchers or designers to make measures for improving energy efficiency or ensuring the safety of Heating or Air condi-tioning systems. The impacts of climate on the extreme energy consumption depend on the building types or climatic parameters. This would be of interests to policy makers and building industry managers on how to make appropriate measures improve operating efficiency of Heating or Air conditioning systems and ensure their operating safety at the conditions of changing climate.
Supporting Information
S1 File. Raw data.Measured and simulated energy consumption data.
(XLS)
S2 File. Raw data.Days for extreme energy consumption of three types of buildings.
(XLS)
S3 File. Raw data.Daily extreme energy consumption of different types of buildings.
(XLS)
S4 File. Raw data.Hourly extreme energy consumption of different types of buildings.
Author Contributions
Conceived and designed the experiments: MCL. Performed the experiments: MCL JDN JFC. Analyzed the data: MCL JS. Contributed reagents/materials/analysis tools: MMX. Wrote the paper: MCL. Critical review of the manuscript: JG MMX. Provided convenience for performing the experiments: JG.
References
1. IPCC, Climate Change. In: Solomon S, Qin D, Manning M, Chen Z, Marquis M, KB Averty, et al. The physical science basis. Contribution of working group I to the forth assessment report of the IPCC. Cambridge: Cambridge University Press; 2007.
2. Papakostas K, Mavromatis T, Kyriakis N. Impact of the ambient temperature rise on the energy consump-tion for heating and cooling in residential buildings of Greece. Renew Energ. 2010; 35: 1376–1379.
3. Yau YH, Hasbi S. A review of climate change impacts on commercial buildings and their technical ser-vices in the tropics. Renew Sust Energ Rev. 2013; 18: 430–441.
4. Chen L, Fang XQ, Li S. Impacts of climate warming on heating energy consumption and southern boundaries of severe cold and cold regions in China. Chinese Sci Bull. 2007; 52(20): 2854–2858.
5. McGilligan C, Natarajan S, Nikolopoulou M. Adaptive comfort degree-days: a metric to compare adap-tive comfort standards and estimate changes in energy consumption for future UK climates. Energ Buildings. 2011; 3: 2767–2778.
6. Jiang FQ, Li XM, Wei BG. Observed trends of heating and cooling degree-days in Xinjiang Province, China. Theo Appl Climatol. 2012; 97: 349–360.
7. Wang XM, Chen D, Ren ZG. Assessment of climate change impact on residential building heating and cooling energy requirement in Australia. Build Environ. 2010; 45: 1663–1682.
8. Wan KKW, Li DHW, Lam JC. Assessment of climate change impact on building energy use and mitiga-tion measures in subtropical climates. Energy. 2011; 36: 1404–1414.
9. Li MC, Guo J, Tian Z, Shi J, Xiong MM, Xiang C. Future climate change and building energy demand in Tianjin, China. Build Serv Eng Res T. 2014; 35: 362–375.
10. Wan KKW, Li DHW, Liu DL, Lam JC. Future trends of building heating and cooling loads and energy consumption in different climates. Build Environ. 2011; 46: 223–234.
11. Cai WG, Wu Y, Zhong Y, Ren H. China building energy consumption: situation, challenges and corre-sponding measures. Energ Policy. 2009; 37: 2054–2059.
12. Sadineni SB, Robert FB. Measurements and simulations for peak electrical load reduction in cooling dominated climate. Energy. 2012; 37: 689–697.
13. Kalvelage K, Passe U, Rabideau S, Takle ES. Changing climate: the effect on energy demand and human comfort. Energ Buildings. 2014; 76: 373–380.
14. Yao R, Li B, Steemers K. Energy policy and standard for built environment in China. Renew Energ. 2005; 30: 1973–1988.
15. Ding YH, Ren GY, Zhao ZC, Xu Y, Luo Y, Li QP, et al. Detection, causes and projection of climate change over China: an overview of recent progress. Adv Atmos Sci. 2007; 24(6): 954–971.
16. Ren GY, Zhou YQ, Chu ZY, Zhou JX, Zhang AY, Guo J, et al. Urbanization effects on observed surface air temperature trends in North China. J Climate. 2008; 21: 1333–1347.
17. Yang XC, Hou YL, Che BD. Observed surface warming induced by urbanization in east China. J Geo-phys Res. 2011; 116(D14). doi:10.1029/2010/JD 15452PMID:24383048
18. Li DHW, Yang L, Lam JC. Zero energy buildings and sustainable development implications-a review. Energy. 2013; 54: 1–10.
19. Zhang QY. Residential energy consumption in China and its comparison with Japan, Canada, and USA. Energ Buildings. 2004; 36: 1217–1225.
20. Guo J, Li MC, Liu DY. Effects of urbanization on air temperature of Tianjin in recent 40 years. Ecol Envi-ron Sci. 2009; 18(1): 29–34. (in Chinese with English abstract)
21. Grawley DB, Hand J, Kummert M, Griffith BT. Contrasting the capabilities of building energy perfor-mance simulation programs. Build Simul. 2005; 43: 231–238.
22. Argüeso D, Evans JP, Fita L, Bormann KJ. Temperature response to future urbanization and climate change. Clim Dynam. 2014; 42(7–8): 2183–2199. PMID:25717399