Article
Printed in Brazil - ©2019 Sociedade Brasileira de Química*e-mail: [email protected]
Carbon in Physical Fractions and Organic Matter Chemical Composition of
an Acrisol after Amazon Forest Burning and Conversion into Pasture
Otávio A. Leal, *,a Deborah P. Dick,b Falberni S. Costa,c Heike Knicker,d
João A. de Carvalho Júniore and José C. Santosf
aInstituto Federal Catarinense (IFC), 88965-000 Santa Rosa do Sul-SC, Brazil
bDepartamento de Química, Universidade Federal do Rio Grande do Sul (UFRGS),
91501-970 Porto Alegre-RS, Brazil
cEmbrapa Acre, Rodovia BR-364, km 14, 69900-970 Rio Branco-AC, Brazil
dInstituto de Recursos Naturales y Agrobiología de Sevilla, 41012 Sevilha, Spain
eDepartamento de Energia, Universidade Estadual Paulista (UNESP),
12516-410 Guaratinguetá-SP, Brazil
fLaboratório Associado de Combustão e Propulsão, Instituto Nacional de Pesquisas Espaciais (INPE),
12630-000 Cachoeira Paulista-SP, Brazil
The aim of this study was to investigate impacts of Amazon Forest (AF) fire and conversion to pasture on carbon accumulation in particle size fractions and organic matter (OM) composition of an Acrisol. Soil samples were collected (0.00-2.00 m depth) in three sites: native AF (NAF); AF under natural regeneration for two years after burning (BAF); 23-years old Brachiaria pasture
after AF burning (BRA). Assuming NAF area as reference, BAF and BRA areas showed negative carbon balance when carbon emitted to the atmosphere at AF burning is taken into account. Soil OM aromaticity and hydrophobicity, assessed via 13C nuclear magnetic resonance, in BRA and BAF
were similar to that in NAF. Fire and post-fire land use altered the carbon distribution in sand, silt and clay along the soil profile and seem to have affected organo-mineral and OM self-assemblage interactions, since the relation between total soil carbon and carbon in clay was asymptotic in BAF and linear in NAF and BRA.
Keywords: clay, saturation, deep stocks, aromaticity, 13C NMR
Introduction
In 2013, 115,484 active fire points, mainly man and also naturally induced, were detected in Brazil, the lowest number since the year 2000 (101,532). However, this number substantially increased to 183,693 in 2014 and to 236,066 in 2015 and in the time span from January to July 2017 this number enhanced by 38% if compared to that registered for the same period in 2015.1
Cerrado and Amazon are the Brazilian biomes most affected by fire,2 which usually aims the clearing of the
area for agriculture purposes, as pasture implementation, the dominant land use in Brazilian Amazon.3 In fact,
approximately 62% of the deforested Amazon areas have been turned to pasture.4 In the short term, fire
generally promotes a soil fertilizing effect due to the mineralization of biomass and ashes addition to the soil. However, if no further soil amendment is performed, nutrients concentration in soil tends to decrease after few months, frequently to concentrations lower than originally. Consequently, these areas are soon abandoned by farmers and new forest sites are sought for cattle raising, expanding burned and deforested areas in Amazon Forest (AF).5,6 Fire and deforestation affect not
only aboveground carbon (C) stocks of AF, but also soil organic matter (SOM) composition and stocks. Post-fire land management, e.g. forest regeneration or agriculture, will strongly drive accumulation or depletion of SOM
Carbon in Physical Fractions and Organic Matter Chemical Composition of
an Acrisol after Amazon Forest Burning and Conversion into Pasture
Otávio A. Leal, *,a Deborah P. Dick,b Falberni S. Costa,c Heike Knicker,d
stocks and changes on organic matter composition, influencing C balance positively or negatively in relation to the undisturbed forest.7
The literature reports decrease as well as increase in SOM content after vegetation burning events.8-11 Usually,
loss of labile organic compounds (e.g. carbohydrates) and increase in aromatic and polyaromatic C compounds (pyrogenic C, PyC) are observed right after vegetation burning, shifting SOM composition towards a higher aromatic and hydrophobic character, specially within the first soil layers.12,13
Recently, the contribution of PyC to the total soil C in Amazon Basin soils has been estimated to increase progressively in depth, from 2.5% at 0.00-0.05 m depth up to 11% at 150-2.00 m depth, values considerably higher than previously reported in the literature.14,15 Considering
that the hydrophobicity of PyC compounds affects the soil sorption capacity, altering organo-mineral interactions and consequently the stability of SOM,16 these findings suggest
that C accumulation in mineral fractions, particularly at deep soil depths, must be assessed in order to elucidate the post-fire C dynamics in Amazonian soils.
Silt and especially clay have greater available, but still limited, surface area for organo-mineral interactions than sand. Therefore, fine-textured soils usually accumulate more C, although silt and clay are subjected to C saturation.17 Studies dedicated to investigate C saturation
levels in mineral soil fractions have been performed in soils under agricultural management.18-20 In Amazonian
soils, studies on C retention capacity and saturation of silt and clay are scarce, and could elucidate the effectiveness of undisturbed and fire-affected soils either under natural regeneration or pasture to sequester C.
Fire events and post-fire land use change, mainly to pasture, are realistic scenarios in AF and should be carefully considered by the scientific community, since it may affect SOM dynamics and thus global warming. In fact, the Brazilian Government has committed at the Copenhagen Climate Change Conference of 2009 to reduce 36 to 39% of its greenhouse gas emissions (1 billion tons of CO2 equivalent) by 2020. For that, the Government has
established several strategies as for example to reduce Amazon deforestation rates by 80%.21
In this context, this work aimed to compare areas under pasture and natural forest regeneration after AF burning to an undisturbed AF site regarding their soil C stocks in depth and mineral fractions, C retention capacity and SOM composition. This work is part of a pioneer study in Acre State, Brazil, Western Amazon, investigating greenhouse gas emission rates from controlled forest fire experiments, conducted with governmental permission.22
Experimental
Experimental site: controlled forest burning
The studied area is located in Cruzeiro do Sul municipality, Acre State, Brazil, and belongs to a local farmer (Santa Luzia settlement) (Figure 1). The climate where the experiment is located is tropical humid without dry season (Af according to Köppen’s classification).23 The
annual mean temperature is 24.9 °C, the annual rainfall rate is 2,280 mm and the relative humidity is 86%. The soil is classified as Argissolo Vermelho distrófico plíntico according to the Brazilian soil classification24 and as
Acrisol.25
An area of 4 ha of primary forest (open ombrophilous forest with palm trees) was selected and properly isolated for preventig fire spreading. In July 2010, the vegetation of this area was cut and left to be dried under field conditions for three months, and in September 2010 it was burned (slash-burn). This experiment has been developed with the authorization of the responsible Brazilian government agencies (Instituto do Meio Ambiente do Acre and Secretaria do Meio Ambiente do Estado do Acre).22 Figure 2
shows the weather conditions of Cruzeiro do Sul between 2008 and 2012, comprising 2010, when the slash-and-burn of vegetation was performed (June-September).
The total fresh biomass of the test field was 688 t ha-1,
from which 85% was made up by plants with diameter at breast height (DBH) > 10 cm and 15% by litter and plants with DBH < 10 cm. The amount of aboveground C was estimated as 191 t ha-1 before burning. Considering a total
biomass consumption of 40%, the amount of C released to the atmosphere was estimated as 74.3 Mg ha-1.22
Soil sampling
Two years after burning, in September 2012, representative soil samples were collected from the burned Amazon Forest (BAF), which was under natural regeneration since burning in 2010. Soil samples were collected in two areas adjacent to BAF: native Amazon Forest, unburned (NAF); and pasture area under Brachiaria brizantha cultivation (BRA). The BRA area was under native AF until 1989, when the area was cleared by slash-and-burn of the vegetation and Brachiaria pasture was implemented. According to local farmers, this was the only fire event in BRA area until soil sampling in 2012.
Soil physical fractionation and carbon and nitrogen analyses
Soil samples from depths 0.00-0.05, 0.05-0.10, 0.20-0.30, 0.40-0.50, 0.75-1.00 and 1.00-1.50 m were subjected to particle size fractionation (in duplicate) according to Reis et al.19 In a 100 mL glass tube, 15 g of soil
and 50 mL of distilled water were added. The suspension was mechanically shaken in horizontal position for 16 h and thereafter passed through a 53-µm sieve. The sand fraction and the particulate organic matter were retained by the sieve. The portion passing through the sieve was sonicated with energy required to obtain 99% dispersion and separate silt and clay fractions. The energy was previously calculated based on the energy mL-1 × dispersed clay g kg-1 curve,
where clay was recovered after application of increasing
Figure 1. Experimental site location within Cruzeiro do Sul municipality, Acre State, Brazil. NAF: native Amazon Forest; BAF: burned Amazon Forest; BRA: Brachiaria pasture.
Figure 2. Precipitation (PPT) and maximum, average and minimum
temperatures (Tmax, Taver and Tmin, respectively) in Cruzeiro do Sul between 2008 and 2012.
Table 1. Particle size distribution along the Acrisol profile
Depth / m Sand / (g kg-1) Sand / % Silt / (g kg-1) Silt / % Clay / (g kg-1) Clay / %
0.00-0.05 806 80.6 136 13.6 58 5.8
0.05-0.10 777 77.7 152 15.2 71 7.1
0.10-0.15 700 70.0 196 19.6 104 10.4
0.15-0.20 683 68.3 193 19.3 124 12.4
0.20-0.30 663 66.3 192 19.2 145 14.5
0.30-0.40 625 62.5 223 22.3 152 15.2
0.40-0.50 646 64.6 196 19.6 158 15.8
0.50-0.75 604 60.4 197 19.7 199 19.9
0.75-1.00 644 64.4 164 16.4 192 19.2
1.00-1.50 609 60.9 170 17.0 221 22.1
energies. Different dispersing energies were applied to the suspension acording to the soil depth: 0.00-0.05 and 0.05-0.10 m (157 J mL-1), 0.20-0.30 m (233 J mL-1),
0.40-0.50 m (93 J mL-1), and 0.75-1.00 and 1.00-1.50 m
(123 J mL-1). The dispersed suspension was transferred
to a glass tube and its volume was completed to 1 L with distilled water. The clay fraction was removed from the tube by successive collections according to Stoke’s law, remaining only distilled water and the silt fraction in the tube. Both silt and clay fractions were flocculated with 1 mol L-1 HCl solution, dried in oven at 50 °C, weighed and
milled in a mortar. The proportion of clay and silt fractions were obtained gravimetrically. The proportion of sand was obtained as %sand = 100% – (%silt + %clay).
C and nitrogen (N) contents of the soil (Csoil, Nsoil), clay
(Cclay, Nclay) and silt (Csilt, Nsilt) were determined by dry
combustion (PerkinElmer 2400, detection limit 0.01%). The C and N contents in the sand (Csand, Nsand) were obtained
as Csand = Csoil – (Cclay + Csilt) and Nsand = Nsoil – (Nclay + Nsilt).
The Csoil and Nsoil stocks were calculated according
to the equivalent mass method using NAF as reference.26
Carbon retention capacity and deficit of carbon saturation in soil fractions
The C retention capacity (Crc) of clay and silt fractions
was estimated by relating it to Csoil. The Cclay of the soil
under BAF best fitted to the exponential maximum equation Cclay = a + b(1 – ecCsoil), while Csilt from BAF and Cclay and Csilt
from NAF and BRA best fitted to a linear equation Cclay or
Csilt = a + b(Csoil). The symbols a, b and c are constants and
Cclay, Csilt and Csoil correspond to the C content (in g kg-1) in
each compartment. The maximum Crc of clay fraction under
BAF was calculated by the exponential equation described above assuming Csoil tending to infinity.
The C saturation deficit (Csd) of the clay fraction under
BAF was calculated for each soil depth according to the equation Csd = Crc – Cclay, according to Angers et al.27
Solid-state 13C nuclear magnetic resonance spectroscopy
(13C NMR)
Whole soil samples collected at 0.00-0.05, 0.05-0.10 and 0.40-0.50 m depth were selected for 13C NMR analysis.
Previous to analysis, the samples were treated with hydrofluoric acid (HF) solution to concentrate organic matter and remove paramagnetic materials.28 Samples were
mechanically shaken with 10% HF in centrifuge tubes for 2 h. The suspension was centrifuged (2000 g) for 10 min and the supernatant was removed and discarded. This procedure was repeated six times. The material remaining
in the tube was washed with distilled water, dried in oven at 50 °C and milled in a mortar.
The soild-state 13C NMR spectra were obtained with
a Bruker Avance III 600 MHz spectrometer operating at a resonance frequency of 150.91 MHz. The cross polarization magic angle spinning (CPMAS) procedure was used with a spinning speed of 15 kHz and a contact time for crossed polarization of 1 ms. Spectra of samples collected at 0.40-0.50 m depth could not be obtained due to its low C content even after HF treatment. Between 11,700 and 42,000 scans were accumulated depending on the C content of the samples. The chemical shifts were reported relative to tetramethylsilane scale (0 ppm), which was adjusted with glycine (COOH = 176.08 ppm). The contributions of the various C groups to the Csoil
were calculated using MestreNova 8.1 by integrating spectrum subregions, which are assigned to specific C groups, as follows: 0-45 ppm, alkyl C; 45-60 ppm, N-alkyl C; 60-110 ppm, O-alkyl C; 110-160 ppm, aryl C; and 160-220 ppm, carboxyl C.29
The hydrophobicity index (HI) of the SOM was calculated according to Abelmann et al.30 as follows:
HI = (alkyl C + aryl C) / (O-alkyl C + carboxyl C).
Data analysis
Representative soil samples were collected from modal profiles in BAF, NAF and BRA areas. Sites with similar topographic positions and same soil class were selected for soil sampling in order to minimize variations. Additionally, laboratory replicates were performed. The data was evaluated by descriptive analysis. Mean and standard deviation of Csoil and Nsoil were calculated based on two
chemical replicates. The soil particle size fractionation was performed in duplicate and therefore the mean and standard deviation of Csand, Cclay, Csilt, Nsand, Nsilt, Nclay were calculated
based on the chemical analysis of each duplicate.
Results and Discussion
Total soil carbon (Csoil) and nitrogen (Nsoil) contents and
stocks
Decrease of Csoil content along the soil profile was
observed in the three areas. Csoil content varied from 2.3
to 17.9 g kg-1 in BAF, 1.2 to 14.5 g kg-1 in NAF and 2.4
to 10.1 g kg-1 in BRA (Table 2). The effects of forest
burning and conversion of AF to pasture on Csoil contents
were remarkable within 0.00-0.20 m depth, especially at 0.00-0.05 m, where Csoil content of BAF area was 23 and
burning of the aboveground biomass leads to the addition of organic matter to the soil, particularly of compounds with aromatic and hydrophobic character, which are more resistant to biochemical degradation and therefore, tend to accumulate in fire-affected soils.16 However, in our study,
increase in SOM aromaticity in BAF compared to NAF was not evidenced by 13C NMR spectroscopy (Table 3). It
seems that the addition of new organic material to the soil due to forest regeneration (for two years) after burning, had a stronger effect on Csoil content increase in BAF than the
accumulation of PyC.
The lower Csoil content of BRA area, especially at
0.00-0.05 m, in comparison to that observed in BAF and NAF areas, can be assigned to the inadequate management of the pasture and the high exportation of biomass by the livestock, leading to lower annual deposition of plant residues onto the soil along 23 years of cattle raising. Furthermore, in BRA, the SOM derived from the forest
may have been decomposed and lost after the conversion of forest to pasture. In this context, Araújo et al.31 observed
that up to 70% of the SOM derived from AF was lost from the 0.00-0.40 m depth of an Oxisol after 20 years of its conversion to pasture.
Similar Nsoil contents were observed along the soil
profiles under BAF and NAF, which were, in general, slightly higher than Nsoil contents of BRA area (Table 2).
Possibly, the lower addition of biomass on the BRA soil along with the permanent cultivation of non-N-fixing plants in this area, may have contributed to these findings.
The Csoil stock in BAF was similar to that in NAF up
to 0.75 m depth, but 72, 133 and 93% higher at 0.75-1.00, 1.00-1.50 and 1.50-2.00 m depths, respectively. Similar
behavior was observed comparing NAF and BRA Csoil
stocks. Even though Csoil stock in NAF was slightly
greater than that in BRA up to 1.00 m depth, probably due to minimal pasture management along the years,3
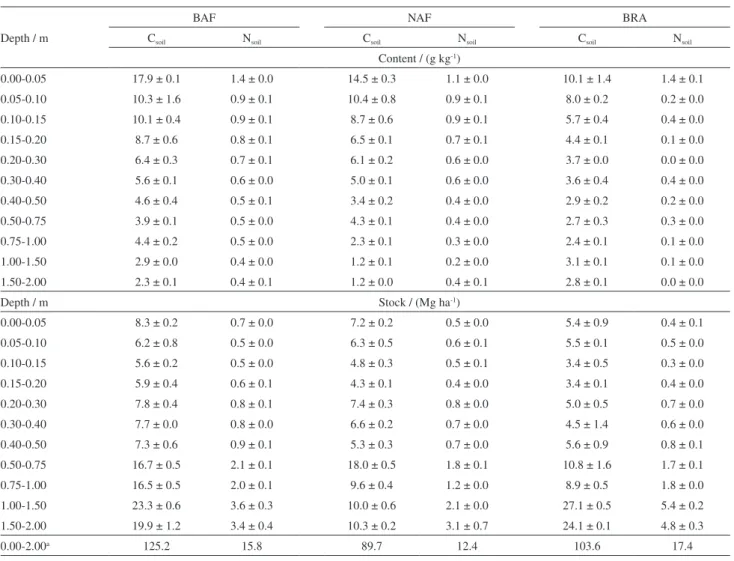
Table 2. Total soil carbon (Csoil) and nitrogen (Nsoil) contents and stocks along the profile of an Acrisol under burned Amazon Forest (BAF), native Amazon Forest (NAF) and Brachiaria pasture (BRA) (values are mean ± standard deviation)
Depth / m
BAF NAF BRA
Csoil Nsoil Csoil Nsoil Csoil Nsoil
Content / (g kg-1)
0.00-0.05 17.9 ± 0.1 1.4 ± 0.0 14.5 ± 0.3 1.1 ± 0.0 10.1 ± 1.4 1.4 ± 0.1
0.05-0.10 10.3 ± 1.6 0.9 ± 0.1 10.4 ± 0.8 0.9 ± 0.1 8.0 ± 0.2 0.2 ± 0.0
0.10-0.15 10.1 ± 0.4 0.9 ± 0.1 8.7 ± 0.6 0.9 ± 0.1 5.7 ± 0.4 0.4 ± 0.0
0.15-0.20 8.7 ± 0.6 0.8 ± 0.1 6.5 ± 0.1 0.7 ± 0.1 4.4 ± 0.1 0.1 ± 0.0
0.20-0.30 6.4 ± 0.3 0.7 ± 0.1 6.1 ± 0.2 0.6 ± 0.0 3.7 ± 0.0 0.0 ± 0.0
0.30-0.40 5.6 ± 0.1 0.6 ± 0.0 5.0 ± 0.1 0.6 ± 0.0 3.6 ± 0.4 0.4 ± 0.0
0.40-0.50 4.6 ± 0.4 0.5 ± 0.1 3.4 ± 0.2 0.4 ± 0.0 2.9 ± 0.2 0.2 ± 0.0
0.50-0.75 3.9 ± 0.1 0.5 ± 0.0 4.3 ± 0.1 0.4 ± 0.0 2.7 ± 0.3 0.3 ± 0.0
0.75-1.00 4.4 ± 0.2 0.5 ± 0.0 2.3 ± 0.1 0.3 ± 0.0 2.4 ± 0.1 0.1 ± 0.0
1.00-1.50 2.9 ± 0.0 0.4 ± 0.0 1.2 ± 0.1 0.2 ± 0.0 3.1 ± 0.1 0.1 ± 0.0
1.50-2.00 2.3 ± 0.1 0.4 ± 0.1 1.2 ± 0.0 0.4 ± 0.1 2.8 ± 0.1 0.0 ± 0.0
Depth / m Stock / (Mg ha-1)
0.00-0.05 8.3 ± 0.2 0.7 ± 0.0 7.2 ± 0.2 0.5 ± 0.0 5.4 ± 0.9 0.4 ± 0.1
0.05-0.10 6.2 ± 0.8 0.5 ± 0.0 6.3 ± 0.5 0.6 ± 0.1 5.5 ± 0.1 0.5 ± 0.0
0.10-0.15 5.6 ± 0.2 0.5 ± 0.0 4.8 ± 0.3 0.5 ± 0.1 3.4 ± 0.5 0.3 ± 0.0
0.15-0.20 5.9 ± 0.4 0.6 ± 0.1 4.3 ± 0.1 0.4 ± 0.0 3.4 ± 0.1 0.4 ± 0.0
0.20-0.30 7.8 ± 0.4 0.8 ± 0.1 7.4 ± 0.3 0.8 ± 0.0 5.0 ± 0.5 0.7 ± 0.0
0.30-0.40 7.7 ± 0.0 0.8 ± 0.0 6.6 ± 0.2 0.7 ± 0.0 4.5 ± 1.4 0.6 ± 0.0
0.40-0.50 7.3 ± 0.6 0.9 ± 0.1 5.3 ± 0.3 0.7 ± 0.0 5.6 ± 0.9 0.8 ± 0.1
0.50-0.75 16.7 ± 0.5 2.1 ± 0.1 18.0 ± 0.5 1.8 ± 0.1 10.8 ± 1.6 1.7 ± 0.1
0.75-1.00 16.5 ± 0.5 2.0 ± 0.1 9.6 ± 0.4 1.2 ± 0.0 8.9 ± 0.5 1.8 ± 0.0
1.00-1.50 23.3 ± 0.6 3.6 ± 0.3 10.0 ± 0.6 2.1 ± 0.0 27.1 ± 0.5 5.4 ± 0.2
1.50-2.00 19.9 ± 1.2 3.4 ± 0.4 10.3 ± 0.2 3.1 ± 0.7 24.1 ± 0.1 4.8 ± 0.3
0.00-2.00a 125.2 15.8 89.7 12.4 103.6 17.4
at 1.00-150 and 1.50-2.00 m depths Csoil stocks were
171 and 134% greater in BRA compared to NAF. These findings corroborate recent literature where translocation of organic compounds from upper to deeper soil depths after vegetation burning was suggested to be facilitated by the sandy character of the soil.32 In our study, the
high sand content along the soil profile (Table 1) and the high preciptation rates commonly observed in the region of the study (Figure 2) may have favored the leaching of organic material to deeper depths. Apparently, the C translocated accumulated in sand and silt compartments preferently, as suggested by the proportional C distribution in sand, silt and clay fractions, which will be better discussed in “Distribution of carbon in physical fractions” sub-section.
Even though Csoil stocks (0.00-2.00 m depth) in the
fire-affected areas, BAF and BRA, were 35.5 and 13.9 Mg ha-1
superior than that of the NAF area, respectively, it is important to take into account the C emitted to the atmosphere at the time of forest burning (74.3 Mg ha-1),22
which turns the aboveground + belowground C balance in BRA and BAF negative in comparison to NAF. Nevertheless, C accumulation in post-fire (BRA and BAF) and native (NAF) growing vegetations as well as SOM dynamics should be further investigated to provide precise estimations of total C balance in these areas.
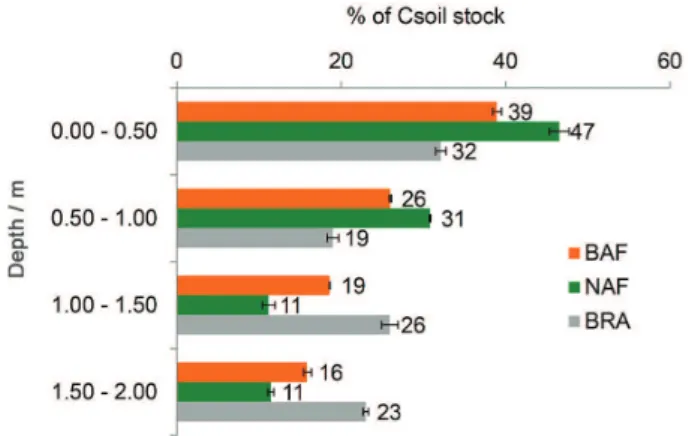
The slash-and-burn of AF and its convertion to pasture affected not only Csoil contents and stocks, but C
distribution along the soil profile as well. The contribution of the 0.00-1.00 m soil depth to the Csoil stock was more
relevant in NAF (78%) than in BAF (65%) and BRA (51%) (Figure 3), while the contribution of deeper depths (1.00-2.00 m) to Csoil stock was greater in BRA (49%) than in
BAF (35%) and NAF (22%) (Figure 3). These findings suggest that after AF fire the contribution of deeper depths to the Csoil stock proportionally increases, possibly due to
the translocation of C from upper depths and its deposition at deeper depths. Moreover, our study indicates that the contribution of deeper depths to the Csoil stock is even higher
if the burned AF area is converted to pasture instead of being left under natural regeneration. This can be attributed to a triple effect of: (i) depletion of C derived from the AF; (ii) low C deposition on the suface of the soil under pasture; (iii) downwards translocation and accumulation of C at deep depths.
In NAF, BAF and BRA areas, more than 50% of Csoil
stock was observed below 0.50 m depth, highlighting the importance to assess deep C stocks to elucidate the SOM dynamics and especially the C balance in soils after anthropogenic interferences, such as forest burning and post-fire land use.
Chemical composition of SOM assessed by 13C NMR
The solid-state 13C NMR spectra of soil samples
collected at 0.00-0.05 and 0.05-0.10 m depths in BAF, NAF and BRA areas showed similar pattern (Figure 4). However, the intensity of the chemical shift regions varied considerably (Table 3).
All spectra were dominated by the signal intensity in the chemical shift region of O-alkyl C, 31-45% (Table 3), corroborating similar studies comparing SOM composition of soils under forest and grassland subjected to fire.32-34
The O-alkyl C is commonly attributed to carbohydrates from microbial biomass and plant residues, considered biochemically labile organic matter compounds.35,36 The
most pronounced contrast regarding O-alkyl C chemical shift region was observed at 0.05-0.10 m depth, where O-alkyl C contribution to Csoil was substantially higher
in BRA (45%) than in BAF (34%) and NAF (31%) areas (Table 3). The massive root system of Brachiaria plants within the first soil depths probably contributed to a relative enrichment in chemically labile compounds, such as O-alkyl C structures. Two years of forest regeneration in BAF, promoting input of labile organic compounds to the soil, probably masked more remarkable effects of fire on O-alkyl structures depletion. On one hand, O-alkyl compounds in soils are easily depleted by fire, but on the other hand its contribution to Csoil can be rapidly recovered
after fire if fresh organic compounds are added to the soil by the post-fire growing vegetation.32,37
Commonly, shortly after fire the contribution of aryl C structures to SOM near to the soil surface tends to increase considerably due to the incorporation of PyC. However, although a slightly higher aryl C contribution to Csoil at both
0.00-0.05 and 0.05-0.10 m depths is observed in BAF and BRA compared to NAF, the typical pattern of pyrogenic
organic matter is still not clearly evident. Possibly, the input of new litter from the rapid growing post-fire vegetation masked the contribution of PyC or the latter has been lost either by leaching or by degradation. For the first, evidences that this can occur have been reported from the Cerrado biome.38 The latter has been observed in Atlantic
Forest (Brazil) and Amazon biomes39,40 and is assumed to
be responsible for the fast recovery of Mediterranean soils after forest fires.41 The favorable conditions for microbial
degradation under the warm and humid conditions in the experimental region (Figure 2) could have enhanced the complete or partial degradation of pyrogenic organic matter, and the leaching of the pyrogenic compounds may have been favored due to the high precipitation rates after burning (Figure 2) and to the sandy character of the soil (Table 1). Jimenez-Gonzalez et al.11 reported similar
results when comparing aryl C contributions to Csoil
within 0.00-0.10 m depth in a Cambisol under unburnt Mediterranean Forest (18-19%) and two years after burning of the forest (24-20%).
The combination of labile organic matter input and possible leaching and degradation of pyrogenic organic matter (more aromatic and hydrophobic) in BAF and BRA most probably attenuated the hydrophobic character of the
SOM in these areas, as supported by the similar HI index observed in these areas in comparison to the undisturbed forest site (NAF), regardless the soil depth (Table 3).
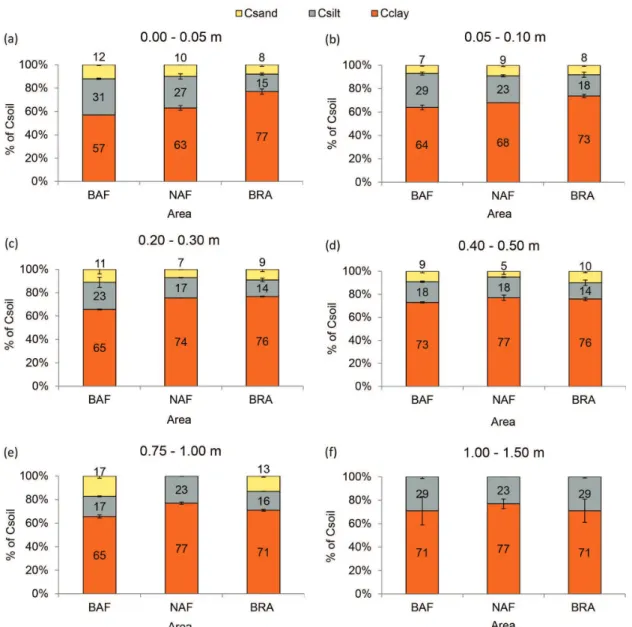
Distribution of carbon in physical fractions
The Csand contents varied from 1.8 to 12.7 g kg-1 along
the soil profile in BAF area, from 1.1 to 9.9 g kg-1 in NAF
and from 1.1 to 5.7 g kg-1 in BRA (Table 4). Even though
sand is the predominant fraction of the studied Acrisol (Table 1), Csand contribution to Csoil content was low (< 17%,
Figure 5).
In the BAF area, Csilt contents ranged from 2.7 to
31.4 g kg-1, and were greater than those observed in NAF
(2.1 to 27.8 g kg-1) and BRA (1.4 to 11.6 g kg-1) (Table 4).
Although silt content is greater than clay content, mainly up to 0.50 m depth (Table 1), Cclay/Csoil values (57-77%) were
substantially greater than Csilt/Csoil (14-31%) along the soil
profiles (Figure 5). In general, Cclay contents were greater in
NAF (7.2 to 65.5 g kg-1) and similar between BAF (8.8 to
58.6 g kg-1) and BRA (6.6 to 57.6 g kg-1) (Table 4). These
findings highlight the role of organo-mineral interactions as a mechanism for organic matter protection, particularly interactions with clay, due to its greater surface area in comparison to sand and silt.19,42,43
The most outstanding difference on Csand content was
observed at 0.00-0.05 m, where values decreased in the order: BAF > NAF > BRA (Table 4). Greater accumulation of C in coarse fractions in areas under forest can be expected, once plant residues deposited on forested soils tend to be coarser than residues of pasture. In fact, as mentioned in the “Experimental” section, nearly 85% of the plants cut and burned were trees with DBH > 10 cm. Furthermore, the exportation of fresh biomass by livestock in BRA may have disfavored accumulation of Csand.
The biochemical recalcitrance of organic molecules is the main stabilization mechanism of Csand, and therefore,
this fraction is usually more sensitive to changes on soil use
Figure 4.13C NMR spectra of organic matter from 0.00-0.05 and
0.05-0.10 m depths of an Acrisol under burned Amazon Forest (BAF), native Amazon Forest (NAF) and Brachiaria pasture (BRA).
Table 3. Proportional distribution of carbon functional groups obtained by 13C NMR CPMAS and hydrophobicity index (HI) at 0.00-0.05 and 0.05-0.10 m depths of an Acrisol under burned Amazon Forest (BAF), native Amazon Forest (NAF) and Brachiaria pasture (BRA). Values were obtained from composite samples
Depth / m Area Carboxyl C / % Aryl C / % O-Alkyl C / % N-Alkyl C / % Alkyl C / % HIa
0.00-0.05
BAF 9.3 17.5 35.2 9.3 28.7 1.0
NAF 12.4 14.1 37.4 9.4 26.7 0.8
BRA 13.9 17.6 38.0 7.8 22.8 0.8
0.05-0.10
BAF 7.9 11.6 34.1 11.0 35.5 1.1
NAF 16.4 9.2 31.4 8.7 34.4 0.9
BRA 7.6 15.4 44.9 9.1 22.9 0.7
and management than mineral-associated C fractions, as Csilt and Cclay.42 The higher Csand content in BAF compared
to NAF is possibly associated to the fast regeneration of the forest after fire and to the addition of labile C to the soil. In this direction, d’Oliveira et al.44 estimated
aboveground biomass accumulation rate between 7.5 and 15.0 Mg ha-1 year-1 for secondary forest under natural
regeneration after AF fire. Since the C/N ratios of Csand
in BAF (< 18) are not typical of pyrogenic material and are similar to that of NAF and BRA, especially up to 0.10 m depth, the greater Csand content in BAF than in
NAF and BRA, observed mainly at 0.00-0.05 m depth, is not attributed to the accumulation of sand-size pyrogenic fragments, which due to its chemical recalcitrance, would persist in soil longer than non-pyrogenic compounds.45
Along the soil profiles of BAF and NAF, Csilt contents
were similar. However, at 0.05-0.10 m depth, Csilt in
BAF (21.6 g kg-1) was consistently higher than in NAF
(15.1 g kg-1), contributing to 29 and 23% of the C
soil content,
respectively. Considering that Csoil contents of BAF and
NAF were similar at this depth, these findings suggest that redistribution of C in soil fractions after forest burning may have occurred, promoting C enrichment in silt fraction in BAF area. Overall, BAF and NAF presented higher Csilt
and Nsilt contents in comparison to BRA, especially up to
0.30 m depth. As previously discussed for Csand content, this
may result from the incorporation of greater amounts of labile C to the soils in NAF and BAF, as indicated by the higher C/N values of silt fraction along the soil profile in NAF and BAF in comparison to BRA (Table 4).
Except at 0.05-0.10 and 1.50-2.00 m depths, where Cclay
content in BAF was higher than in NAF, Cclay content was
considerably higher in NAF, mainly within 0.00-0.30 m depth. It seems that vegetation burning altered the dynamics of C accumulation in clay, most probably due to the change on Cclay retention capacity in BAF. Analogous to Csand, Nsand,
Csilt and Nsilt contents, Cclay and Nclay contents tended to be
lower along the BRA soil profile, except at 0.00-0.05 m depth, where Cclay and Nclay in BRA were comparable to
those in BAF (Table 4).
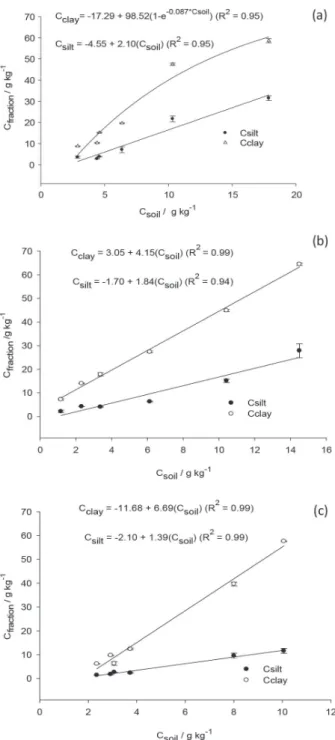
Carbon retention capacity of clay and silt fractions
The determination coefficients (R2) for the relationship
between Csoil and Csilt (0.94-0.99) or Cclay contents
(0.95-0.99) were high (Figure 6). In NAF and BRA areas, both Csilt and Cclay contents showed a linear relationship
with Csoil content, indicating that saturation of C retention Table 4. Carbon and nitrogen contents in sand (Csand, Nsand), silt (Csilt, Nsilt) and clay (Cclay, Nclay) and C/N ratio in these fractions along the profile of an Acrisol under burned Amazon Forest (BAF), native Amazon Forest (NAF) and Brachiaria pasture (BRA) (values are means ± standard deviation)
Area Depth / m
Sand Silt Clay
Csand / (g kgfraction-1)
Nsand / (g kgfraction-1)
C/N Csilt / (g kgfraction-1)
Nsilt / (g kgfraction-1)
C/N Cclay / (g kgfraction-1)
Nclay / (g kgfraction-1)
C/N
BAF
0.00-0.05 12.7 ± 0.5 0.9 ± 0.0 14.1 31.4 ± 1.1 2.3 ± 0.1 13.7 58.6 ± 1.0 5.9 ± 0.2 9.9 0.05-0.10 5.2 ± 0.6 0.4 ± 0.1 13.0 21.6 ± 1.3 1.6 ± 0.2 13.5 47.6 ± 0.6 5.0 ± 0.3 9.5 0.20-0.30 3.4 ± 1.1 0.3 ± 0.1 11.3 7.1 ± 1.4 0.6 ± 0.1 11.8 19.7 ± 0.1 2.3 ± 0.1 8.6 0.40-0.50 1.8 ± 0.3 0.1 ± 0.0 18.0 3.7 ± 0.2 0.4 ± 0.0 9.3 15.2 ± 0.2 2.0 ± 0.0 7.6 0.75-1.00 2.7 ± 0.3 0.2 ± 0.0 13.5 2.7 ± 0.0 0.3 ± 0.0 9.0 10.3 ± 0.2 1.5 ± 0.0 6.9
1.00-1.50 ND ND – 3.5a 0.4a 8.8 8.8a 1.4a 6.3
NAF
0.00-0.05 9.9 ± 0.1 0.7 ± 0.0 14.1 27.8 ± 2.9 2.2 ± 0.3 12.6 64.5 ± 0.5 6.6 ± 0.0 9.8 0.05-0.10 6.3 ± 0.6 0.5 ± 0.1 12.6 15.1 ± 0.8 1.3 ± 0.0 11.6 44.8 ± 0.5 4.9 ± 0.0 9.1 0.20-0.30 3.2 ± 0.0 0.3 ± 0.0 10.7 6.3 ± 0.2 0.6 ± 0.0 10.5 27.4 ± 0.4 3.2 ± 0.0 8.6 0.40-0.50 1.1 ± 0.7 0.1 ± 0.1 11.0 4.0 ± 0.2 0.4 ± 0.0 10.0 17.8 ± 0.7 2.3 ± 0.2 7.7
0.75-1.00 ND ND – 4.2 ± 0.0 0.4 ± 0.0 10.5 14.0 ± 0.1 1.7 ± 0.0 8.2
1.00-1.50 ND ND – 2.1 ± 0.5 0.2 ± 0.0 10.5 7.2 ± 0.4 1.5 ± 0.0 4.8
BRA
0.00-0.05 5.7 ± 1.2 0.4 ± 0.1 14.3 11.6 ± 1.0 0.9 ± 0.1 12.9 57.6 ± 0.2 6.3 ± 0.0 9.1 0.05-0.10 5.0 ± 0.5 0.4 ± 0.1 12.5 9.5 ± 1.2 0.8 ± 0.1 11.9 39.6 ± 0.8 4.7 ± 0.0 8.4 0.20-0.30 1.5 ± 0.3 0.2 ± 0.1 7.5 2.3 ± 0.3 0.3 ± 0.0 7.7 12.4 ± 0.4 2.0 ± 0.0 6.2 0.40-0.50 1.2 ± 0.1 0.2 ± 0.1 6.0 1.8 ± 0.3 0.2 ± 0.1 9.0 9.7 ± 0.1 1.8 ± 0.0 5.4 0.75-1.00 1.1 ± 0.1 0.2 ± 0.0 5.5 1.4 ± 0.0 0.3 ± 0.0 4.7 6.1 ± 0.1 1.3 ± 0.0 4.7
1.00-1.50 ND ND – 2.6 ± 0.0 0.4 ± 0.0 6.5 6.3 ± 0.8 1.3 ± 0.1 4.8
sites was experimentally not evidenced (Figures 6b and 6c). Similar linear relationship was found between Csoil
and Csilt contents in BAF area. These data are in line
with previous findings described by Diekow et al.,46 who
reported a linear relationship of Csilt and Csoil contents at
0.00-0.025 and 0.025-0.075 m depths in an Acrisol under no-tillage system. According to the authors, the presence of particulate organic matter in the silt fraction may have contributed to the increment of C in this fraction, but not to the saturation of C retention sites, resulting in a theoretically infinite capacity of C retention in the silt compartment.
Contrastingly, the relation between Csoil and Cclay
contents in BAF area showed an exponential behavior tending to saturation (Figure 6a) and the maximum Crc in
clay fraction was estimated from the equation in Figure 6a as 81 g kg-1. Reis et al.,19 using the same approach,
obtained lower values for maximum Crc for two heavy
clayey Brazilian subtropical Oxisols (25 to 72 g kg-1) under
different soil management systems. The comparatively higher Crc value observed in our study can be attributed
to the substantially lower Csoil content in BAF compared
to that observed by the authors in the Oxisol. Usually, Crc
is inversely related to the Csoil content, i.e., Crc decreases
(assymptotically) to increasing C inputs to the soil.47
From the values of maximum Crc and Cclay (in each soil
depth), Csd of clay fraction in BAF was predicted as follows
(values are mean ± standard deviation): 22.4 ± 1.0 g kg-1 at
0.00-0.05 m depth; 33.5 ± 0.6 g kg-1 at 0.05-0.10 m depth;
0.40-0.50 m depth; 70.7 ± 0.2 g kg-1 at 0.75-1.00 m depth;
and 72.2 ± 0.1 g kg-1 at 1.00-1.50 m depth.
Despite the higher Cclay content observed in NAF than
in BAF in most soil depths, C saturation in NAF was not experimentally reached. The higher Cclay content in NAF
does not necessarily implies in a higher number of mineral sorptive sites occupied by organic molecules. In fact, in natural systems under equilibrium conditions, as in NAF, the
constant input of organic material and the non-disturbance of the soil stimulate the auto-association of functional groups of the organic matter, as illustrated by the zonal model of organo-mineral interactions proposed by Kleber et al.48 In
this way, a portion of Cclay content in NAF is attributed not
to the direct bonding of organic matter to the mineral matrix, but instead to organic matter-organic matter (OM-OM) interactions. Consequently, sites of C retention remain available and tendency of saturation is not observed.
In BAF, the saturation behavior of Cclay may be assigned to
the effect of fire on OM-OM associations and on clay surface area. Alterations on SOM composition due to fire possibly interrupted multilayer OM-OM interactions. Furthermore, soil heating may have affected clay physically, reducing its surface area and consequently the mineral sites available for interaction with organic compounds. Accordingly, Pérez et al.49 observed soil temperatures near to 360 °C at soil surface during a controlled burning of AF (similar to our study). Assuming that comparable soil heating occurred in our studied area, a decrease in clay surface area could be expected. Decrease in kaolinite and gibbsite contents as well as increase in coarser particle fractions content were reported from an Oxisol after vegetation slash-and-burn, when soil was exposed to 300 °C or higher temperatures.50 However,
these hypotheses need further investigation.
The C depletion along 23 years after the conversion of AF to pasture may have induced C mineral retention sites to become available, and therefore C saturation in silt and clay was not observed in BRA area.
Conclusions
Amazon Forest slash-and-burn either followed by two years of natural regeneration or 23 years of continuous pasture incremented total soil carbon stocks within 0.00-2.00 m depth compared to the native Amazon Forest soil. However, taking into account the carbon emitted to the atmosphere at the time of forest burning, the fire-affected soils show a negative carbon balance compared to the native area, although further investigations should be conducted to elucidate soil-aboveground biomass-atmosphere carbon net under these conditions.
Soil organic matter aromaticity and hydrophobicity indexes at surface soil depths (0.00-0.05 and 0.05-0.10 m) of fire-affected soils was similar to that of native forest. Generally, shortly after fire organic matter aromaticity tends to increase near to the soil surface. This fire effect on organic matter was not clearly evidenced in this study, probably due to the years passed since fire event and to the addition of new fresh biomass to the soil, either from natural forest regeneration or from pasture.
Figure 6. Relation of carbon content in silt (Csilt) and clay (Cclay) fractions with total carbon content (Csoil) in an Acrisol under (a) burned Amazon Forest; (b) native Amazon Forest and (c) Brachiaria pasture. Bars are
Fire affected the dynamics of carbon accumulation along the soil profile. While at 0.00-1.00 m depth soil carbon stock proportion was greater in the native Amazon Forest area, at 1.00-2.00 m depth carbon proportion was greater in the fire-affected soils. These findings were attributed to a combined effect of: (i) carbon depletion at upper soil depths due to fire; (ii) aboveground vegetation change (especially in the pasture area); (iii) carbon migration to deeper depths in the fire-affected soils, which was probably accentuated due to the high precipitation rates commonly observed in the experimental region and to the sandy character of the soil.
The carbon accumulation in particle size fractions along the Acrisol profile was altered by fire and conversion of forest to pasture. Carbon saturation was experimentally observed in the burned Amazon Forest area and was assigned to impacts of fire on organic matter composition and soil particle size distribution, which may have modified soil organomineral interactions.
Overall, this study was pioneer in Acre State and highlights the effect of Amazon Forest fire on carbon retention potential and on organic matter composition of an Acrisol, the second most representative soil type of Amazon region (33%). We consider that studies on organic matter composition in physical compartments and the effect of heating (under natural conditions) on minerals specific area, particularly clay, merit further investigations and will strongly contribute to elucidate the mechanisms of carbon accumulation in fire-affected soils from the Amazon region.
Acknowledgments
Dr Leal thanks the Brazilian National Council for Scientific and Technological Development (CNPq) and the Coordination for the Improvement of Higher Education Personnel for the PhD and PhD-sandwich (CAPES-PDSE) scholarships, respectively, and the Alexander von Humboldt Foundation for the “Return Fellowship” grant provided which supported this work. The authors thank Mr Antônio Abel dos Santos and Mr Ramilde dos Santos Oliveira for permitting soil sampling into their private farms and for providing information on the history of land use and management.
This work was supported by the São Paulo Research Foundation (FAPESP, thematic project number 08/04490-4); and CNPq (project CT-Amazônia number 575795/2008-5).
References
1. http://www.inpe.br/queimadas, accessed on July 30, 2017.
2. http://www.inpe.br/queimadas, accessed on February 18, 2015. 3. Fearnside, P. M.; Conserv. Biol. 2005, 19, 680.
4. Almeida, C. A.; Coutinho, A. C.; Equerdo, J. C. D. M.; Adami, M.; Venturieri, A.; Diniz, C. G.; Dessay, N.; Durieux, L.; Gomes, A. R.; Acta Amazonica2016, 46, 291.
5. Luizão, F. J.; Fearnside, P. M.; Cerri, C. E. P.; Lehmann, J. In
Amazonia and Global Change, 1st ed.; Keller, M.; Bustamante,
M.; Gash, J.; Dias, P. S., eds.; American Geophysical Union: Washington, USA, 2009, p. 311.
6. Fearnside, P. M. In Conservação da Biodiversidade em Paisagens Antropizadas do Brasil, 1a ed.; Peres, C. A.; Gardner,
T. A.; Barlow, J.; Vieira, I. C. G., eds.; Editora da Universidade Federal do Paraná: Curitiba, Brazil, 2013, ch. 3, p. 29-62. 7. Fearnside, P. M.; Reg. Environ. Change2018, 18, 47.
8. Roscoe, R.; Buurman, P.; Velthorst, E. J.; Pereira, J. A. A.;
Geoderma2000, 95, 141.
9. Johnson, D. W.; Curtis, P. S.; For. Ecol. Manage.2001, 140, 227.
10. Santín, C.; Knicker, H.; Fernández, S.; Menéndez-Duarte, R.; Álvarez, M. A.; Catena 2008, 74, 286.
11. Jimenez-Gonzalez, M. A.; De La Rosa, J. M.; Jimenez-Morillo, N. T.; Almendros, G.; González-Perez, J. A.; Knicker, H.; Sci. Total Environ.2016, 572, 1414.
12. Knicker, H.; González-Vila, F. J.; Polvillo, O.; González, J. A.; Almendros, G.; Soil Biol. Biochem.2005, 37, 701.
13. Knicker, H.; Nikolova, R.; Dick, D. P.; Dalmolin, R. S. D.;
Geoderma2012, 181-182, 11.
14. Bird, M. I.; Wynn, J. G.; Saiz, G.; Wurster, C. M.; McBeath, A.; Annu. Rev. Earth Planet. Sci. 2015, 43, 273.
15. Koele, N.; Bird, M.; Haig, J.; Marimon-Junior, B. H.; Marimon, B. S.; Phillips, O. L.; Oliveira, E. A.; Quesada, C. A.; Feldpausch, T. R.; Geoderma2017, 306, 237.
16. Knicker, H.; Biogeochemistry2007, 85, 91.
17. Stewart, C. E.; Paustian, K.; Conant, R. T.; Plante, A. F.; Six, J.; Soil Biol. Biochem.2008, 40, 1741.
18. Diekow, J.; Bayer, C.; Conceição, P. C.; Zanatta, J. A.; Martin-Neto, L.; Milori, D. M. B. P.; Salton, J. C.; Macedo, M. M.; Mielniczuk, J.; Hernani, L. C.; Eur. J. Soil Sci.2009, 60, 240.
19. Reis, C. E. S.; Dick, D. P.; Caldas, J. S.; Bayer, C.; Sci. Agric. 2014, 71, 259.
20. Nicoloso, R. S.; Rice, C. W.; Amado, T. J. C.; Soil Sci. Soc. Am. J.2016, 80, 147.
21. Ministério da Agricultura, Pecuária e Abastecimento (MAPA);
Plano Setorial de Mitigação e de Adaptação às Mudanças
Climáticas para a Consolidação de Uma Economia de Baixa
Emissão de Carbono na Agricultura, 1a ed.; MAPA/ACS:
Brasília, Brazil, 2012.
M. B.; Santos, J. C.; Lima, B. A.; Cascão, P.; Ortega, G.; Frade Jr., E. F.; Atmos. Environ.2016, 135, 73.
23. Alvares, C. A.; Stape, J. L.; Sentelhas, P. C.; Gonçalves, J. L. M.; Sparovek, G.; Meteorol. Z.2013, 22, 711.
24. Empresa Brasileira de Pesquisa Agropecuária (Embrapa);
Sistema Brasileiro de Classificação de Solos, 2a ed.; Embrapa:
Brasília, Brazil, 2006.
25. IUSS Working Group WRB; World Soil Resources Reports No. 106: World Reference Base for Soils Resources 2014, Update
2015, International Soil Classification System for Naming Soils
and Creating Legends for Soil Maps; Food and Agriculture Organization of the United Nations (FAO): Rome, Italy, 2015. 26. Ellert, B. H.; Bettany, J. R.; Can. J. Soil Sci.1995, 75, 529. 27. Angers, D. A.; Arrouays, D.; Saby, N. P. A.; Walter, C.; Soil
Use Manage.2011, 27, 448.
28. Gonçalves, C. N.; Dalmolin, R. S. D.; Dick, D. P.; Knicker, H.; Klamt, E.; Kögel-Knaber, I.; Geoderma2003, 116, 373. 29. Knicker, H.; Org. Geochem.2011, 42, 867.
30. Abelmann, K.; Kleineidam, S.; Knicker, H.; Grathwohl, P.; Kögel-Knabner, I.; J. Plant Nutr. Soil Sci.2005, 168, 293.
31. Araújo, E. A.; Ker, J. C.; Mendonça, E. S.; Silva, I. R.; Oliveira, E. K.; Acta Amazonica2011, 41, 103.
32. Alexis, M. A.; Rasse, D. P.; Knicker, H.; Anquetil, C.; Rumpel, C.; Geoderma2012, 189-190, 98.
33. Potes, M. L.; Dick, D. P.; Santana, G. S.; Tomazi, M.; Bayer, C.; Pesqui. Agropecu. Bras.2012, 47, 707.
34. Shiau, Y. J.; Chen, J. S.; Chung, T. L.; Tian, G.; Chiu, C. Y.;
Bot. Stud.2017, 58, 23.
35. Baldock, J. A.; Oades, J. M.; Waters, A. G.; Peng, X.; Vassalo, A. M.; Wilson, M. A.; Biogeochemistry1992, 16, 1.
36. Knicker, H.; González-Vila, F. J.; González-Vásquez, R.; Soil Biol. Biochem.2013, 56, 31.
37. González-Pérez, J. A.; González-Vila, F. J.; Almendros, G.; Knicker, H.; Environ. Int.2004, 30, 855.
38. Velasco-Molina, M.; Berns, A. E.; Macías, F.; Knicker, H.;
Geoderma 2016, 262, 62.
39. Dittmar, T.; Rezende, C. E.; Manecki, M.; Neggemann, J.; Ovalle, A. R. C.; Stubbins, A.; Bernardes, M. C.; Nat. Geosci. 2012, 5, 618.
40. Turcios, M. M.; Jaramillo, M. M. A.; do Vale, J. F.; Fearnside, P. M.; Barbosa, R. I.; Global Change Biol. 2016, 22, 190. 41. López-Martín, M.; Velasco-Molina, M.; Knicker, H.; J. Soils
Sediments2016, 16, 360.
42. Six, J.; Conant, R. T.; Paul, E. A.; Paustian, K.; Plant Soil2002, 241, 155.
43. Zinn, Y. L.; Lal, R.; Resck, D. V. S.; Soil Sci. Soc. Am. J.2007, 71, 1204.
44. d’Oliveira, M. V. N.; Alvarado, E. C.; Santos, J. C.; Carvalho Jr., J. A.; For. Ecol. Manage. 2011, 261, 1490.
45. Santín, C.; Doerr, S. H.; Preston, C. M.; González-Rodríguez, G.; Global Change Biol.2015, 21, 1621.
46. Diekow, J.; Mielniczuk, J.; Knicker, H.; Bayer, C.; Dick, D. P.; Kögel-Knabner, I.; Plant Soil 2005, 268, 319.
47. Stewart, C. E.; Paustian, K.; Conant, R. T.; Plante, A. F.; Six, J.; Soil Biol. Biochem.2009, 41, 357.
48. Kleber, M.; Sollins, P.; Sutton, R.; Biogeochemistry2007, 85,
9.
49. Pérez, J. J. M.; Fostier, A. H.; Carvalho Jr., J. A.; Windmöller, C. C.; Santos, J. C.; Carpi, A.; Atmos. Environ.2014, 96, 415.
50. Ketterings, Q. M.; Bigham, J. M.; Laperche, V.; Soil Sci. Soc. Am. J.2000, 64, 1108.
Submitted: June 27, 2018
Published online: September 26, 2018