André Fonseca dos Santos Dias Vieira
Licenciatura Engenharia Informática
Context-Aware Personalization Environment for
Mobile Computing
Dissertação para obtenção do Grau de Mestre em Engenharia Informática
Orientador : Nuno Manuel Robalo Correia, Prof. Catedrático, Facul-dade de Ciências e Tecnologia - UniversiFacul-dade Nova de Lisboa
Júri:
Presidente: Doutor José Augusto Legatheaux Martins
Arguente: Doutora Ana Paula Pereira Afonso
iii
Context-Aware Personalization Environment for Mobile Computing
Copyright cAndré Fonseca dos Santos Dias Vieira, Faculdade de Ciências e Tecnologia,
Universidade Nova de Lisboa
Acknowledgements
Abstract
Currently, we live in a world where the amount of on-line information vastly outstrips any individual’s capability to survey it. Filtering that information in order to obtain only useful and interesting information is a solution to this problem.
The mobile computing area proposes to integrate computation in users’ daily activi-ties in an unobtrusive way, in order to guarantee an improvement in their experience and quality of life. Furthermore, it is crucial to develop smaller and more intelligent devices to achieve this area’s goals, such as mobility and energy savings. This computing area reinforces the necessity to filter information towards personalization due to its human-centred paradigm.
In order to attend to this personalization necessity, it is desired to have a solution that is able to learn the users preferences and needs, resulting in the generation of profiles that represent each style of interaction between a user and an application’s resources (e.g. buttons and menus). Those profiles can be obtained by using machine learning algorithms that use data derived from the user interaction with the application, combined with context data and explicit user preferences.
This work proposes an environment with a generic context-aware personalization model and a machine learning module. It is provided the possibility to personalize an application, based on user profiles obtained from data, collected from implicit and ex-plicit user interaction. Using a provided personalization API (Application Programming Interface) and other configuration modules, the environment was tested on LEY (Less en-ergy Empowers You), a persuasive mobile-based serious game to help people understand domestic energy usage.
Keywords: Generic Personalization Model, User Profiles, Mobile Computing,
Resumo
Atualmente, a quantidade de informação on-line supera a capacidade dos utilizado-res a assimilarem. Filtrar essa informação de modo a obter conteúdo útil e relevante é uma solução para o problema.
A computação móvel propõe integrar computação nas atividades diárias dos utiliza-dores de forma não obtrusiva, com o intuito de garantir uma melhoria na sua experiên-cia e qualidade de vida. É cruexperiên-cial desenvolver dispositivos mais pequenos e inteligentes para atingir os objectivos de poupança energética e mobilidade. Dadas estas limitações tecnológicas, é reforçada a necessidade de filtrar informação em direção à personalização, devido ao seu paradigma centrado no utilizador.
Deseja-se uma solução que considere as necessidades e preferências de cada utiliza-dor, de modo a gerar perfis representativos de cada estilo de interação entre o utilizador e recursos de uma aplicação (e.g. botões e menus). Estes perfis podem ser obtidos com a utilização de algoritmos de aprendizagem automática que usem dados advindos das interações do utilizador.
É proposto um ambiente baseado num modelo genérico de personalização sensível a contexto. Tem como objetivo personalizar uma aplicação de forma não obtrusiva, com base em perfis de utilizador. Estes perfis são gerados por algoritmos de aprendizagem automática que usam dados recolhidos através da interação explícita e implícita entre o utilizador e a aplicação. Usando uma interface de programação e outros módulos de configuração, o ambiente de personalização foi testado na aplicação LEY (Less energy Empowers You), um jogo sério persuasivo para dispositivos móveis, cujo intuito é cons-ciencializar as pessoas acerca do seu consumo energético doméstico.
Palavras-chave: Modelo de Personalização Genérico, Perfis de Utilizador, Computação
Contents
1 Introduction 1
1.1 Motivation . . . 2
1.2 Description and Context . . . 3
1.3 Presented Solution . . . 3
1.4 Contributions . . . 4
1.5 Document Structure . . . 5
2 Related Work 7 2.1 Machine Learning . . . 7
2.1.1 Recommender Systems . . . 8
2.1.2 Clustering . . . 9
2.1.3 Distance Measures . . . 11
2.1.4 Clustering methods . . . 13
2.2 Context . . . 15
2.2.1 Notions and Modelling . . . 16
2.2.2 Identifying Context Data . . . 17
2.2.3 Techniques of Context Incorporation. . . 17
2.2.4 Flexibility . . . 17
2.3 Services and Software Analysis . . . 18
2.3.1 Apache Mahout . . . 18
2.3.2 Weka . . . 21
2.3.3 Contextual Tools . . . 24
2.4 Related Projects . . . 25
2.4.1 Personalization of Applications . . . 25
2.4.2 Clustering and Context Related Projects . . . 27
3 CAPE 29 3.1 Concept and Notions . . . 29
3.2.1 User Credentials . . . 32
3.2.2 Personalization . . . 32
3.2.3 Parameters. . . 35
3.2.4 External Services . . . 37
3.2.5 Resources . . . 37
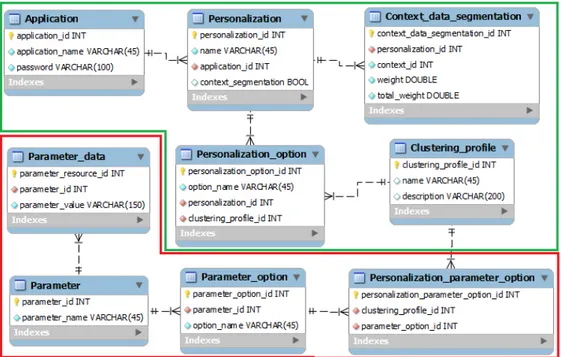
3.3 Personalization Data model . . . 40
3.3.1 Application . . . 40
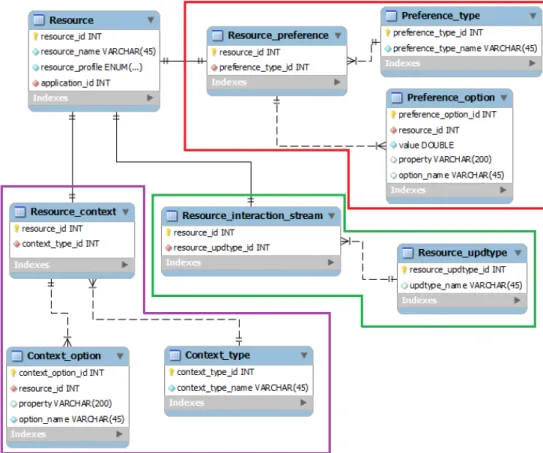
3.3.2 Users/Interaction. . . 46
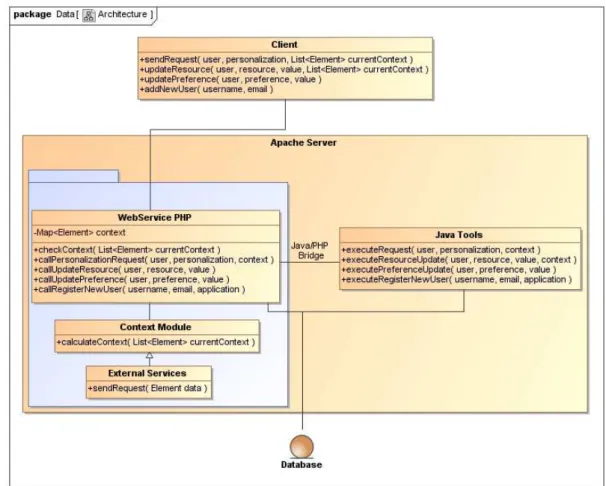
3.4 Architecture . . . 48
3.5 CAPE’s algorithms . . . 50
3.5.1 Personalization Request . . . 50
3.5.2 Other Operations . . . 54
3.5.3 Scripting Language Files. . . 56
4 Case Study - LEY 57 4.1 Introducing LEY. . . 57
4.1.1 Projects Related to LEY . . . 58
4.2 Personalization Applied to LEY . . . 58
4.2.1 House Icon . . . 59
4.2.2 First Menu . . . 60
4.2.3 Status Background Neighbourhood . . . 60
4.2.4 Alert Level Notifications . . . 63
4.3 Discussion . . . 64
5 Evaluation 65 5.1 Tests Based on LEY . . . 65
5.1.1 Evaluation . . . 65
5.1.2 Survey . . . 66
5.2 Tests Based on Other Applications . . . 67
6 Conclusions and Future Work 71 6.1 Conclusions . . . 71
6.2 Future Work . . . 72
A Appendix A - Personalization Data Model 79 B Appendix B - LEY Configuration File 81 C Appendix C - Evaluation 87 C.1 Tests Applied to LEY - Survey . . . 87
C.2 Tests Applied to LEY - Results. . . 91
List of Figures
2.1 Several points spread out . . . 10
2.2 Several points grouped in clusters . . . 11
2.3 DBSCAN: Red points arecore points, yellow points aredensity reachable from Aand blue points are considered as noise . . . 22
2.4 OPTICS handles different densities much better than DBSCAN . . . 23
3.1 Personalization, parameters and resources. . . 31
3.2 Root node of the XML file . . . 32
3.3 Definition of an application in the framework . . . 33
3.4 Definition of personalization instances to be used . . . 33
3.5 Definition of the usage of context in a personalization . . . 34
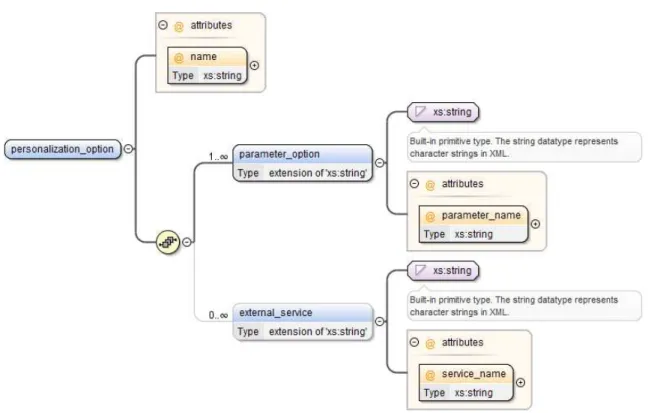
3.6 Definition of a personalization option . . . 36
3.7 Definition of all the used parameters with the formulas and parameter op-tions. . . 36
3.8 Definition of all the used external services . . . 38
3.9 Definition of all the used resources . . . 38
3.10 Personalization instances and parameters . . . 41
3.11 Resources. . . 43
3.12 External Services . . . 45
3.13 Data model of the users/interaction data . . . 47
3.14 CAPE architecture. . . 48
3.15 The main algorithm that calculates user profiles . . . 51
3.16 Array ordering . . . 53
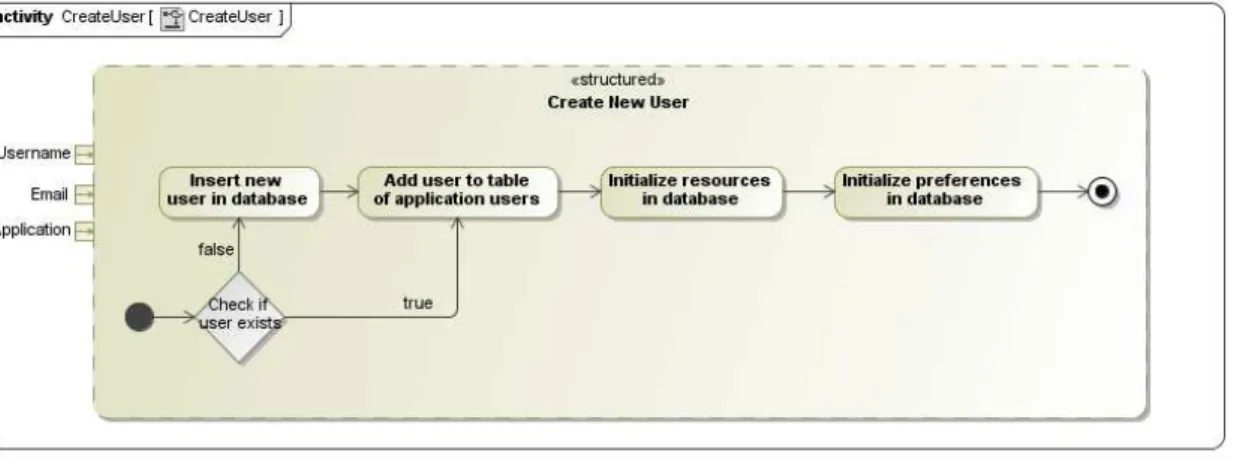
3.17 The algorithm to create new users . . . 54
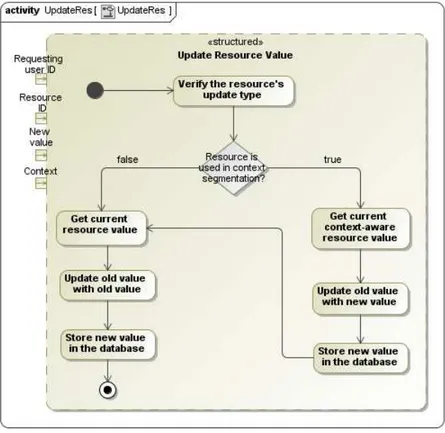
3.18 The algorithm that updates resource values . . . 55
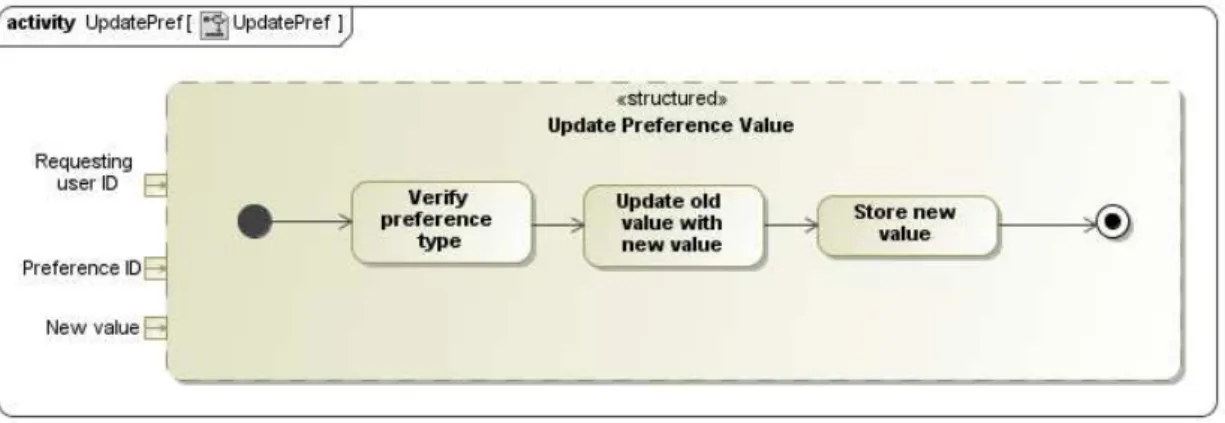
3.19 The algorithm that updates the user’s preferences . . . 56
4.2 Cloudy day, the house’s instant energy consumption is within average and
the user has a fearful profile . . . 61
4.3 Stormy day, the house’s instant energy consumption is above average and the user has a competitive profile . . . 62
4.4 Two alert messages in the alert message box. . . 64
A.1 The complete data model . . . 80
C.1 Inquiry applied to LEY - part 1 . . . 88
C.2 Inquiry applied to LEY - part 2 . . . 89
C.3 Inquiry applied to LEY - part 3 . . . 90
C.4 Inquiry applied to LEY - part 4 . . . 90
C.5 What is your area of expertise? . . . 91
C.6 For how long have you been working in that area? . . . 91
C.7 Have you ever used any tools or approach to integrate personalization into any of your applications? . . . 92
C.8 Do you consider intuitive the connection between personalization - pa-rameter - resource? . . . 92
C.9 How difficult was it to understand the configuration methodology for an application? . . . 93
C.10 How difficult was it to apply personalization to your application using CAPE methodology? . . . 93
C.11 How useful do you think is the notion of ’context’, for personalization pur-poses?. . . 94
C.12 Do you think there should be more types of external services? . . . 94
C.13 Limitations: steep learning curve of personalization model . . . 95
C.14 Limitations: personalization model expressiveness . . . 95
C.15 Limitations: complex configuration process . . . 96
C.16 How much would you be interested in using CAPE to provide personal-ization for your future applications? . . . 96
C.17 What is your area of expertise? . . . 97
C.18 For how long have you been working in that area? . . . 97
C.19 Have you ever used any tools or approach to integrate personalization into any of your applications? . . . 98
C.20 Do you consider intuitive the connection between personalization - pa-rameter - resource? . . . 98
C.21 How difficult was it to understand the configuration methodology for an application? . . . 99
LIST OF FIGURES xv
C.23 How useful do you think is the notion of ’context’, for personalization
pur-poses?. . . 100
C.24 Do you think there should be more types of external services? . . . 100
C.25 Limitations: steep learning curve of personalization model . . . 101
C.26 Limitations: personalization model expressiveness . . . 101
C.27 Limitations: complex configuration process . . . 102
List of Tables
2.1 User Profile vs. Context . . . 16
2.2 Mahout’s clustering techniques . . . 20
3.1 Summary . . . 35
3.2 Input using two data dimensions . . . 37
Listings
1
Introduction
About two decades ago, the World Wide Web started to pervade almost every aspect of our daily life enabling us to access information through a distance of thousands of kilo-metres in less than a second. Initially, the amount of transferred data was rather small in comparison to what we see currently, but due to a quick technological evolution, systems greatly improved their capabilities, granting to its users an increase in performance and in storage devices capacity. Given this situation, the amount of transferred data between different entities also increased at the same rate which resulted in a drastic increment of information.
This increase in machine resources also gave us the technology to create computer systems of several sizes and formats, resulting in the integration of those machines in sev-eral everyday situations. Computing is no longer just about using a desktop computer. Tablets, laptops, mobile phones and other gadgets are examples of how technology has evolved. Digital devices are getting smaller, faster and more efficient which, given the circumstances, explains the emergence of fields like pervasive and mobile computing.
1.1
Motivation
Pervasive computing demands adaptation and personalization as its basis, in order to offer the right personalized information to the user. To achieve this objective there are several issues that need some attention, including user preferences, heterogeneous envi-ronments and devices, dynamic user behaviour and user privacy [Mad12]. Concerning mobile computing, it is important that the system only takes into account the most accu-rate pieces of information so that the application may fit the users’ needs and interests. This allows:
• The capability to satisfy the needs of every user independently of age and skills.
Less skilled users probably require a simpler interface, in comparison to expert users that have a more detailed oriented approach.
• The appearance of dynamic interfaces that fit the users’ usage habits. For instance,
many applications allow the users to execute the same function in different ways, or if a user wants to close a window, most applications allow a keyboard shortcut or GUI shortcuts.
• Dynamic personalization that varies according to the context of usage. For
exam-ple, the user might want to interact with certain applications in different ways if s/he is at work, home or other places.
It is crucial for the application to learn about the users’ preferences and interests in order to provide good personalization. Given the need to grant personalization, machine learning techniques such as clustering and classification can be useful to accomplish good results, because they provide the capability to build models of each user, that represent their application profile.
Lying hidden in data there is precious information that is potentially useful and is rarely made explicit or used. This information can give, for instance, precious hints of user behaviour. Every click, every submission, every request can be turned into data and, by analysing it, specific patterns arise. Given the potential usefulness of those patterns it is desirable for computers to use them as extra information in their computation. Ma-chine learning is a type of artificial intelligence that provides computers with the ability to learn without being explicitly programmed. They permit to extract relevant informa-tion from data generated from the usage of applicainforma-tions by their users. Those techniques allow to know more about each user and perceive what users like, what they are inter-ested in, and also their capabilities or skills. All this user information can be used to adapt and personalize applications so that information can be filtered to what is needed and desired by each user.
1. INTRODUCTION 1.2. Description and Context
other variables such as location and weather conditions. That is why context informa-tion is extremely important to fine-tune the process of pattern extracinforma-tion and user profile generation, and therefore deliver a more accurate personalization.
Unfortunately, there are still some limitations in this process. Looking at the current state of art related to context-aware systems (systems that take the context element into account), it is possible to perceive that most implementations are domain-driven, i.e., they are developed taking into account their specific area, such as cinema or tourism. The problem with this issue is that it does not provide much flexibility, which means that if someone wants to develop a system that profiles its users, the development would have to be done almost from scratch. This work’s objective is to overcome this limitation.
1.2
Description and Context
This dissertation work was done in the scope of the DEAP (Developing Environmental Awareness with Persuasive Systems) project, which is being developed by CITI (Cen-tro de Informática e Tecnologias de Informação) from FCT-UNL (Faculdade de Ciências e Tecnologia - Universidade Nova de Lisboa) in collaboration with UE (Universidade de Évora) and partly funded by FCT/MCTES (Fundação para a Ciência e Tecnologia) with the grant PTDC/AAC-AMB/104834/2008. The DEAP project introduces a new paradigm for environmental awareness, which will help motivating citizens to become more environmentally responsible in their everyday life, engaging them in environmen-tal preservation activities. The purpose of this project is the study of how to stimulate citizens’ responsible environmental behaviour changes through interactive public ambi-ent displays that sense and react according to users’ activities.
As a case study, this dissertation was applied and tested with LEY (Less energy Empowers You), a sub-project of DEAP, which is a persuasive mobile seriousgame ap-proach to help people understand domestic energy usage in order to change their neg-ative habits. The mechanics of the game are based on real-time domestic energy usage monitoring. The application is directed to households, but it should permit an easy ex-tension to schools and offices scenarios. LEY benefits from the usage of different types of personalization, which is used to adapt LEY to different types of users with different needs and desires.
1.3
Presented Solution
Personalization is provided based on a machine learning module that relies on im-plicit interaction stream data, context of usage data and exim-plicit user preferences. This module aims to ease and automate the implementation of personalized mobile systems. Clustering as an unsupervised learning approach is used because CAPE aims to provide personalization with a minimal effort by the developer. If a traditional classification ap-proach was to be used, due to its supervised learning nature, it would be necessary to have for each application a collection of labelled data to train the system. The problem is that in the beginning of each application’s life there will never exist any data associated to it. Therefore, that initial data would have to be artificially created and estimated by the developer, which is not convenient or even effective in many circumstances. This means that the usage of clustering makes the personalization process much simpler and flexible for the application developer.
CAPE is used in the form of personalization APIs and configuration modules, which give the developer a high-level development platform because the algorithms are al-ready implemented and only need to be combined and configured according to specific project’s needs. Application developers are the main target of this solution. They anal-yse and define the data that is possible to extract from the interaction between user and application; create relations between different types of data to make it more expressive; define which personalization options are offered to each user; create combinations of user profiles that define each personalization option.
1.4
Contributions
The main contributions are:
• A personalization environment which offers an API composed of several methods:
Creation of new users in the data model; update of a user’s interaction stream data; update of a user’s preferences data; request of a personalization option that will be used in on the client side to offer personalization.
• The integration of personalization on LEY mobile application using CAPE. Users’
interaction stream data, the corresponding context of access and users’ preferences are used to generate user profiles and personalize some application’s elements such as the interface and level of alerts the application sends to each user.
• A study that evaluates two important points in this work: the developed
1. INTRODUCTION 1.5. Document Structure
• Writing and submission of scientific articles regarding this work’s theme. At the
moment of this delivery, a work in progress paper was accepted and presented at the ACM Ubicomp 2012 conference1[MVC12].
• Participation inFraunhofer Portugal Challenge 2012 contest 2. The submission suc-cessfully reached the 2nd phase of evaluation.
1.5
Document Structure
This document is structured in five main chapters described below:
• Chapter 1 - Introduction:Presents a global vision of this work, concerning
motiva-tion, description and context, the proposed solution and the main contributions.
• Chapter 2 - Related Work: Establishes a connection between the objectives of this
work and the related work. It starts by giving an introduction about machine learn-ing, overviews recommender systems and clustering techniques, makes an analy-sis of how to integrate context in a machine learning approach, includes an analyanaly-sis and comparison of two machine learning frameworks and external contextual tools, and also presents some projects that influenced this work.
• Chapter 3 - CAPE:Explains the core of this work. Starts by broadly explaining
the theory behind the presented idea, the requirements to use the framework, the explanation of the personalization data model, the environment’s architecture and finally the work flow of the provided algorithms.
• Chapter 4 - Case study - LEY:Reports how CAPE was used to personalize LEY
software and what kind of personalization was achieved.
• Chapter 5 - Evaluation: Presents the results and conclusions taken from the tests
that were applied to surveyed software developers, in order to collect more infor-mation about CAPE.
• Chapter 6 - Conclusions and Future Work:This Chapter mainly contains the final
conclusions of this work and ideas for the future.
2
Related Work
This chapter contains information related to the techniques and technologies required to develop the given solution, also presenting relevant related projects.
The first section gives an introduction to the main concepts of machine learning, which is followed by a brief overview of recommender systems technology that was pre-viously considered to be used, and finally addresses clustering technology as a solution for what is intended by this work. The second section introduces context as a comple-ment to the machine learning solution. The third section makes an analysis of two ma-chine learning frameworks which were considered for this work and also an overview of weather external services, which add additional context information, that can prove to be useful in the generation of user profiles. The final section cites some relevant research projects that influenced this work.
2.1
Machine Learning
is just a very limited example for a machine learning application, because the area is very wide and involves several different technologies adapted to problems with different do-mains. [Zha10] organizes machine learning algorithms into a taxonomy, based on the outcome of the algorithm:
• Supervised learning- Consists on the generation of a function that maps input to
the desired output, using training data. The training data consists of a set of training examples where each example is composed by a pair where the first element is an input object (for instance, a vector of values) and the second element is the output label. The algorithm analyses the training data and produces an inferred function calledclassifierorregression function, depending on the type of output;
• Unsupervised learning- Tries to find a structure in unlabelled data, i.e., the
exam-ples do not have an output value/label which makes it impossible to have a sense of error. This is what distinguishes unsupervised learning from supervised learning;
• Semi-supervised learning- Combination of labelled and unlabelled examples to
generate an appropriate function or classifier;
• Reinforcement learning- The algorithm learns a policy of how anagentshould act given an observation of theworld/environment. Every action has some impact in the environment, and the environment provides feedback that guides the learning al-gorithm. Reinforcement learning differs from standard supervised learning in that correct input/output pairs are never presented, nor sub-optimal actions explicitly corrected;
• Transduction- Also known astransductive inference, is quite similar to supervised learning, but does not explicitly construct a function. It tries to predict new outputs based on training inputs, training outputs and also new inputs. That is the opposite of induction, which reasons from observed training cases to general rules, that are will be applied to test cases;
• Learning to learn - Also known as multi-task learning, is an approach where the algorithm learns a problem with other related problems at the same time, based on previous experience. Due to this collaboration, it provides learning that uses the commonality among the task, leading to a better model for the main task.
2.1.1 Recommender Systems
2. RELATEDWORK 2.1. Machine Learning
Burke in [Bur02] defines Recommender Systems as a subclass of information filtering system, which are used to describe any system that produces individualized recommen-dations as output, or has the effect of guiding the user in a personalized way to inter-esting or useful objects in a large space of possible actions. They are primarily directed towards individuals who lack sufficient personal experience or competence to evaluate the potentially large number of alternative items that a source may offer.
RSs should deliver a personalized output, because it is useful for different users or user groups to receive different recommendations adapted to their interests. Therefore, it is common for this kind of systems to collect data from users and create models out of it, in order to predict what are the most suitable items, based on preferences or constraints. Many RSs have the ability to learn from the provided data in order to predict user eval-uations for items, or correctly rank items for a user. That is why they benefit from the results of several computer science fields such as machine learning, data-mining and human-computer interaction [RRSK11].
For this work’s purposes it would be ideal to use recommender systems to collect information about each user’s habits, interests and needs, so that a mobile application could filter irrelevant information, and then provide personalization to each user. The problem with this approach resides in the fact that most traditional recommender sys-tems use an abstractionuser-item, i.e., they seek to predict the level of preference that a user would give to an item, they had not yet considered. Since this work is supposed to result in a generic personalization environment, this abstraction proves to be a severe limitation because in most applications the notion of item is not existent. It would be extremely complex to virtualize items according to each user’s interaction stream with the application, which would result in a even more difficult personalization of that ap-plication. For these reasons, recommender systems do not seem to be an intuitive and helpful approach for a personalization environment that aims to be generic enough and adaptable to each possible type of application.
2.1.2 Clustering
As referred in chapter 1, this work focuses on the personalization of applications. The kind of data that is possible to pervasively derive from regular applications is not la-belled, i.e., it is usually raw data like the number of clicks or the number of accesses to applications’ resources. Therefore, based on the previous list, we can point out unsuper-vised learning as a technology with potential to achieve the desired purposes.
Clustering is not a specific algorithm by itself, but the name given to the general task to be solved. It plays a big role in data mining applications such as scientific data exploration, information retrieval and text mining, spatial database applications, web analysis, marketing, medical diagnostics and computational biology.
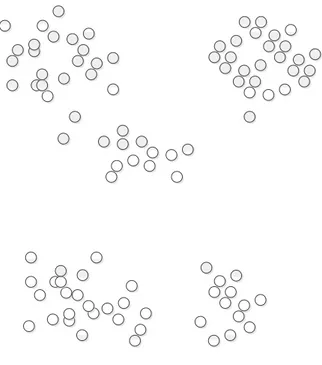
The previous clustering definition permits to assume that the objects to be clustered can be represented as points in the measurement space. It is easy to recognize clusters when looking at a collection of points represented in two dimensions. While it is easy to give a functional definition of a cluster, it is very difficult to give it an operational definition. Objects can be grouped into clusters with different purposes in mind. In fact, data can reveal clusters of differing "shapes" and "sizes". For example, figure 2.1
illustrates a collection of points in a two-dimensional canvas. The amount of clusters in the figure can differ from person to person. At the global/higher level of similarity, we perceive two clusters in this collection, but at the local level we perceive 6 clusters. None of the answers is correct because it depends on multiple scales of visualization. Thus, the crucial problem of identifying clusters in data is to specify what proximity is and how to measure it [JD88].
Figure 2.1: Several points spread out
Clustering a collection of items usually involves three entities:
• An algorithm- The method that is used to group the data together into groups of
similar objects;
• A notion of both similarity and dissimilarity- In order to organize data into
2. RELATEDWORK 2.1. Machine Learning
• A stopping condition - Eventually the algorithm will have to stop. That should
happen when it is not possible to move objects around between clusters, i.e. when each cluster is already quite dissimilar from the others.
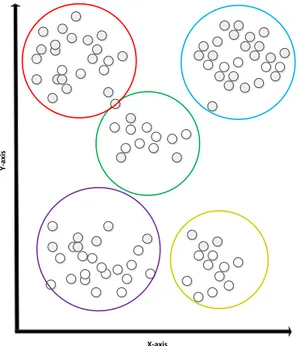
One way to imagine clusters is by picturing circles around points/objects. Figure2.2
shows the clustering of points in a standard two dimensional Cartesian plane. Each circle represents one cluster containing several points. This circle representation also means that each cluster will have a radius and centre point to describe them. The circle centre is called thecentroid, ormeanof the cluster. Of course there are clustering techniques that are not compatible with this type of representation, but this is a good way to visualize a cluster and is generally adopted [OADF11].
Y-a
x
is
X-axis
Figure 2.2: Several points grouped in clusters
2.1.3 Distance Measures
The notion of distance between points is crucial to the success of the clustering operation, and that is why the most important issue in clustering is finding a function that quantifies the distance between any two data points as a number. There is a large collection of distance measures available. It is not possible to identify one distance measure as the best of all, because the performance and effectiveness of each one strongly depends on the used data. Some examples of distance measures [OADF11] [TSK05]:
• Euclidean distance measure- Given by the Pythagorean formula, it represents the
• Squared Euclidean distance measure- It is the square of the value returned by the
Euclidean distance measure. Used in order to place progressively greater weight on objects that are further apart.
• Manhattan distance measure- This distance measure takes its name from the
grid-like layout of streets in Manhattan, New York. It is the simple sum of the horizontal and vertical components, whereas the diagonal distance might be computed by applying the Pythagorean theorem. It proves useful in domains which do not allow diagonal movement, such as Chess games.
• Cosine distance measure- The cosine distance measure requires to think of points
as vectors from the origin to those points, so that the vectors form an angle, between them. When the angle is small the vectors must be pointing in somewhat the same direction, which makes the points close to each other. That value is represented by the angle’s cosine, which means the length of the two vectors is not taken into account. It is particularly useful to compare documents in text mining.
• Tanimoto distance measure- As referred previously, cosine distance measure
dis-regards the lengths of vector and that can be a problem in some situations. If we consider points P1(1.0, 1.0), P2(4.5, 4.5) and P3(5.0, 5.0), cosine distance would not be able to capture the fact that P2 and P3 are closer in comparison to P1. Euclidean distance measure would be able to reflect that, but would have no information re-garding angles. This means that Tanimoto distance takes the best of both Euclidean and Cosine distance measures.
• Chebyshev distance measure- Also known as Maximum Value distance, is a metric
defined on a vector space where the distance between two vectors is the greatest of their differences along any coordinate dimension. If we consider points P1(0, 1) and P2(1,7), the output of the distance measure is the greatest between |0-1| or |1-7|, i.e. 1 or 6, therefore the result would be obviously 6. Similarly to Manhattan distance, it is also useful in Chess-like domains.
• Minkowski distance measure- The Minkowski norm provides a concise,
2. RELATEDWORK 2.1. Machine Learning
2.1.4 Clustering methods
There is a large amount of clustering algorithms that vary significantly in their properties and, therefore, in the output of different results. It is not easy to categorize every cluster-ing algorithm because the variety is very wide. Traditionally, clustercluster-ing techniques are broadly divided in hierarchical, partitioning, density-based clustering and probabilistic clustering [Ber02].
2.1.4.1 Hierarchical Methods
Hierarchical clustering is a method of cluster analysis which seeks to build a hierarchy of clusters [OADF11] [Ber02]. It allows to group fine-grained clusters into bigger ones that are more generic. This can be done successively until a point where the clusters are so large and so generic that they are useless as groupings. Despite this problem, they are quite useful until a certain degree. Usually, there are two types of strategies for hierarchical clustering:
• Agglomerative- Each object starts in its own cluster and proceeds with a series of
fusions of thenobjects into groups as one moves up the hierarchy;
• Divisive- All objects start in one cluster, and splits are performed successively into
finer groupings.
Hierarchical clustering allows embedded flexibility regarding the level of granularity of groups. It easily handles any forms of similarity and it is applicable to any attribute type, but it also has its own disadvantages such as vagueness of termination criteria and the fact that most algorithms do not review the clusters once constructed, with the purpose of improvement or refinement.
2.1.4.2 Partitioning Methods
When using a partitioning method the result is a set of M clusters, where each object belongs to one cluster. Each cluster has a representative that basically is sort of a sum-mary description of all objects inside that cluster. The representative can assume many forms, depending on the data. For instance, if data is represented by real-valued data, the arithmetic average of the attribute vectors for all objects within a cluster can provide an appropriate representative.
There are several methods of partitioning clustering [RS10] [OADF11]:
on the data and the size of clusters to be used. The algorithm does multiple rounds of processing and refines the centroid locations until the criterion of maximum it-erations is reached or until the centroids converge to a fixed point from which they do not move very much. The processing basically consists of two steps. The first one finds the points that are nearest to each centroid point and assigns them to that specific cluster. The second step recalculates the centroid point using the average of the coordinates of all the points in that cluster. These two steps are processed re-peatedly until convergence is reached. Due to its simplicity K-means is a very fast algorithm, specially for a small number of clusters. It also produces tighter clusters then traditional hierarchical clustering, specially if the clusters assume globular ge-ometry. K-means also has its limitations, specially when clusters strongly differ in size, density and have non-global shapes. It is also not very easy to compare the quality of the produced clusters;
• Bisecting K-Means Method- It is an extension of the K-means method. Beginning
with a cloud of points, its global centroidwis computed. Then, a random pointpL is selected among the cloud of points. With thepLpoint, apRpoint is built as the symmetric of thepLpoint when compared to the main centroidw, i.e. the distance between pL andw is the same as the distance between pR andw. The collection of cloud points is separated in two: The ones closest to pLbelong to sub-cloud L and the ones closest topRbelong to sub-cloudR. If there are more than 2 clusters, re-iterate for each sub-cloudRandL. The basic algorithm is very fast but poor in precision. Nevertheless, there are many optimizations for it;
• Medoids Methods- In contrast to the K-means algorithm, data-points are chosen
as centres of clusters. Two advantages show up in comparison to the traditional K-means. First, it presents no limitations on attribute types, i.e. data does not have to be numerical, and second, the choice of medoids is dictated by the location of a predominant fraction of points inside a cluster, which makes it less sensitive to the presence of outliers (data-points far from the cluster medoid).
2.1.4.3 Density-based Algorithms
Density-based algorithms are capable of discovering clusters of arbitrary shapes. These algorithms group objects according to specific density objective functions. Density is defined as the number of objects in a particular collection/neighbourhood of data-points. This provides a natural protection against outlier data-points [JD88].
This type of clustering can assume two types [NM11]:
• Density-Based Connectivity Clustering- In this type, density and connectivity of
2. RELATEDWORK 2.2. Context
connected to any core point are declared to be outliers, making them not covered by any cluster. The non-core points inside a cluster represent its boundary (different from outliers, because they belong to the cluster). DBSCAN and DBCLASD are two examples of density-based connectivity clustering methods, because they are related to training data points;
• Density Functions Clustering- In this type, density is computed by special density
functions. The overall density is modelled as the sum of the density functions of all objects. Clusters are determined bydensity attractors, which are local maxima of the overall density function. DENCLUE is an example of density functions clustering.
2.1.4.4 Probabilistic Clustering
Probabilistic clustering is based on probabilistic modelling [Ber02] [TSK01] [XEKS98]. A probabilistic model is usually a characteristic shape or a type of probabilistic distribution of a set of points in an-dimensional plane. There are several probabilistic models that fit known data patterns. Probabilistic clustering algorithms try to fit probabilistic models over a data set and try to make them fit, by adjusting the models’ parameters. Since this fit rarely happens, these algorithms give a percentage match or a probability value, which indicates how well the model fits the cluster.
2.1.4.5 Conclusions
Data clustering has proven to be an interesting approach to find similarities in data and put that data into different groups or partitions. Clustering partitions a data set into sev-eral groups such that the similarity within the group is greater in comparison to data among other groups. An overview of the most used techniques is presented, showing that there is no better technique, because each one fits better with different data sets, i.e., they are developed for particular situations. A successful clustering operation de-pends on several factors such as the data quality, the way data is arranged, the number of clusters to be used, data preparation (e.g., irrelevant attributes), proximity measures and handling of outliers.
2.2
Context
is why the incorporation of context may be relevant, having a significant effect in the prediction accuracy of users’ profiles.
2.2.1 Notions and Modelling
Context is applied in a multitude of different areas such as linguistics, philosophy, and obviously computer science. Each one of these disciplines tend to have their own def-inition of the word context that adapts to the respective field domain. It happens that literature does not agree with a particular definition, and each author uses the dictio-nary definition (which is very generic) and adds some information related to their own research. For instance, Brown et al. includes the date, the season, and the temperature [BBC97]; Dey et al. also includes the user’s emotional status [DAS01]. Despite this lack of agreement, it is possible to point out that since mobile computing is related to space and movement, the "location" attribute is shared among most definitions.
According to [WS07] and several other authors, context should be considered as a sep-arate entity in the data model and not as part of the users and preferences descriptions, because there are some substantial differences. Table2.1presents those differences.
Table 2.1: User Profile vs. Context
User Profile Context
•Rather static and somewhat longer
last-ing
•Highly dynamic and transient
•Stored in user profile •Not stored permanently
• Implicitly observed or explicitly
pro-vided by user
•Observed only, never manually entered
by user
•More simple/raw nature • More complex structure depending on
its nature
2. RELATEDWORK 2.2. Context
2.2.2 Identifying Context Data
Broadly, there are three ways to identify contextual data [RRSK11]:
• Explicitly- Consists in directly querying the user or other sources of data about the
current access status.
• Implicitly-Data is gathered in an implicit way, i.e., there is no direct interaction
between the system’s users or other types of relevant context data. A GPS locator in a mobile device regularly updating the user’s current location is an example of gathering context data in an implicit way.
• Inferring- It is possible to infer context using data mining or statistical techniques.
In order to be successful, the application needs a predictive model that can be trained with data related to the systems usage. For example, a television set might be able to predict who is using the remote control by analysing data such as the watched programs, number of times and the rate that the user changes channels.
2.2.3 Techniques of Context Incorporation
In general, context can be introduced in three different ways:
• Contextual pre-filtering- Context data is used to filter out unwanted data before it
is used by the machine learning tool.
• Contextual post-filtering - Analogous to pre-filtering. Instead of filtering data at
the beginning, it is filtered in the end after executing the machine learning tool.
• Contextual modelling - Contextual data is used directly in the modelling
tech-nique.
There is still a limited amount of work comparing these different techniques [RRSK11], which is the reason why it is not possible to reach meaningful conclusions about the strengths and weaknesses of each context incorporation technique, including approaches that combine more that one type of context incorporation technique. This happens be-cause their performance is strongly related to the application, domain, users and envi-ronment. Therefore, in order to achieve the best results, the three techniques should be implemented and tested to see which one(s) fits best for the application’s purposes.
2.2.4 Flexibility
One of them is related to complexity. Contextual information can assume different levels of complexity according to the nature of each context element. This fact has a sig-nificant influence in the system performance. For instance, a tourism domain application that suggests activities to the user has to take into account the weather, user personality, time, money and many other aspects, which results in a very complex process.
The other property concerns interactivity. Depending on the application, there might be the need to collect some context information that simply can not be inferred through the user’s application’s usage. Collecting that information can be quite intrusive and may not be easily provided by the users due to, for example, privacy issues.
2.3
Services and Software Analysis
This section covers the analysis of two machine learning frameworks that were consid-ered for this work. It also presents a brief overview of some external services that could prove helpful to create more accurate data.
2.3.1 Apache Mahout
Mahout1is an open source machine learning library from Apache Software Foundation
[OADF11]. It implements machine learning and collective intelligence algorithms, par-ticularly recommender engines, clustering and classification. It is a framework written in the Java programming language that is intended to be used and adapted by develop-ers. One of the strengths of Mahout is related to scalability, because it also aims to be a machine learning tool of choice when the collection of data to be processed is very large, perhaps too large for a single machine. Mahout uses, with some of its algorithms, the open source framework Apache Hadoop2in order to achieve scalable solutions. Hadoop
is an opsource framework that supports data-intensive distributed applications. It en-ables applications to work with thousands of independent computers and petabytes of data, therefore reliability and scalability are two very important characteristics of it.
The first of the three machine learning approaches in Apache Mahout concerns recom-mendations. Recommender systems describe any system that produces individualized recommendations as output, or has the effect of guiding the user in a personalized way to interesting or useful objects in a large space of possible actions. They are primarily directed towards individuals who lack sufficient personal experience or competence to evaluate the potentially large number of alternative items that a source may offer [Bur02].
The second approach focuses on clustering techniques (see section2.1.2).
Finally, the third approach is about classification. This technology aims to decide how much an element is part of some type or category. It helps to determine whether a new input or element matches a previously observed pattern or not. For instance it could be
2. RELATEDWORK 2.3. Services and Software Analysis
used to determine if a user is frustrated or satisfied about something, or if he would like red wine or white wine.
2.3.1.1 Clustering Techniques
As referred previously, this work uses clustering and that is why classification and rec-ommendation will not be approached in this work. For clustering, Apache Mahout uses a Vector object to store data, which is basically an ordered list of values. In Mahout, vectors are implemented as three different classes, each of which is optimized for differ-ent scenarios: DenseVector, RandomAccessSparseVector, and SequencialAccessSparseVector. A Dense vector is an array of doubles, whose size is the number of features in the data, which means all the entries in the array are pre-allocated. A Random access sparse vector is implemented as a Map between an integer and a double, where only non-zero valued features are allocated. For last, a sequential access sparse vector is implemented as two parallel arrays, one of integers and the other of doubles. Just like with random access sparse vector, only non-zero valued entries are kept in it. The difference is that the first is optimized for random access while the latest is optimized for linear reading. For smaller examples this difference is irrelevant, but since Apache Mahout is designed to withstand large amounts of data this difference is very important. With these three implementations flexibility is provided to choose a vector class whose performance characteristics suit the nature of the data, the algorithm, and the way data is accessed by it [OADF11].
Regarding clustering techniques, Apache Mahout offers several different choices:
• K-means clustering- Mahout implements a basic K-means algorithm and also a
version named MapReduce, which allows its usage in distributed computer net-works for cases when data assumes a very large size, impossible to run in-memory. For more details concerning the basic K-means algorithm see section2.1.4. Using the MapReduce approach, it is possible to split up the clustering algorithm to run on multiple machines, with each mapper getting a subset of the points. The map-per jobs will partially compute the nearest cluster by reading the input points in a stream-fashion. This MapReduce version of K-means is designed to run on an Apache Hadoop cluster making good use of its distributed computing capabilities.
• Canopy clustering- In many real-life clustering problems, the number of clusters is
number of clusters without even specifying the number ofkclusters, as required by k-means.
• Fuzzy k-means clustering - While k-means is an exclusive clustering algorithm,
fuzzy k-means tries to generate overlapping clusters from the data set. Using an overlapping clustering approach, any point can belong to more than one cluster with a certain affinity value towards each. In a similar way to means, fuzzy k-means also has an in-memory implementation and a MapReduce implementation for distributed computing.
• Dirichlet clustering- For situations that demand hierarchical clustering in order to
detect sub-clusters, but also require overlapping among the clusters, probabilistic clustering can be used (notice that hierarchical clustering algorithms do not sup-port overlapping). Dirichlet clustering belongs to the probabilistic clustering fam-ily. While K-means and its derivatives, cluster points generated from an asymmet-rical normal distribution, probabilistic clustering techniques test whether data fits a mathematical model (circular, oval, triangular, etc) by reading through the data vec-tors and calculating the probability of the model fitting the data (see section2.1.4). Mahout’s implementation of Dirichlet clustering goes beyond the traditional algo-rithm, by implementing it as a Bayesian clustering algoalgo-rithm, which means that the algorithm can provide more than one explanation of the data. For instance, it can say that cluster 1 fits a circular model, cluster 2 fits an oval model and cluster 3 fits a triangular model. Just like K-means, Canopy and Fuzzy K-means, Dirichlet also has a MapReduce implementation for distributed computing.
Summary of each technique:
Table 2.2: Mahout’s clustering techniques
Algorithms Fixed Clusters Hierarchical
K-means Yes No
Canopy No No
Fuzzy k-means Yes Yes
Dirichlet No Yes
2.3.1.2 Similarity Metrics
2. RELATEDWORK 2.3. Services and Software Analysis
technique that allows the usage of Euclidean distance metric or Manhattan distance met-ric and assign a weight to each dimension in order to normalize them.
2.3.1.3 Conclusions
Apache Mahout is a growing open source framework with an active community that continuously contributes to its development. There are several tutorials available and a published "hands-on approach" book. It implements several clustering algorithms of different nature that accommodate several different types of data. There is also an option to integrate it with the Eclipse framework3.
On the other hand, Apache Mahout has a dependency on Apache Hadoop project4,
which makes its execution quite slow for simple applications with a low amount of data, even with in-memory execution. This is due to all the overhead caused by Hadoop. Therefore it is possible to conclude that Apache Mahout can be quite useful for an imple-mentation that uses a large amount of data and demands distributed computing.
2.3.2 Weka
The Weka workbench5is a collection of state-of-the-art machine learning algorithms and
data preprocessing tools. It is designed to allow people to try out existing methods on new datasets in flexible ways. An extensive support for the whole process of experimen-tal data mining is provided, in order to achieve its purpose. This includes the preparation of input data, the evaluation of learning schemes in a statistical way and also the visual-ization of the input data and the learning process result. The framework was developed at the University of Waikato in New Zealand and it is implemented in Java [WF05].
The workbench includes methods for the main data mining problems: regression, classification, clustering, association rule mining, and attribute selection. The focus will be given to clustering techniques.
2.3.2.1 Clustering Techniques
Before explaining every clustering technique that Weka has to offer it must be said that Weka requires the data to be submitted in a file in the formats .arff (Attribute-Relation File Format) or .csv (Comma-separated values).
Weka framework offers the following clustering techniques [SBL12]:
• Cobweb algorithm- The Cobweb algorithm yields a clustering dendrogram (used
to represent hierarchical clustering) calledclassification treethat characterizes each cluster with a probabilistic description. Based on this probabilistic value, it allows the creation of classes (clusters) on the fly, because merging and splitting of those
3http://www.eclipse.org/ 4http://hadoop.apache.org/
classes are provided. It is also capable of doing a merge between two classes and after a while split that class in two, which means it is able to do bidirectional search, which is not possible to do using K-means algorithm. Regarding limitations, this al-gorithm does not consider attribute dependencies, and the probability distribution representation of clusters makes it quite expensive to update and store the clusters, specially when the attributes (points) have a large number of values. This happens because the time and space complexities depend on the number of attributes and also on the number of values for each attribute. Another problem has to do with the fact that the classification tree is not height-balanced which may result in a drastic degradation in time and space complexity when searching for specific values.
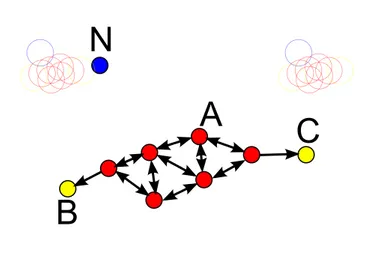
• DBSCAN algorithm- Density-based spatial clustering of applications with noise
(DBSCAN) is a density-based clustering algorithm (see definition in section2.1.4). The algorithm has several advantages: Unlike k-means, the number of clusters does not need to be knowna-priori; it can find arbitrarily shaped clusters, including clus-ters that are completely surrounded by other clusclus-ters; has a notion of noise (irrele-vant or meaningless data); only requires two parameters and is mostly insensitive to the way points are ordered in the database. It also has some disadvantages: It can only provide good clustering if its distance measure is in the function region Query(P, ǫ6), due to the so called "Curse of dimensionality" 7; If there are large
differences in densities, DBSCAN cannot cluster data sets well.
A
C
B
N
Figure 2.3: DBSCAN: Red points arecore points, yellow points aredensity reachable from A and blue points are considered as noise
• Expectation-maximization algorithm- A distribution-based algorithm for finding
6(ǫbeing the density-reachable distance)
7Euclidean distance has a serious limitation when comparing points with a different number of dimen-sions. Imagining that songAand songBhave to be compared in order to know how similar they are. They
2. RELATEDWORK 2.3. Services and Software Analysis
maximum likelihood, i.e., for estimating parameters in statistical models, where the model depends on unobserved latent variables (for instance, a medical diagnosis for patientAmight have totally different variables in comparison to the diagnosis of patientB). Although this algorithm has a highly complex nature, it provides ex-tremely useful results for real world data sets, and is also very useful when there is the need to perform a cluster analysis of a small region-of-interest, due to unsatis-fying results obtained from k-means.
• Farthest first algorithm- A variant of k-means algorithm that places each cluster
centre in turn, at the furthest point from the existing cluster centres. This greatly speeds up the clustering process in most cases since less reassignment and adjust-ment is needed. The results are close to optimal and it is suitable for large-scale data mining applications.
• OPTICS algorithm- The OPTICS (Ordering Points To Identify the Clustering
Struc-ture) algorithm is procedurally identical to the previously mentioned DBSCAN, but it addresses the problem of detecting meaningful clusters in data of varying den-sity. It builds upon DBSCAN by introducing values that are stored with each data object. These values are referred as thecore distance, i.e. the smallestǫvalue that
makes a data object, a core object. There is also thereachability distance, which is a measure of distance between two given objects, and is calculated as the greater of either the core distance of the data object or the euclidean distance between the data object and another point. Both core distance and reachability distance are used to order the objects within the dataset.
0 0.1 0.2 0.3 0.4 0.5 0.6 0.7 0.8 0.9 1 0 0.1 0.2 0.3 0.4 0.5 0.6 0.7 0.8 0.9 1
• K-means clustering algorithms- Already explained in section2.1.4.
2.3.2.2 Similarity Metrics
Regarding similarity metrics, the Weka framework follows a different approach. Instead of providing a vast number of simple to complex distance metrics, it provides an interface named DistanceFunctionthat allows developers to easily implement their own distance measures. Unfortunately some clustering and classification algorithms are tightly imple-mented with their own default similarity metrics. For instance, the implementation of K-means algorithm is hard-coded with the Euclidean distance measure and the Manhat-tan disManhat-tance measure, which makes it difficult for a developer to adapt the algorithm to its own distance metric. This means that in order to use a different distance measure, Weka users need to modify the source code of most algorithms to accommodate their own distance metrics. Still, Weka offers some distance measures such as Euclidean dis-tance, Chebyshev disdis-tance, Manhattan disdis-tance, Minkowski distance and a function to normalize the dimensions of other distance metrics.
2.3.2.3 Conclusions
Weka is an open-source statistical and data mining workbench that has a lot of different types of machine learning algorithms. It is extremely easy to learn and use, and since it is written in Java it is platform independent. On the other end, it lacks variety in its collection of distance metrics, and the provided algorithms do not support distributed computation.
2.3.3 Contextual Tools
Section2.2says that context information can improve the results of some machine learn-ing techniques. In order to incorporate context in those approaches, some auxiliary tool-s/services can prove to be helpful. In particular, the mobile computing area can greatly benefit from services that are related to mobility, such as weather stations.
World Weather Online8is a service that provides global weather forecast and weather
content for its users. Furthermore, it covers two million worldwide cities and the forecast is trusted and used from small and medium enterprises to large corporate clients. It has a weather API, which allows developers and programmers to have free access to a five day weather content forecast in XML (Extensible Markup Language), CSV (Comma Separated Values), JSON (JavaScript Object Notation) data-interchange formats. It also allows using as input data the current location via zip-code, postcode or latitude and longitude. The free version offers up to 500 requests per hour which is enough to fulfil the testing requirements of this work.
2. RELATEDWORK 2.4. Related Projects
Weather Underground9 is another service that provides real-time weather
informa-tion via the Internet. It is able to provide weather reports for cities across the world as well as local weather reports for newspapers and Web sites. It offers a variety of plans and pricing, though most use is free. Some example API methods include access-ing weather information by cities and regions, retrievaccess-ing forecast information, accessaccess-ing satellite images, and current conditions by location. Contrasting from World Weather Online, Weather Underground does not require an API key, but the number of accesses is still tracked and limited. The free version offers 500 calls per day and 10 calls per hour. These services might prove to be helpful to personalize applications according to the current local weather condition.
2.4
Related Projects
This section summarizes projects related to this work. The first sub-section analyses some projects concerning personalization of applications and the second sub-section refers to projects related to clustering as a machine learning approach.
2.4.1 Personalization of Applications
When multimodality became available, there was a lot of enthusiasm that was ultimately unjustified because people thought it allowed the usage of every application with their favourite modality while raising performance and user satisfaction at the same time [Kur07]. It was thought that personalization systems would enable this type of "auto-matic adaptation to user needs", but in reality a lot of different approaches were proposed with limited success and different results. Kurze offers an overarching personalization tool that acts independently from individual applications and that detects which modal-ity or modalities are being used, deducting the reasonwhythe user acted in the described way. This is a serious issue because multimodality offers the user a richer choice to se-lect tools and methods to perform his task, resulting in an increase in input, which also increases the level of complexity in the user model. The most prominent key modules of the highly modular framework are the sensors which collect information on the user’s interactions, the user model (profile database) which is implemented as centralized ho-mogeneous storage and management unit and the machine learning unit (classification and recommendation modules). Initial observations showed that the framework pro-duces valid and valuable results for the tested scenarios. Still, no proof was found that multimodal interfaces can benefit from the proposed personalization framework.
Concerning current developments toward the comparison of predictive algorithms for personalization of a mobile application, Nurmi et al. [NHL07] observed from their tests on different algorithms that those capable of inducing hierarchy between the con-textual data attributes, work relatively well . This indicates that the collected concon-textual
data probably possesses a certain form of hierarchy among the relevant attributes, pro-viding the prediction of users’ behaviour under a certain context. It also describes a context-dependent user model that builds a predictive model for an individual user us-ing data extracted from his/her past behaviour. It is said that although these kinds of models are suitable for situations where users tend to exhibit idiosyncratic behaviour, they also require large computational resources and a large amount of data.
In the future, advanced mobile services should make extensive use of personalization to improve their perceived value and quality [JTD06]. The study says that personaliza-tion shall be possible across a range of various devices, networks and services, which is why it is necessary to develop conceptual and abstract models that are independent of the underlying technologies. An ontology for personalization of information elements was modelled based on this conceptualization, using UML (Unified Modelling Language) no-tation. That representation of personalization information elements has a visual nature, which means that it is not machine processable. An OWL (Web Ontology Language) specification was developed in order to transform the visual model into a textual model, therefore making it machine processable.
Weiß et al. propose a generic framework for application developers, which allows content based filtering on users’ preferences and involved context [WDFLP08]. The work introduces an approach for context-aware personalization of mobile multimedia services. Taking into account mobile requirements, it introduces different filtering methods that can appropriately be distributed among stationary server and mobile clients. Due to the fact that it was built for application developers, the framework is generic, extendible and configurable with respect to the application domain. The approach focuses on profile and meta-data management, and some MPEG-7/21 based matching components. This way, the user profile allows the additional specification of device characteristics such as the display resolution and the network connectivity like the available bandwidth.
2. RELATEDWORK 2.4. Related Projects
evaluation resulted in a performance improvement between 8% and 173%, depending on the scenario, in comparison to traditional personalization schemes.
2.4.2 Clustering and Context Related Projects
Contextual information is a very important clue for data mining [YW08]. While study-ing the problem of generatstudy-ing supervision, from the unsupervised trainstudy-ing data itself, when the data samples are dependent between each other, the authors refer that the dependency among data is the contextual information. Their work proposes a nested expectation-maximization algorithm that considers the data dependency in a higher level in comparison to traditional k-means clustering.
Wallace and Stamou explain the relation between context and user interest,and also propose a context-aware hierarchical clustering algorithm that is able to mine user inter-ests from multi-relational data sets [WS02]. Given a set of elements (e.g., documents), among which it is defined a variety of dissimilarity measures, the algorithm produces groups of elements that resemble each other, as far as one or more of the given relations are concerned. The algorithm is suitable for applications in which the context is an im-portant factor and the number of clusters is not known before-hand.
Social groups’ creation can be employed as a basis for hierarchically structuring user preferences in various domains [VPK+11]. According to the same work: "The successful
3
CAPE
This chapter focuses on the proposed personalization environment. It starts by present-ing an overview of how CAPE is structured and gives some keyword definitions that will be used frequently along this chapter. In order to use CAPE there are some requirements that need to be fulfilled. An explanation of those requirements is presented, followed by CAPE’s data model. After the description of the requirements and the data model, the general architecture is presented, followed by the last section, which explains the main algorithm to generate the resulting personalization.
3.1
Concept and Notions
The main objective of this work is to provide personalization to mobile applications. As mentioned in chapter1, mobile computing devices have some limitations such as pro-cessing power, smaller screens among others, when compared with desktop environ-ments. In order to overcome those limitations, it is necessary to use a technique that is able to profile a user according to his/her behaviour. The solution resides in the adop-tion of personalizaadop-tion for applicaadop-tions. If a user has access to a personalized applicaadop-tion, the presented content should be compatible with what the user really wants or needs, resulting in a better experience.