Dezembro, 2014
Maria João Vieira Botelho Henriques
Licenciada em Engenharia Química, ramo Química Aplicada,Mestre em Engenharia Química
Marine toxins in bivalves:
accumulation, kinetics and subcellular responses
Dissertação para obtenção do Grau de Doutor em Ambiente
Orientador: Doutor Carlos Alberto Garcia do Vale,
Investigador Coordenador, Instituto Português do Mar e da Atmosfera
Co-orientador: Prof. Doutor João Pedro Salgueiro Gomes Ferreira,
Professor Associado com Agregação, Faculdade de Ciências e Tecnologia da Universidade Nova de Lisboa
Júri:
Presidente: Prof. Doutora Maria Paula Baptista da Costa Antunes Arguentes: Prof. Doutora Patricia M. Glibert
Prof. Doutora Lúcia Maria das Candeias Guilhermino
Vogais: Prof. Doutora Ana Gago-Martínez
Prof. Doutora Maria Helena Ferrão Ribeiro da Costa
iii
Marine toxins in bivalves: accumulation, kinetics and subcellular responses
Copyright © Maria João Vieira Botelho Henriques, Faculdade de Ciências e Tecnologia, Universidade Nova de Lisboa.
v
“It is good to have an end to journey toward; but it is the journey that matters,
in the end.”―Ernest Hemingway
To my Grandparents
vii
This dissertation is submitted as partial fulfillment of the requirements for the Doctoral Degree in Environmental Sciences and includes the results of my PhD study carried out from September 2010 to August of 2014 in the Faculty of Sciences and Technology, New University of Lisbon and in the Portuguese Institute of Sea and Atmosphere, Division of Environmental Oceanography and Bioprospection.
ix
I am deeply grateful to Carlos Vale for welcoming me into his research group, for his encouragement, friendship, knowledge and guidance necessary to complete this thesis. Gratitude is also expressed to Professor João Gomes Ferreira for his support, for providing insightful comments and ideas. The DivOA at the Portuguese Institute of Sea and Atmosphere provided the conditions needed for my research. I thank also to the Faculdade de Ciências e Tecnologia da Universidade Nova de Lisboa.
I would like to thank to my colleagues Joana and Patricia for sharing their experience and knowledge and friendship, Susana, Paulo and Pedro for sharing historical data and long companionship in the laboratory work, and Sandra Joaquim, Domitília Matias and Rui Silva for support on experimental work. My gratitude is also extended to my colleagues from the Laboratory of Contaminants and Laboratory of Marine Toxins for their help and support during this period.
Gratitude is due to my parents, Pedro and Francisco for their continuous support and encouragement. I also thank to my friends for their support, particularly in the final stages of this PhD.
xi
xiii
efeitos severos no Homem e na produção e apanha de bivalves. De modo a aprofundar esta temática foram realizados vários estudos. Os estudos em laboratório com fornecimento de células de Gymnodinium catenatum a amêijoas (Ruditapes decussatus) permitiram estimar taxas de captação e depuração de toxinas marinhas paralisantes. Aproximadamente 95% de C1+2 e 85% de B1, as toxinas maioritárias produzidas pela alga tóxica, foram convertidas em outras toxinas ou perdidas em solução. A toxina dcSTX é um exemplo, tendo sido a única toxina quantificada nas fezes produzidas pelas amêijoas. Os estudos sobre nutrientes, espécies de fitoplâncton e toxicidade em mexilhões, provenientes de uma lagoa eutrófica costeira e da zona costeira adjacente, apontaram para a ocorrência de episódios mais intensos e prolongados na lagoa. Estas ocorrências foram interpretadas como o efeito das alterações nas razões de nutrientes promovendo a abundância de células tóxicas importadas da zona costeira. A partição de toxinas nas frações sub-celulares das glândulas digestivas do berbigão
xv
1. Introduction 1
1.1. Marine toxins 1
1.2. Paralytic shellfish toxins (PSTs) 4
1.2.1. Chemical structures 4
1.2.2. Properties 7
1.2.3. Mechanism of toxicity 8
1.2.4. PST-producing species and their geographic distributions 8
1.2.5. Toxin composition and environmental conditions 10
1.2.6. Marine organisms sensitive to PSTs 10
1.3. Bioaccumulation processes 11
1.3.1. Uptake of PSTs 12
1.3.2. Biotransformation of PSTs 14
1.3.3. Elimination of PSTs 15
1.3.4. Responses at organism level to accumulated toxins 16
1.4. Effects of ingested PSTs on humans 17
1.5. Monitoring of toxin-producing species and bivalve toxicity 18
1.5.1 Design of monitoring programmes 18
1.5.2. Closure of legal harvest of bivalves 19
1.6. Economic impact of PSTs 20
1.7. The Portuguese situation 20
1.8. Motivation and objectives 21
1.9. Dissertation outline and content 22
2. Methodologies 25
2.1. Algal cultures 25
2.1.1. Gymnodinium catenatum 25
2.1.2. Isochrysis galbana 25
2.2. Collection and processing of samples 26
xvi
2.2.3. Particulate organic matter 26
2.2.4. Bivalves 27
2.2.5. Sub-cellular fractionation of digestive glands 27
2.3. Phytoplakton and nutrients 28
2.3.1. Phytoplankton 28
2.3.2. Water quality and nutrients 28
2.4. Paralytic shellfish toxins 29
2.4.1. Chemical methodologies for PSTs 29
2.4.2. Toxin extraction, cleanup and oxidation 30
2.4.3. Liquid chromatography analysis 32
2.4.4. Identification and quantification of PSTs 33
2.4.5. Estimation of B2 concentration 36
2.4.6. Certified reference materials 37
2.4.7. Performance and quality control 37
3. Uptake and release of paralytic shellfish toxins by the clam Ruditapes decussatus exposed
to Gymnodinium catenatum and subsequent depuration 39
Abstract 40
3.1. Introduction 40
3.2. Material and Methods 42
3.2.1. Algal culture 42
3.2.2. Clams 42
3.2.3. Feeding experiment 42
3.2.4. Samples 43
3.2.5. Reagents 44
3.2.6. Toxin extraction and oxidation 44
3.2.7. LC-FLD analysis 45
3.2.8. Quality control 45
3.2.9. Mass balance calculation 46
xvii
3.3.1. Toxin profile of Gymnodinium catenatum 47
3.3.2. Toxin concentrations in Ruditapes decussatus 47
3.3.3. Best-fitting curves 49
3.3.4. Toxin composition of particulate organic matter 49
3.3.5. Mass balance calculation 51
3.4. Discussion 52
3.4.1. Conversion of toxins assimilated by clams into decarbamoyl toxins 52
3.4.2. Elimination of dcSTX through clam faeces/pseudo-faeces 55
3.5. Conclusion 56
Acknowledgments 57
4. Winter-summer nutrient composition linkage to algae-produced toxins in shellfish at a
eutrophic coastal lagoon (Óbidos lagoon, Portugal) 59
Highlights 59
Abstract 60
4.1. Introduction 61
4.2. Materials and Methods 62
4.2.1. The Óbidos lagoon study area 62
4.2.2. Sampling 64
4.2.3. Chemical analysis and phytoplankton 65
4.2.4. Data analyses 66
4.3. Results 66
4.3.1. Physicochemical characteristics 66
4.3.2. Nutrients and chlorophyll a 69
4.3.3. Principal Component Analysis (PCA) 69
4.3.4. Nutrient molar ratios 70
4.3.5. Phytoplankton assemblages 76
4.3.6. Toxins in mussels 77
4.4. Discussion 79
xviii
4.4.3. Enhancement of mussel toxicities in the lagoon 82
4.5. Conclusions 84
Acknowledgements 84
5. Partitioning of paralytic shellfish toxins in sub-cellular fractions of the digestive gland of the cockle Cerastoderma edule: changes under post-bloom natural conditions 85
Highlights 85
Abstract 86
5. 1. Introduction 86
5.2. Materials and Methods 88
5.2.1. Samples 88
5.2.2. Reagents 88
5.2.3. Treatment of samples 88
5.2.4. Sub-cellular fractionation 89
5.2.5. Toxin extraction and oxidation 89
5.2.6. Estimation of B2 concentration 90
5.2.7. LC-FLD analysis 91
5.2.8. Performance and quality control 91
5.2.9. Calculation and statistical analysis 93
5.3. Results 94
5.3.1. Toxins in the digestive gland 94
5.3.2. Toxins in sub-cellular particulate fractions 95
5.3.3. Toxins in the cytosolic fraction 96
5.4. Discussion 97
5.4.1. Reduction of toxin content under post-bloom conditions 98
5.4.2. Toxin profiles in sub-cellular fractions 99
5.4.3. Interconversion of toxins in mitochondrial and lysosomal fractions 99
5.5. Conclusions 101
xix
estuarine and coastal waters 103
Highlights 103
Abstract 104
6.1. Introduction 105
6.2. Bivalve toxicity and data analysis 106
6.2.1. Biotoxin monitoring programme 106
6.2.2. Formulas and calculations 108
6.3. Results 110
6.3.1. Data selection 110
6.3.2. Interannual variation of bivalve toxicity by PSTs 112
6.3.3. Seasonal variation of bivalve toxicity by PSTs 114
6.3.4. Molar proportion of the toxins C1+2 and B1 in bivalves 116
6.4. Discussion 119
6.4.1. Uptake and biotransformation/elimination of toxins 120
6.4.2. Import of G. catenatum cells to estuaries 121
6.4.3. Unpredictability of bivalve toxicity episodes on decadal scale 122
6.4.4. Seasonality of toxicity episodes 123
6.4.5. Connectivity of PST episodes 124
6.5. Conclusions 126
Acknowledgements 126
7. Profiles of paralytic shellfish toxins in bivalves of low and elevated toxicities following exposure to Gymnodinium catenatum blooms in Portuguese estuarine and coastal waters
127
Highlights 127
Abstract 128
7.1. Introduction 129
7.2. Material and Methods 130
7.2.1. Bivalve toxicity database 130
xx
7.2.4. Sampling of seston and determination of PSTs 134
7.2.5. Statistical analyses 136
7.3. Results 137
7.3.1. PST composition in bivalve species 137
7.3.2. Temporal and spatial variability of toxins 138
7.3.3. PST composition in bivalves with different toxicity values 139
7.3.4. Toxin profile of PSTs in Gymnodinum catenatum 141
7.4. Discussion 142
7.4.1. Toxin profiles of G. catenatum cells from the NW coast 142
7.4.2. Alteration of major ingested PSTs by bivalves 143
7.4.3. Prevalence of decarbamoyl derivates in surf clams 145
7.5. Conclusions 146
Acknowledgements 146
8. Final considerations 147
8.1. General discussion 147
8.2. Perspectives and future work 154
8.3. Management applications 154
xxi
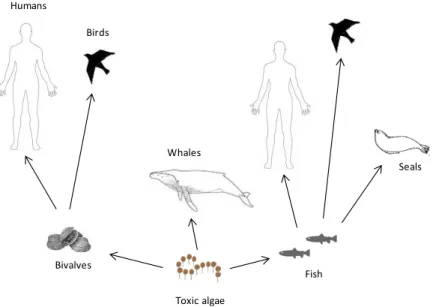
Figure 1.1. Toxic algae in the food chain and their routes of exposure (adapted from
Gerssen et al., 2010).
Figure 1.2. Schematic representation of a one-compartment model for bioaccumulation (adapted from Connell and Miller, 1984).
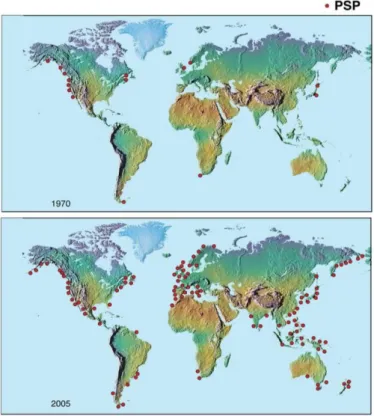
Figure 1.3. The global expansion in the distribution of PSTs in bivalves and PSP episodes – 1970 versus 2005. (Credit: U.S. National Office for Harmful Algal Blooms, Woods Hole Oceanographic Institution, Woods Hole, MA; adapted from Anderson, 2009).
Figure 2.1. Light microscopy photo of Gymnodinium catenatum; marine toxic algae collection (IPMA, ex-IPIMAR); scale bar=30 µm.
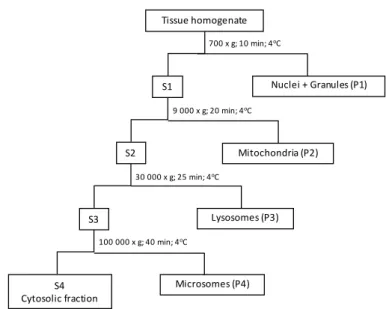
Figure 2.2. Schematic procedure of the sub-cellular fractionation by sequential centrifugation; S - supernatant fraction; P - pellet fraction.
Figure 2.3. Flow diagram with the sequence of oxidation reactions and corresponding toxin identification after C18 cleanup or SPE-COOH fractionation (1=peroxide oxidation of C18 extract; 2=periodate oxidation of C18 extract; 3=periodate oxidation of fractions 1 to 3).
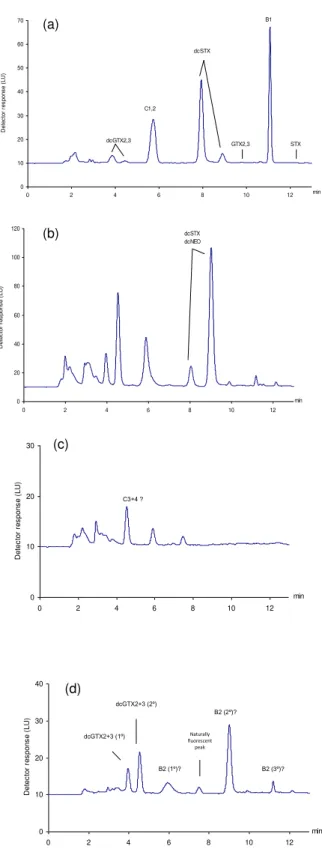
Figure 2.4. Chromatograms obtained for a mussel sample with a toxic profile characteristic of Gymnodinium catenatum. (a) quantification of dcGTX2+3, C1+2, dcSTX, GTX2+3, B1 and STX (peroxide-C18); (b) quantification of dcNEO (periodate-C18); (c) detection of C3+4 (periodate-SPE-COOH-F1); (d) quantification of GTX1+4 and detection of B2 (periodate-SPE-COOH-F2); (e) quantification of NEO (periodate-SPE-COOH-F3). Figure 3.1. Schematic representation of the laboratory feeding experiment.
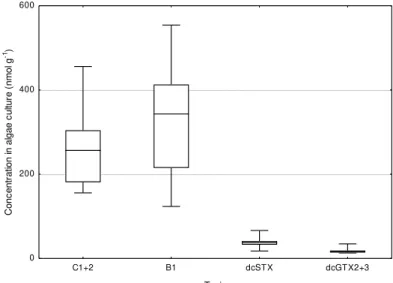
Figure 3.2. Median, percentile 25% and 75%, minimum and maximum of C1+2, B1, dcSTX, dcGTX2+3 concentrations (nmol g-1) in the culture of Gymnodinium catenatum at
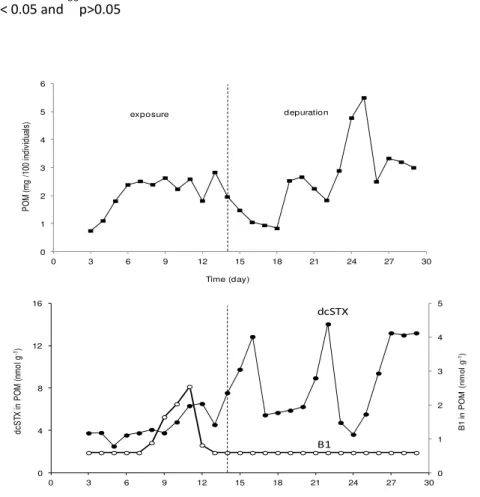
days 2, 7 and 12 of the clam exposure experiment; four replicates at each sampling date. Figure 3.3. Concentrations of the toxins C1+2, B1, dcSTX and dcGTX2+3 (nmol g-1) in the clam Ruditates decussatus exposed 14 days to Gymnodinium catenatum and 15 days under depuration conditions; mean concentrations (n=3; ±SD) and best fitting curves for exposure and depuration periods.
Figure 3.4. Variation of the amount (mg) of particulate organic matter (POM) produced by 100 individuals of Ruditapes decussatus exposure to Gymnodinium catenatum and under depuration conditions; concentrations (nmol g-1) of the toxins B1 and dcSTX in the
POM.
4
12
18
25
28
34
35
43 48
50
xxii
lagoon; B1 and B2 - middle lagoon; C and D - upper lagoon (Bom-Sucesso branch and Barrosa branch, respectively); E1 and E2 - coastal area adjacent to the Óbidos lagoon; F - southern coastal area.
Figure 4.2. Projection of environmental parameters, and sampling sites in summer (open symbols) and winter (black symbols) campaigns obtained from the principal component analyses (PCA) performed on three data sets: site D - Barrosa branch (PCA1); sites A, B1, B2 and C all together – lagoon, except Barrosa branch (PCA2); and sites E1, E2 - coastal area adjacent to the Óbidos lagoon (PCA3). Percentage of total variance is indicated in brackets close to principal components axes.
Figure 4.3. Median, percentile 25% and 75%, maximum and minimum of molar ratios DIN:P, DIN:Si and SI:P in summer (open box) and in winter (shaded box). Three data sets were considered for the surveyed period 2006-2010. Sites A, B1, B2 and C all together – lagoon, except Barrosa branch; site D - Barrosa branch; and sites E1, E2 - coastal area adjacent to the Óbidos lagoon. Outliers () and extreme (∆) values are identified.
Results of Kruskal-Wallis test are presented.
Figure 4.4. Phytoplankton main groups contribution (%) to total biomass, at sites A (lower lagoon), C (Bom-Sucesso branch) and D (Barrosa branch), during summer and winter campaigns of 2009.
Figure 4.5. Annual variation of toxicity derived from accumulated paralytic shellfish toxins (PSTs, µg STX eq/100g) and diarrheic shellfish toxins (DSTs, µg OA eq/100g) in
Mytilus galloprovincialis collected at site A (lower lagoon) and site F (coastal area south of the Óbidos lagoon). Data of 2006 and 2009 are presented.
Figure 5.1. Chromatograms obtained for two standard mixtures of C1+2, GTX2+3, B1 and STX after peroxide oxidation (a), of dcGTX2+3 and dcSTX after peroxide oxidation (b), and for a selected cockle sample (sub-cellular particulate fraction P3-lysosomes); quantification of dcGTX2+3, C1+2, dcSTX, GTX2+3 and B1 after peroxide oxidation of the C18-cleaned extract(c).
Figure 5.2. Quantities (nmol) of the toxins C1+2, B1, B2, dcGTX2+3, dcSTX, GTX2+3 and STX in composite samples of digestive glands of the cockle Cerastoderma edule exposed to a bloom of Gymnodinium catenatum (day 0) and the subsequent 25 days under post-bloom conditions; mass unit: one g wet weight of digestive gland; mean values (n=3; ±SD) for C1+2, B1, dcGTX2+3, dcSTX, GTX2+3 and STX, and individual values of selected samples for B2.
63
74
75
77
79
92
xxiii
- P3, microsomes - P4) of digestive glands of the cockle Cerastoderma edule over the 25 days under post-bloom conditions; mass unit: one g wet weight of digestive gland; mean values(n=3;±SD).
Figure 5.4. Estimated quantities (nmol) of the toxins C1+2, B1, dcGTX2+3, dcSTX, GTX2+3 and STX in the cytosolic fraction of digestive glands of the cockle Cerastoderma edule
over the 25 days under post-bloom conditions; mass unit: one g wet weight of digestive gland; mean values (n=3; ±SD).
Figure 5.5. Toxin profiles expressed as molar ratios (%) between the quantity of each toxin and the quantity of all the quantified toxins in the particulate fractions nuclei+debris - P1, mitochondria - P2, lysosomes - P3, and microsomes - P4 and in the cytosolic fraction of digestive glands of the cockle Cerastoderma edule over the 25 days under post-bloom conditions; mass unit: one g wet weight of digestive gland; mean values (n=3).
Figure 6.1. Harvesting areas of mollusc bivalves: Aveiro, Mondego, Óbidos, and Formosa (estuarine systems), and Aguda, Comporta and Culatra (open coastal areas).
Figure 6.2. Annual proportion of elevated toxicity samples (bars, TSY) and confidence
levels (squares, CL); mussels (M) and cockles (C) from Aveiro, Mondego, Óbidos and Formosa, between 1994 and 2012.
Figure 6.3. Annual proportion of elevated toxicity samples (bars, TSY) and confidence
levels (squares, CL); surf clams (SC) from Aguda and Culatra, and wedge clams (WeC) from Comporta and Culatra, between 1994 and 2012.
Figure 6.4. Monthly proportion of elevated toxicity samples (black and grey bars, TSM)
and confidence levels (squares and triangles, CL); mussels (M) and cockles (C) from Aveiro, Mondego and Óbidos; cockles from Formosa; surf clams (SC) from Aguda and Culatra; wedge clams (WeC) from Comporta and Culatra; period: 1994-1995; black bars and squares represent mussels and surf clams; grey bars and triangles represent cockles and wedge clams.
Figure 6.5. Monthly proportion of elevated toxicity samples (black and grey bars, TSM)
and confidence levels (squares and triangles, CL); mussels (M) and cockles (C) from Aveiro, Mondego and Óbidos; cockles from Formosa; surf clams (SC) from Aguda and Culatra; wedge clams (WeC) from Comporta and Culatra; period: 2005-2009; black bars and squares represent mussels and surf clams; grey bars and triangles represent cockles and wedge clams.
95
97
100
107
113
114
115
xxiv
calculated to elevated toxicity samples; mussels and cockles from Aveiro, Mondego, Óbidos; cockles from Formosa; wedge clams from Comporta and Culatra; n varied from 3 (wedge clams, Culatra, 2009) to 23 (mussels, Aveiro, 2008); * p<0.05.
Figure 6.7. Connectivity Index (CI) for Aveiro-Mondego-Óbidos (mussel and cockle), Aguda-Aveiro (surf clam versus mussel) and Culatra-Formosa (cockle versus wedge clam), for the periods 1994-1995 and 2005-2009; CI scored from 0 to 4 based on the number of weeks per month with toxicity values above regulatory limit.
Figure 7.1. Harvesting areas of mollusc bivalves: Aveiro, Mondego, Óbidos, and Formosa (estuarine systems), and Aguda, Comporta and Culatra (open coastal areas).
Figure 7.2. Median, maximum, minimum, 75th and 25th percentiles of molar fractions of quantified PSTs (%) in samples of surf clam, wedge clam, cockle and mussel presenting toxicity values above the PST regulatory limit; period of time: 2007 - 2012; methodologies used: (a) C1+2, B1, dcSTX, dcGTX2+3, GTX2+3 and STX (method A), (b) C1+2, B1, "dcSTX", "dcGTX2+3", "GTX2+3" and "STX" (method B).
Figure 7.3. Median, maximum, minimum, 75th and 25th percentiles of molar fractions of quantified PSTs (%) in two sets of samples of surf clam, wedge clam, cockle and mussel presenting toxicity values above and below the PST regulatory limit (RL) between 2007 and 2012; (a) C1+2, B1, dcSTX, dcGTX2+3, GTX2+3 and STX (method A); (b) C1+2, B1, "dcSTX", "dcGTX2+3", "GTX2+3" and "STX" (method B).
Figure 7.4. Median, maximum, minimum, 75th and 25th percentiles of molar fractions of
toxins C1+2, B1, dcSTX, and dcGTX2+3 (%) quantified in seston samples (n=9) during a bloom of G. catenatum in coastal waters adjacent to Óbidos lagoon in 2008 (method A). Figure 7.5. Median, maximum, minimum, 75th and 25th percentiles of the molar ratios R1=(C1+2):B1 and R2=[(dcSTX)+(dcGTX2+3)]:[(C1+2)+(B1)] calculated for samples of surf clam, wedge clam, cockle and mussel presenting toxicity values above and below the PST regulatory limit (RL), as well as for samples of seston during a bloom of toxic algae (G. catenatum) in coastal waters adjacent to Óbidos lagoon in 2008 (method A); period of time for bivalves: 2007 – 2012; methodologies used: (a) method A; (b) method B.
120
126
132
138
140
141
xxv
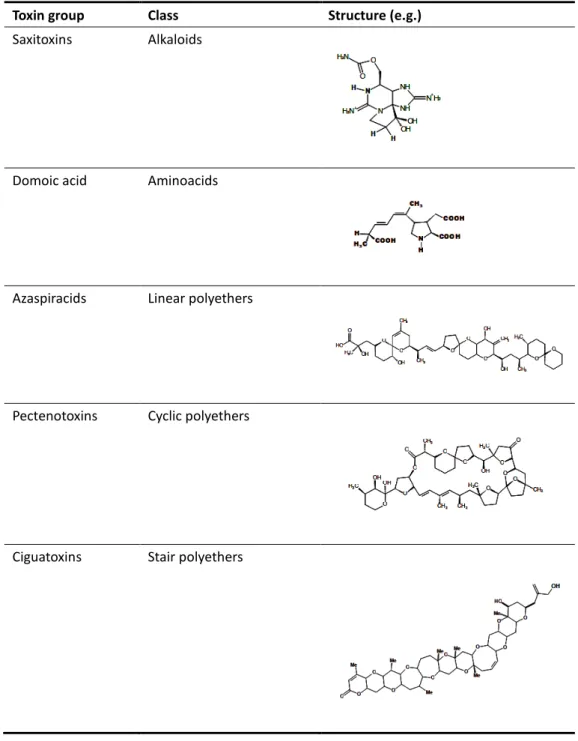
Table 1.1. Groups of marine toxins, chemical classes and examples of structures.
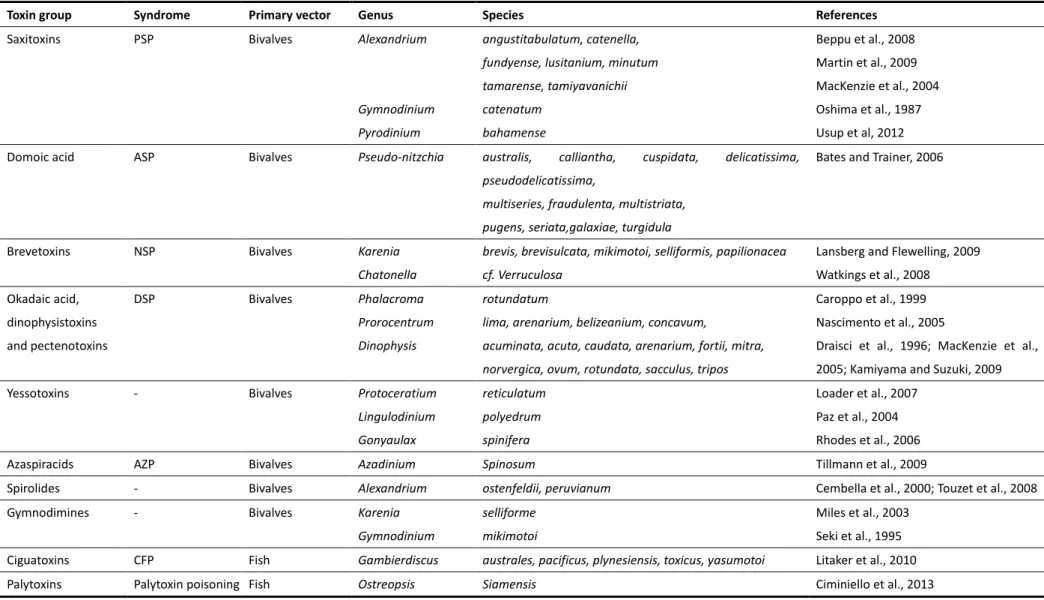
Table 1.2. Marine toxin groups and their phytoplankton species producers (adapted from Gerssen et al., 2010).
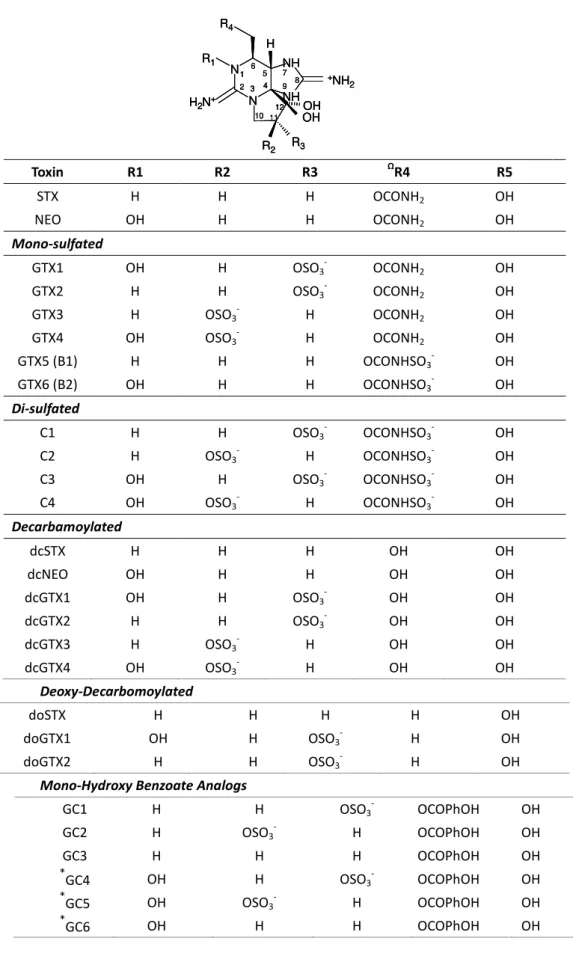
Table 1.3. The paralytic shellfish toxins produced by marine phytoplankton or resulted from metabolic transformation (adapted from Wiese et al., 2010).
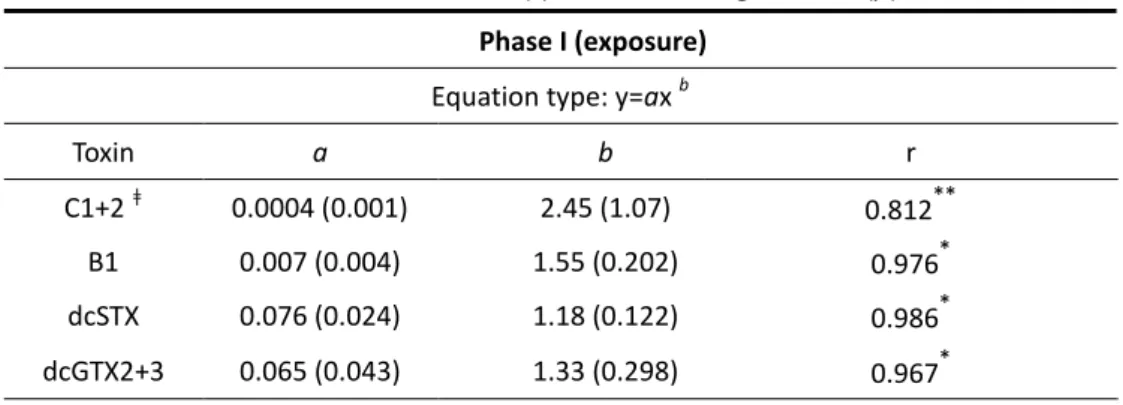
Table 3.1. Best fitting curves for C1+2, B1, dcSTX and dcGTX2+3 in Ruditapes decussatus
during phase I (exposure) and phase II (depuration); calculated parameters (standard error); correlation coefficients (r) and levels of significance (p).
Table 3.2. Mass (nmol) of toxins accumulated in Ruditapes decussatus (Tc), supplied to the experiment (Ta) and present in particulate organic matter (Tp) after phase I, phase II, and phases I+II. Values of Tng were computed according to Eq. 3.2. Amounts were calculated for a basis of 100 clams.
Table 4.1. Water temperature (T), salinity, O2, and pH at five sites in the Óbidos lagoon: A – lower lagoon, B1 and B2 - middle lagoon, Bom-Sucesso branch – C and Barrosa branch - D. Minimum and maximum intervals are presented for 2006 and 2009, and single values for 2007, 2008 and 2010.
Table 4.2. Values of NH4+, NO3-+NO2-, dissolved organic nitrogen (DON), PO43-, dissolved
organic phosphorous (DOP), Si(OH)4 and chlorophyll a (Chl a) registered at five sites in
the Óbidos lagoon: A – lower lagoon, B1 and B2 - middle lagoon, C – Bom-Sucesso branch and D – Barrosa branch. Minimum and maximum intervals are presented for 2006 and 2009, and single values for 2007, 2008 and 2010.
Table 4.3. Values of NH4+, NO3-+NO2-, PO43-, Si(OH)4 and chlorophyll a (Chl a) registered at
2 sites located at the adjacent coast to the Óbidos lagoon: E1 and E2. Minimum and maximum intervals are presented for winter and summer of 2006, 2007, 2008 and 2009. Table 4.4. Phytoplankton species observed in winter and summer campaigns of 2009 in the Óbidos lagoon: lower lagoon (site A), Bom-Sucesso branch (site C) and Barrosa branch (site D). Species identified both in winter and summer 2009, at each site are shown within a shaded box. Potentially toxic species are highlighted in bold.
2 3
5
50
53
67
71
73
xxvi
Mondego, Óbidos, and Formosa (mussel and cockle), Aguda (surf clam), Comporta (wedge clam) and Culatra (surf clam and wedge clam).
Table 7.1. Annual number of samples, between 2007 and 2012, with toxicity values below and above the regulatory limit for PSTs; surf clam (Aguda-AG, Comporta-CO and Culatra-CU), wedge clam (Comporta-CO and Culatra-CU), cockle (Aveiro-AV, Mondego-MO, Óbidos-OB and Formosa-FO) and mussel (Aveiro-AV, Mondego-MO and Óbidos-OB); 2007-2008 - method B; 2009-2012 - method A.
Table 7.2. Median and the interval of minimum and maximum of PST toxicity ratios (total toxicity value/regulatory limit) between 2007 and 2012; surf clam (Aguda-AG, Comporta-CO and Culatra-CU), wedge clam (Comporta-CO and Culatra-CU), cockle (Aveiro-AV, Mondego-MO, Óbidos-OB and Formosa-FO) and mussel (Aveiro-AV, Mondego-MO and Óbidos-OB); 2007-2008 - method B; 2009-2012 - method A.
133
xxvii ANOVA
AOAC ASP AZP CFP CRM dcGTX dcNEO dcSTX DIN DO doGTX DON DOP doSTX DSP DST EFSA EU FAO GTX HAB IPCC LC-FLD LD50
LOD
Analysis of variance
Association of official analytical chemists Amnesic shellfish poisoning
Azaspiracid shellfish poisoning Ciguatera fish poisoning Certified reference material Decarbamoylgonyautoxin Decarbamoylneosaxitoxin Decarbamoylsaxitoxin Dissolved inorganic nitrogen Dissolved oxygen
13-deoxy-decarbamoylgonyautoxin Dissolved organic nitrogen
Dissolved organic phosphorus 13-deoxy-decarbamoylsaxitoxin Diarrhetic shellfish poisoning Diarrheic shellfish toxin
European Food Safety Authority European Union
Food and Agriculture Organization of the United Nations Gonyautoxin
Harmful algal bloom
Intergovernmental Panel of Climate Change
Liquid chromatography with fluorescence detection
xxviii MU
NEO NSP OA PCA POM PSP RL SPE SPE- COOH STX TEF WFD
Mouse unit Neosaxitoxin
Neurologic shellfish poisoning Okadaic acid
Principal component analysis Particulate organic matter Paralytic shellfish poisoning Regulatory limit
Solid phase extraction
SPE - ion exchange cartridge with carboxylic acidsiliane Saxitoxin
1
1. Introduction
1.1. Marine toxins
Marine toxins are chemical compounds naturally produced by microalgae or bacteria. Their chemical structure may be included in the classes of alkaloids, amino acids, carboxylic acids, and linear, stair and cyclic polyethers (Yasumoto, 2001) (Table 1.1).
Of the approximately 4,000 phytoplankton species documented to date only 200 of them have a high proliferation rate under specific circumstances (Zingone and Enevoldsen, 2000; Masó and Garcés, 2006). Those circumstances are not fully understood, although specific climatic and hydrographical conditions have been pointed out as key factors to algal blooms (Sellner et al., 2003; Moore et al., 2008). Of the 200 species, approximately 80 species, belonging either to dinoflagellates or diatoms, are natural producers of marine toxins (Zingone and Enevoldsen, 2000). During a toxin-producer algal bloom, toxins mainly associated with the phytoplankton cells may be ingested by shellfish (both molluscs and crustaceans), and planktivorous fish, leading to responses at organism and sub-cellular level and death under extreme episodes (White et al., 1981; Bricelj et al., 1991; Scholin et al., 2000; Deeds et al., 2008). Suspension-feeding mollusc bivalves are the principal vectors for the transfer of several major groups of toxins, due to their ability to pump large volumes of seawater and to concentrate toxins without massive mortality. Consumption of bivalves and other marine organisms containing high toxin concentrations may lead to human health problems (Wang, 2008; Gerssen et al., 2010) (Figure 1.1). Indeed, the deleterious effects of toxins in humans have been given the names paralytic, diarrhetic, neurotoxic and amnesic shellfish poisoning (PSP, DSP, NSP and ASP, respectively) to the corresponding toxins. Syndromes are caused by toxins mainly synthesized by dinoflagellates, although ASP is known to be associated with diatoms.
2
Table 1.1. Groups of marine toxins, chemical classes and examples of structures.
Toxin group Class Structure (e.g.)
Saxitoxins Alkaloids
Domoic acid Aminoacids
Azaspiracids Linear polyethers
Pectenotoxins Cyclic polyethers
Ciguatoxins Stair polyethers
3
Table 1.2. Marine toxin groups and their phytoplankton species producers (adapted from Gerssen et al., 2010).
Toxin group Syndrome Primary vector Genus Species References
Saxitoxins PSP Bivalves Alexandrium
Gymnodinium
Pyrodinium
angustitabulatum, catenella,
fundyense, lusitanium, minutum tamarense, tamiyavanichii catenatum
bahamense
Beppu et al., 2008
Martin et al., 2009 MacKenzie et al., 2004 Oshima et al., 1987
Usup et al, 2012
Domoic acid ASP Bivalves Pseudo-nitzchia australis, calliantha, cuspidata, delicatissima,
pseudodelicatissima,
multiseries, fraudulenta, multistriata, pugens, seriata,galaxiae, turgidula
Bates and Trainer, 2006
Brevetoxins NSP Bivalves Karenia
Chatonella
brevis, brevisulcata, mikimotoi, selliformis, papilionacea
cf. Verruculosa
Lansberg and Flewelling, 2009
Watkings et al., 2008
Okadaic acid, dinophysistoxins
and pectenotoxins
DSP Bivalves Phalacroma
Prorocentrum
Dinophysis
rotundatum
lima, arenarium, belizeanium, concavum,
acuminata, acuta, caudata, arenarium, fortii, mitra, norvergica, ovum, rotundata, sacculus, tripos
Caroppo et al., 1999 Nascimento et al., 2005
Draisci et al., 1996; MacKenzie et al., 2005; Kamiyama and Suzuki, 2009
Yessotoxins - Bivalves Protoceratium
Lingulodinium Gonyaulax
reticulatum
polyedrum spinifera
Loader et al., 2007
Paz et al., 2004 Rhodes et al., 2006
Azaspiracids AZP Bivalves Azadinium Spinosum Tillmann et al., 2009
Spirolides - Bivalves Alexandrium ostenfeldii, peruvianum Cembella et al., 2000; Touzet et al., 2008
Gymnodimines - Bivalves Karenia
Gymnodinium
selliforme mikimotoi
Miles et al., 2003 Seki et al., 1995
Ciguatoxins CFP Fish Gambierdiscus australes, pacificus, plynesiensis, toxicus, yasumotoi Litaker et al., 2010
4
Figure 1.1. Toxic algae in the food chain and their routes of exposure (adapted from
Gerssen et al., 2010).
1.2. Paralytic shellfish toxins (PSTs)
1.2.1. Chemical structures
The PSTs form a group of closely related tetrahydropurine compounds, which can be broadly characterized as hydrophilic or hydrophobic, generally divided into sub-groups based on substituent side chains such as carbamate, sulfate, hydroxyl, hydroxybenzoate, or acetate (Llewellyn, 2006). The basic structures of PSTs are composed of a 3,4-propinoperhydropurine tricyclic system (Shimizu, 2000). Since its initial discovery, 57 naturally occurring PSTs have been identified, mainly derived from marine dinoflagellates or resulted of metabolic transformation in bivalves (Wiese et al., 2010) (Table 1.3).
The first isolated toxin of the group PSTs was saxitoxin (STX), obtained from the Alaskan butter clam, Saxidomus giganteus in 1957 (Schantz et al., 1957). The structure of STX was characterised by means of x-ray crystallographic and nuclear magnetic resonance spectroscopic studies (Bordner et al., 1975; Schantz et al., 1975). STX is included in the group of guanidinium-containing marine natural products, due to the presence of two guanidino groups which are responsible for its high polarity. Subsequently, gonyautoxins (GTX1-6) and
Humans
Birds
Bivalves
Toxic algae Whales
Fish
5
Table 1.3. The paralytic shellfish toxins produced by marine phytoplankton or resulted from metabolic transformation (adapted from Wiese et al., 2010).
Toxin R1 R2 R3 ΩR4 R5
STX H H H OCONH2 OH
NEO OH H H OCONH2 OH
Mono-sulfated
GTX1 OH H OSO3- OCONH2 OH
GTX2 H H OSO3- OCONH2 OH
GTX3 H OSO3- H OCONH2 OH
GTX4 OH OSO3- H OCONH2 OH
GTX5 (B1) H H H OCONHSO3- OH
GTX6 (B2) OH H H OCONHSO3- OH
Di-sulfated
C1 H H OSO3- OCONHSO3- OH
C2 H OSO3- H OCONHSO3- OH
C3 OH H OSO3- OCONHSO3- OH
C4 OH OSO3- H OCONHSO3- OH
Decarbamoylated
dcSTX H H H OH OH
dcNEO OH H H OH OH
dcGTX1 OH H OSO3- OH OH
dcGTX2 H H OSO3- OH OH
dcGTX3 H OSO3- H OH OH
dcGTX4 OH OSO3- H OH OH
Deoxy-Decarbomoylated
doSTX H H H H OH
doGTX1 OH H OSO3- H OH
doGTX2 H H OSO3- H OH
Mono-Hydroxy Benzoate Analogs
GC1 H H OSO3- OCOPhOH OH
GC2 H OSO3- H OCOPhOH OH
GC3 H H H OCOPhOH OH
*
GC4 OH H OSO3- OCOPhOH OH
*
GC5 OH OSO3- H OCOPhOH OH
*
GC6 OH H H OCOPhOH OH
NH
NH N H2N+
N +NH 2 OH OH R3 R2 H R1 R4 1 2 3 4
5 6
7 8 9
10 1112
NH
NH N H2N+
N +NH 2 OH OH R3 R2 H R1 R4 1 2 3 4
5 6
7 8 9
10 1112
NH
NH N H2N+
N +NH 2 OH OH R3 R2 H R1 R4 1 2 3 4
5 6
7 8 9
6
Table 1.3. (cont.)
Toxin R1 R2 R3 ΩR4 R5
Di-Hydroxy Benzoate Analogs
ⱡGC1a H H OSO
3- DHB OH
ⱡGC2a H OSO
3- H DHB OH
ⱡGC3a H H H DHB OH
ⱡGC4a OH H OSO
3- DHB OH
ⱡGC5a OH OSO
3- H DHB OH
ⱡGC6a OH H H DHB OH
Sulfated Benzoate Analogs
ⱡGC1b H H OSO
3- SB OH
ⱡGC2b H OSO
3- H SB OH
ⱡGC3b H H H SB OH
ⱡGC4b OH H OSO
3- SB OH
ⱡGC5b OH OSO
3- H SB OH
ⱡGC6b OH H H SB OH
Other PST Analogs
M1 H OH H OCONHSO3- OH
M2 H OH H OCONH2 OH
M3 H OH OH OCONHSO3- OH
M4 H OH OH OCONH2 OH
*
M5
*
Not structurally characterized
ⱡR4 group putatively assigned based on major ions obtained via MS
7
neosaxitoxin (neoSTX/NEO) were isolated from toxic bivalves and dinoflagellates and their structures identified (Shimizu, 2000).
Usually, a PST-producing organism synthesises a characteristic suite of toxins made up of several PST analogues. These analogues differ in side group moieties and thus are commonly grouped according to these variable residues (Wiese et al., 2010). The most commonly occurring PSTs are hydrophilic and may be non-sulfated, such as STX and NEO, mono-sulfated, such as the GTX1-6, or di-sulfated (C1-4 toxins) (Llewellyn, 2006) (Table 1.3). Decarbamoyl variants of these analogues also exist, such as decarbamoylsaxitoxins (dcSTX, dcNEO), decarbamoylgonyautoxins (dcGTX1-4), and the 13-deoxy-decarbamoyl derivatives (doSTX, doGTX1-2). Three structural families of STX are named by the identity of the R4 side
chain as either N-sulfocarbamoyl (OCONHSO3-), decarbamoyl (OH), or carbamoyl toxins
(OCONH2).
1.2.2. Properties
The stability of toxins varies greatly depending on their structures and pH of the medium. STX is extremely stable even at high temperature and low pH. However, above pH 8 it degrades rapidly at ambient temperature, which suggests STX may not survive in seawater too long unless it is stabilized by complexation with other dissolved substances. Toxins with the presence of N1-hydroxyl groups, such as NEO, are also more labile to acid and heat than STX. Only heated at low pH (between 2 to 4), the toxins with the N-sulfocarbamoyl moiety may be partially converted to the corresponding carbamate toxins through hydrolysis (Shimizu, 2000). In aqueous solution, STX possesses two pKa´s of 8.22
8
1.2.3. Mechanism of toxicity
The mechanism of action of these compounds is the blockage of sodium channels of nerve membranes, which results in stoppage of the propagation of neural impulses and paralysis of neuromuscular systems (Kao, 1966). This is mediated by the interaction between the positively charged guadinium groups of the PSTs with negatively charged carboxyl groups at site 1 of the voltage-gated sodium channels in a equimolar ratio (Catterall et al., 1980). It is documented that PSTs also bind to calcium and potassium channels (Llewellyn, 2006).
The toxicity of the PSTs is usually expressed as STX or STX equivalents. The toxicity was defined in terms of a mouse unit (MU) to quantify toxic activity, as the mouse is more sensitive to the PSTs when compared to species such as fish, amphibians, reptiles and animals of a low order (Mons et al., 1998). The MU is defined as the dose of toxin which kills one 20 g mouse in 15 min (Sommer and Meyer, 1937). STX presents a LD50 (intraperitoneal
route) in mice of only 10 µg kg-1 body weight and an oral LD
50 of 263 µg kg-1 body weight
(Batoréu et al., 2005). The relative toxicity of STX analogues has been studied in mouse bioassays (Genenah and Shimizu, 1981; Koehn et al., 1982; Oshima, 1995a; Sullivan et al., 1983; Vale et al., 2008) and in vitro (Vale et al., 2008). Based on an evaluation of the relative potencies of PSTs studied since 1981, and giving greater weight to more recent data, in 2009 the European Food Safety Authority (EFSA) proposed new toxicity equivalence factor (TEF) values of each analogue based on intraperitoneal acute toxicity in mice (EFSA, 2009). Due to side chain variability, each PST has a different binding affinity to voltage-gated sodium channel receptors, which consequently results in different toxicities. Substitutions at N-1 and/or C-11 decrease the toxicity relatively to STX (Genenah and Shimizu, 1981). The toxicity equivalence factor varies from 1.0 for STX, NEO, GTX1 and dcSTX to 0.1 attributed to B1, B2, C2 and C4 (EFSA, 2009).
1.2.4. PST-producing species and their geographic distributions
9
dinoflagellates, namely Pyrodinium bahamense, Alexandrium spp. and Gymnodinium catenatum (Llewellyn, 2006), and by marine bacteria (Ogata et al., 1990; Kodama et al., 1990), and freshwater cyanobacteria (Carmichael, 1997). Pyrodinium bahamense is responsible for the occurrence of PSTs in the Indo-West Pacific waters (Usup et al., 2012),
Alexandrium spp. in temperate waters of both Atlantic and Pacific oceans (Beppu et al., 2008; Martin et al., 2009; MacKenzie et al., 2004), and G. catenatum in a large geographic area from California, Mexico, Argentina, Venezuela, Japan, Philippines, Tasmania and Iberian Peninsula (Hallegraeff et al., 2012).
G. catenatum is a unarmored chain-forming dinoflagellate, usually with 8-16 cells, sometimes reaching up to 64 cells in length. The optimal growth of G. catenatum has been observed in culture for temperature range of 15-20oC and salinity interval of 23-34
(Blackburn et al., 1989).
Hallegraeff et al. (2012) have proposed two possible mechanisms for G. catenatum
blooms: (i) the autochthonous case - high abundance of cells derived from an inoculum by local cyst beds or motile cells triggered by organic enrichment related to rainfall events (e.g., Tasmanian estuaries); (ii) the allochthonous case - G. catenatum blooms that are inoculated from offshore, and build up during upwelling relaxation (e.g., NW Spanish Rias). Blooms in Portuguese coastal waters have been reported at mid-shelf, related to the relaxation of upwelling events in the western region (Moita et al., 1998, 2003). Slow currents or close circulation contribute to the maintenance of this species near the coast (Pitcher et al., 2010).
10
Singaporean and Malay strains that lack C toxins entirely or have only a low proportion of C1+2 (Holmes et al., 2002; Mohammad-Noor, 2010). Only north-eastern Atlantic strains have a higher B1 and B2 content (>25% molar fraction) although either or both derivatives are absent in some Andalusian strains (Camino-Ordás et al., 2004). Strains from the Gulf of California and the Mexican coast are characterised by a high proportion of NEO (up to 46%), (Band-Schmidt et al., 2006), whereas this derivative generally occurs in lower molar percentages (less than 14%) in Singaporean and Spanish strains (except for one Andalucian strain, Camino-Ordás et al., 2004).
1.2.5. Toxin composition and environmental conditions
Culture-related factors such as growth temperature, chemical compostion of the medium, and chain-length are known to modify both total toxin content and the relative proportions among PSTs (Granéli and Flynn, 2006; Band-Schmidt et al., 2010). Paralytic shellfish toxins are a suite of nitrogen-rich alkaloids, and consequently sufficient nitrogen supply from water is essential for the biosynthesis of these toxins. A number of studies found that nitrogen deficiency could decrease the PST yield and cellular toxin content in toxic species of Alexandrium (Anderson et al., 1990; Yu et al., 2001; Leong et al., 2004), while excess nitrogen availability under phosphorus-limitation condition could increase the cellular toxin content (Flynn et al., 1994; John and Flynn, 2000; Murata et al., 2006; Hattenrath et al., 2010). G. catenatum showed slower responses of the cellular toxin content to changes in the nutrient regime than Alexandrium spp. (Flynn et al., 1996).
1.2.6. Marine organisms sensitive to PSTs
11
behavioural mechanisms to avoid or reduce exposure to toxic cells (Lassus et al., 1999; Tran et al., 2010). These mechanisms range from feeding rate inhibition to shell clapping and complete shell valve closure (Shumway and Cucci, 1987; Bricelj and Shumway, 1998). Softshell clams (Mya arenaria) from areas exposed to toxic blooms are more resistant to PSTs, as demonstrated by whole-nerve assays, and accumulate toxins at greater rates than sensitive clams from unexposed areas. Resistance is caused by natural mutation of a single aminoacid residue, which causes a 1,000-fold decrease in affinity at the STX-binding site in the sodium channel pore of resistant clams (Bricelj et al., 2005). Histological observations of tissues of mussels and oysters exposed to PST producers indicated the presence of hemocytes in the gills, as well as degeneration of muscle tissue (Galimany et al., 2008; Haberkorn et al., 2010). Although PST-producing Alexandrium tamarense did not affect the survival and metamorphosis of the scallop Argopecten irradians concentricus at its early development stages, scallop activity, including mobility of D-shape larvae, attachment and climbing ability of juveniles, were affected in acute experiments indicating that A. tamarense has a detrimental impact on bivalves at early life stages (Yan et al., 2003).
The transport of PSTs through the food chain and the accumulation of toxins in zooplankton have been identified as important mechanisms by which toxins become available to higher trophic levels (Turner et al., 2000; Durbin et al., 2002; Jiang et al., 2007). Through this process, PSTs have also been confirmed or implicated in the deaths of sea birds, whales and monk seals. In the cases of mass mortality events involving birds, piscivorous birds are the most affected (Landberg, 2002). Lefebvre et al. (2004) examined the effects of dissolved saxitoxin exposure during early developmental stages of fish. Although the observed toxicological effects of STX exposure were reversible, a short-term toxin exposure may negatively impact the survival of fish several weeks later.
1.3. Bioaccumulation processes
12
environment. Considering that these processes take place simultaneously and direct measurements are unfeasible, predicting toxic concentrations in an organism requires the use of an indirect approach, such as dynamic modelling. In a one-compartment model the bioaccumulation process can be seen as a balance between two kinetic processes, uptake and depuration, as quantified by first-order rate constants K1 and K2, respectively (Figure 1.2)
(Connell and Miller, 1984).
Figure 1.2. Schematic representation of a one-compartment model for bioaccumulation (adapted
from Connell and Miller, 1984).
The rate of change of toxin concentration in an organism is given by:
B E
B
K
C
K
C
dt
dC
2
1
(1.1)where CB is the biotic concentration, CE the concentration in the environment and t the
time.
In a two-compartment model, digestive gland and associated tissues (viscera) form the compartment where toxins first enter in the organism and other tissues receiving toxins from the viscera the second compartment (Silvert and Cembella, 1995; Yu et al., 2005). More complex models involving enzymatic transformation, environmental variables or more than one compartment in mussels have been tested (Blanco et al., 1997, 2003; Li et al.,2005; Yu et al., 2007).
1.3.1. Uptake of PSTs
The ability of bivalves to accumulate toxins may depend largely on clearance rates, Depuration
Organism Uptake
Environment K1 CB K2
Depuration Organism
Uptake
13
individual species` capabilities for selective ingestion and/or absorption of toxic cells, as well as the density and distribution of the toxic dinoflagellates in the water column (Shumway et al., 1985). Clearance rate representing filtration ability provides a useful index to compare the toxin sensitivity and, thus, the potential for uptake by various species (Shumway and Cucci, 1987; Bricelj et al., 1991). In particular, the mussel Mytilus edulis can maintain a relatively constant feeding rate over a wide range of acclimation temperatures (ca. 10 to 20oC), therefore, toxin uptake in this species is likely to be less affected by geographical or seasonal differences in temperature than in species where clearance rate is strongly influenced by seasonal temperature (Bricelj and Shumway, 1998). In addition, clearance rate can be used to compare the response within a species to variations in dinoflagellate cell density (Bricelj et al., 1996). The species-specific differences in the clearance rate found by Contreras et al. (2011) during short-term exposure to PSTs in five bivalve species of New Zealand were reflected in the total content of toxins in the tissues. The scallop Pecten novazelandiae and the clam Paphies donacina decreased their clearance rates in the presence of Alexandium tamarense and also accumulated fewer toxins in their tissues than the most resistant bivalves (Perna canaliculus and Dosinia anus).
As with organic matter, not all the toxin contained in phytoplankton cells is absorved by the bivalve. The main variables that seem to control the process are the gut transit time (the time the food is maintained in the digestive system) and the digestibility and/or the post-ingestive selection of the toxic cells (Moroño et al., 2001). One important factor affecting the assimilation of toxins is the relative amount of toxins (in relation to the total seston volume) available in the food (Moroño et al., 2001). These authors argued that the toxin assimilation efficiency is regulated mainly by the probability of contact between toxins and cellular walls of the digestive system.
14
et al., 1996), and the history of toxic algal bloom exposure in any given ecosystem (Shumway and Cucci, 1987).
1.3.2. Biotransformation of PSTs
Cell extracts of PST-producing dinoflagellates are capable of enzymatically modifying PSTs. Oshima et al. (1995b) showed that GTX2+3 can be converted into GTX1+4 by incubation with Alexandrium tamarense homogenate. In addition, the introduction of a sulfate moiety on the carbamoyl group, resulting in the formation of C1 and C2 toxins, has been shown following incubation with G. catenatum homogenate. In dinoflagellates, biotransformation is likely to occur via PST tailoring enzymes which are a part of the PST biosynthesic pathway (Wiese et al., 2010).
15
from Peronidia venulosa confirmed the conversion of the carbamoyl or N-sulfocarbamoyl moieties of PSTs through enzymatic hydrolysis (Lin et al., 2004; Cho et al., 2008).
Biotransformation of the PSTs by bacteria was first suggested by Kotaki and co-authors who proposed that marine bacteria, such as Vibrio and Pseudomonas spp., are capable of metabolizing PSTs (Kotaki et al., 1985). The ability of bacteria to degrade PSTs has been further described by Smithet al. (2001), who screened marine bacterial isolates from various bivalve species for their ability to metabolize a range of PSTs suggesting that bacteria may play an important role in the clearance of PSTs from bivalves.
1.3.3. Elimination of PSTs
Feeding experiments with toxic algae are commonly used to estimate depuration rates in laboratory assays (Bricelj et al., 1991; Blanco et al., 2003; Estrada et al., 2007). Depuration studies with natural contaminated bivalves after a toxic bloom are much less documented (Blanco et al., 1997; Botelho et al., 2010a). The relevance of assessing depuration kinetics in bivalves previously exposed to toxins comes from the importance to predict the time required to reduce the total PST concentration to a level that is safe for human consumption. Depuration rates of PSTs vary greatly among bivalve species. For example, depuration of PSTs in the mussel Mytilus edulis is relatively fast (Bricelj and Shumway, 1998), whereas removal of toxins from the butter clam is comparatively slow due to the strong binding of the siphon tissue with the toxin STX (Beitler and Liston, 1990). Once incorporated by a bivalve, PSTs will be transported differentially to various tissues, from which they are eliminated at varying rates (Yu et al., 2005). In general, PSTs accumulate at highest levels in the viscera of bivalves, but the ranking of toxicity among tissues often shifts during depuration (Bricelj et al., 1990). Several studies have also shown that depuration occurs most rapidly in the viscera (e.g., Waiwood et al., 1995).
16
species such as Saxidomus giganteus and Spisula solidissima (Bricelj and Shumway, 1998). A better fit to the data, and more accurate prediction of the time required to reach safety levels for human consumption, was provided in some cases by a biphasic detoxification model, consisting of an initial more rapid detoxification phase and subsequent slower (exponential) phase of toxin elimination (Bricelj and Cembella, 1995; Silvert and Cembella, 1995). It has been suggested that the initial detoxification phase represents gut evacuation of unassimilated toxin, whereas the second phase represents the release of toxins assimilated and incorporated in tissues (Bricelj and Shumway, 1998).
Various studies reported the accumulation and depuration profiles of individual PSTs (C1, C2, GTX1, GTX2, GTX3, GTX4, dcGTX2, dcGTX3, dcSTX, STX and NEO) after exposure to
Alexandrium species or G. catenatum (Sekiguchi et al., 2001; Choi et al., 2003; Samsur et al., 2006, 2007). However, the elucidation of how individual PSTs behave during depuration was mainly focused on the toxins C1, C2, GTX1, GTX2, GTX3, GTX4, STX and NEO, which are characteristic of bivalves exposed to Alexandrium spp. (Ichimi et al., 2001; Blanco et al., 2003). Botelho et al. (2010a) studied the depuration kinetics of B1, dcSTX and dcGTX2+3, which are characteristic of the toxin profile in bivalves exposed to G. catenatum, under depuration laboratory conditions and over a declining bloom of the dinoflagellate in the field.
1.3.4. Responses at organism level to accumulated toxins
17
tamarense, predominantly C2 toxins. It appears that not all the antioxidant parameters showed responses to the increasing PST concentrations. In particular, clams showed considerable variations in their antioxidative responses. In a study with giant lions-paw scallops (Nodipecten subnodosus) exposed to G. catenatum, the digestive gland showed higher CAT and glutathione peroxidase (GPX) activities than other tissues (Estrada et al., 2007).
The sub-cellular distribution of domoic acid (ASP toxin) in the digestive gland cells suggests that it is weakly bound or free in the cytosol (Mauriz and Blanco, 2010). The sub-cellular partitioning of okadaic acid (DSP toxin) in the digestive gland of Mytilus galloprovincialis indicates its association with high-density lipoproteins (Rossignoli and Blanco, 2010). This approach was not used to provide better knowledge in the distribution and linkage of PSTs in bivalve tissues.
1.4. Effects of ingested PSTs on humans
18
(Anderson, 2009). While numerous fatal cases of PSP have been reported globally, the successful implementation of monitoring programs in many countries has helped to reduce human illnesses and fatalities (Etheridge, 2000).
Figure 1.3. The global expansion in the distribution of PSTs in bivalves and PSP episodes - 1970 versus 2005. (Credit: U.S.
National Office for Harmful Algal Blooms, Woods Hole Oceanographic Institution, Woods Hole, MA; adapted from
Anderson, 2009)
1.5. Monitoring of toxin-producing species and bivalve toxicity
1.5.1 Design of monitoring programmes
19
was the first step to select the best species to be used in surveillance programmes. Species that rapidly achieve elevated toxin levels when exposed to toxic algae, such as Mytilus spp., are suitable as sentinel organisms providing early warning of a bivalve toxicity episode. This species has long been used as the primary indicator for monitoring levels of PSTs in several geographic areas. This ability was confirmed in coastal waters of Maine, USA, since PST levels in Mytilus edulis occurred several days earlier than those in Mya arenaria, thus providing an adequate protection of harvesting of this species. It is also known that M. edulis generally becomes 2 to 4 times more toxic than neighbouring Mya arenaria (Bricelj and Shumway, 1998).
Monitoring bivalve toxicity provides a valuable, time- and space- integrated historical record of the occurrence and intensity of toxic blooms. Continuous time series of PST toxicity for the same bivalve species sampled at the same location are useful to learn about possible seasonal and multi-annual trends of toxicity episodes.
1.5.2. Closure of legal harvest of bivalves
20
the European Commission to Spain in areas where the PST level in edible parts of those molluscs is between 800 and 3000 μg per kg tissue, if heat treatment is carried out (EC, 1996).
1.6. Economic impact of PSTs
The toxicity episodes by PSTs have a array of economic impacts, including the costs of conducting monitoring programmes for bivalves and other affected resources, short- and long-termed closure of harvestable bivalves, reductions in seafood sales, mortalities of wild and farmed fish, impacts on tourism and tourism-based related businesses, and medical treatment of exposed populations (Anderson et al., 2009). The annual cost of monitoring PSTs in the Bay of Fundy and British Columbia, Canada, was valued at US $102 K and $82 K, respectively, representing about 4 to 5% of the value of shellfish harvested in 1988 (Cembella and Todd, 1993). As example of single PST episodes, the total economic loss to the oyster industry on the Pacific U.S. coast in 1980 was estimated at US $ 0.6 million, and an 8-month closure on mussel harvesting in the Philippines in 1983, resulted in an estimated loss of $US 2.2 million (Bricelj and Shumway, 1998).
1.7. The Portuguese situation
21
areas (Mytilus spp., Cerastoderma edule, Ruditapes decussatus, Venerupis pullastra,
Scrobicularia plana, Ensis spp., Solen spp., Venus verrucosa, Ostrea spp., Crassostrea spp., Spisula solida, Donax trunculus, Ensis siliqua, Callista chione and Chamelea gallina) (IPMA database, 2014).
A review of marine toxin monitoring in bivalves from Portugal between 1986 and 2006 indicated that PSTs occurred intermittently in autumn (Vale et al., 2008). In recent years, high concentrations of PSTs in bivalves have been sporadically registered (IPMA database, 2014).
1.8. Motivation and objectives
The first works on marine toxins were focused on the assessment of bivalve toxicity in order to protect human health. Whole bivalve toxicity was first assessed through bioassays. As chemical methodologies were improved, bioassays were progressively substituted by analytical procedures providing the possibility to quantify individual toxins, and thus to characterise the toxin profiles both in algae and bivalves. Paralytic shellfish poisoning is a key issue due to severity of symptoms in humans. In addition, toxin-producing species may produce a variety of paralytic shellfish toxins, some of them poorly documented. Individual quantification of those toxins, in particular the less documented compounds, or those that are recurrently found in bivalves from the Iberian waters, will help to elucidate tissue partitioning of toxins, kinetics, and transformation mechanisms of the assimilated toxins.
This thesis focused on the accumulation of PSTs in commercial bivalve species harvested in Portuguese estuarine and coastal waters, including kinetics of assimilated toxins, sub-cellular partitioning, and differences in profiles of PSTs between bivalves exposed to G. catenatum blooms and bivalves with low toxicity values. Moreover, an overview of the occurrence of PSTs episodes in Portugal was carried out, as well as the linkage between nutrient composition and toxins in bivalves.
22
To search differences between uptake and depuration kinetics of the major toxins produced by G. catenatum cells (dcGTX2+3, dcSTX, B1, C1+2) in the clam Ruditapes decussatus; the selection of this species is related to the high production in Portugal;
To test whether nutrient concentration and composition influence the abundance of toxic dinoflagellates and consequently the bivalve toxicity; this hypothesis was tested in a eutrophic lagoon and adjacent coastal waters with recurrent toxicity episodes;
To investigate the sub-cellular partitioning of the major toxins produced by G. catenatum cells (dcGTX2+3, dcSTX, B1, C1+2) in the cockle Cerastoderma edule, under post-bloom natural conditions; this species is highly abundant in estuarine and coastal lagoons;
To examine the inter-annual and seasonal variation of bivalve toxicity episodes by PSTs in the Portuguese waters; the commercial bivalve species Spisula solida, Donax trunculus, Mytilus spp., Cerastoderma edule were considered.
To compare profiles of PSTs between bivalves exposed to G. catenatum blooms and bivalves of low toxicity; differences between these two circumstances were examined in Spisula solida, Donax trunculus, Mytilus spp., and Cerastoderma edule
from Portuguese waters.
1.9. Dissertation outline and content
23
Botelho, M.J., Vale, C., Grilo, R.V., Ferreira, J.G., 2012. Uptake and release of paralytic shellfish toxins by the clam Ruditapes decussatus exposed to
Gymnodinium catenatum and subsequent depuration. Marine Environmental Research 77, 23-29.
Pereira, P., Botelho, M.J., Cabrita, M.T., Vale, C., Moita, M.T., Gonçalves, C., 2012. Winter-summer nutrient composition linkage to algae-produced toxins in shellfish at a eutrophic coastal lagoon (Óbidos lagoon, Portugal). Estuarine Coastal and Shelf Science 112, 61-72.
Botelho, M.J., Raimundo, J., Vale, C., Ferreira, J.G., 2014. Partitioning of paralytic shellfish toxins in sub-cellular fractions of the digestive gland of the cockle
Cerastoderma edule: Changes under post-bloom natural conditions. Ecotoxicology and Environmental Safety 104, 365-372.
Botelho, M.J., Vale, C., Ferreira, J.G. Identification of seasonal and multi-annual trends of bivalve toxicity by PSTs in Portuguese estuarine and coastal waters. Estuarine, Coastal and Shelf Science, in submission.
Botelho, M.J., Vale, C., Ferreira, J.G. Profiles of paralytic shellfish toxins in bivalves of low and elevated toxicities following exposure to Gymnodinium catenatum blooms in Portuguese estuarine and coastal waters. Chemosphere, in submission.
24
25
2. Methodologies
2.1. Algal cultures
2.1.1. Gymnodinium catenatum
The culture of the dinoflagellate Gymnodinium catenatum (strain C37-07, Figure 2.1) was obtained from the IPMA algae collection and was originally isolated in 2007 from the adjacent coastal area of Aveiro, Portugal. This strain was maintained in natural seawater enriched with GSe medium (salinity 28, Blackburn et al., 2001) at 18oC under a 16 h light: 8 h dark photocycle with a light intensity of 15 µE m-2 s-1. The strain was then mass cultured in 10 L culture flasks under the same conditions. Cells of the toxic microalgae were counted in Palmer-Maloney chambers under an Zeiss IM 35 inverted microscope (Hallegraeff et al., 1995).
Figure 2.1. Light microscopy photo of Gymnodinium catenatum; marine toxic algae collection (IPMA, ex-IPIMAR); scale bar=30 µm
2.1.2. Isochrysis galbana
The non-toxic microalga Isochrysis galbana was grown in Wallerstein and Miquel medium (Bandarra et al., 2003) at 18oC in 75 L plastic bags under constant illumination at salinity 25. Cells of I. galbana were counted in an automatic particle counter (Coulter EPICS
2
26 XL).
2.2. Collection and processing of samples
2.2.1. Algal culture
Aliquots of 400 mL G. catenatum culture were harvested in the late exponential growth phase. Algal mass was obtained by filtering the culture under light vacuum pressure (100 mmHg) through GF/C glass filters (1.2 µm), and freezing in 0.1 M acetic acid at -80oC
until toxin analyses.
2.2.2. Seawater
Surface water samples were collected for phytoplankton identification, cell counting and toxin analysis. The samples for phytoplankton identification and cell counting were preserved in Lugol’s solution immediately after collection. The samples for toxin analysis passed through a GF/C glass filters (1.2 µm), under light vacuum pressure (100 mmHg), and the material retained in the filters was frozen in 0.1 M acetic acid at -80oC until analysis.
Water samples for measure of phytoplankton biomass as chlorophyll a (Chl a) concentration, and for nutrient determination were collected at surface (0.5 m), middle (10 m) and bottom (20 m) at each sampling site. For Chl a quantification, samples were filtered through GF/F glass filters and frozen at -20oC until analysis. Samples were filtered through MSI Acetate Plus filters for determination of nutrients.
2.2.3. Particulate organic matter
27
2.2.4. Bivalves
Whole soft tissues. Bivalves from three pools of 10 specimens each were dissected and composite samples (n=10) of whole soft tissues were weighed and stored at -80oC until
toxin analyses.
Digestive glands. Bivalves were dissected and composite samples of digestive glands (three pools of 10 specimens) were weighed and frozen at -80oC until toxin analysis.
2.2.5. Sub-cellular fractionation of digestive glands
For sub-cellular toxin analyses, bivalve digestive gland samples were homogenised in a buffer solution and subjected to differential fractionation (Figure 2.2) according to the procedure adopted from Campbell et al. (2005) and Raimundo et al. (2008).
Treatment of samples. The digestive gland composite samples were placed in an ice bath and homogenised in a buffer solution (5 mL of buffer g-1 of digestive gland), consisting
of 0.1 M Tris-HCl and ammonium formate 0.15 M to a final pH of 7.8 (Mauriz and Blanco, 2010; Raimundo et al., 2008). The homogenisation was completed in 3 min at 11000 rpm in a Polytron Kinematica AG homogenizer (Rossignoli and Blanco, 2010). A 3 g aliquot of the homogenate tissue was taken as initial sample for toxin extraction and the remaining homogenate was used for differential fractionation.
Differential fractionation. The aliquots of each homogenate pool of digestive glands were transferred to centrifuge tubes. The homogenate was first fractioned by centrifugation at 700 x g for 15 min at 4oC to separate the nuclei, granules and plasmatic membranes, designated as "nuclei+debris" fraction (P1); the supernatant was further centrifuged at 9 000 x g for 20 min at 4oC to separate the mitochondria fraction (P2); the lysosomes (P3),
and microsomes (P4) fractions were obtained by centrifuging the supernatant at 30 000 x g for 25 min, and at 100 000 x g for 40 min at 4oC, respectively. The remained soluble part,