PATROCINADORES MEDIA PARTNER EDIÇÃO
10.º SEMINÁRIO SOBRE
ÁGUAS SUBTERRÂNEAS
É v o r a , 9 e 1 0 d e a b r i l d e 2 0 1 5 | U n i v e r s i d a d e d e É v o r aLIVRO DE RESUMOS
do 10.º Seminário sobre
Águas
Subterrâneas
APOIANTES CÂMARA MUNICIPAL DE ÉVORAM
IN
Á
R
IO
S
O
B
R
E
Á
G
UA
S
S
UB
T
E
R
R
Â
N
EA
S
LI
VR
O DE R
ESUM
OS
Maria do Rosário Carvalho (CEAS, FC/UL)
José Paulo Monteiro (CEAS, NRSul/APRH, FCT/UAlg) J. Martins de Carvalho (CEAS, TARH)
Paulo Chaveiro (NRSul/APRH, CM Reguengos de Monsaraz) Ana Rosária Gonçalves (NRSul/APRH, APA/ARH do Alentejo) Luís Dias (NRSul/APRH, Prospectiva)
António Chambel (NRSul/APRH, UÉ)
Cândida Martins (NRSul/APRH, CM Montemor-o-Novo) Jorge Mestrinho (NRSul/APRH, CM Montemor-o-Novo) Sandra Dias (NRSul/APRH, Águas do Algarve, S.A.) Nelson Carriço (NRSul/APRH, IP Setúbal)
Hortência Menino (NRSul/APRH, CM Montemor-o-Novo) Jorge Duque (GGT Lda)
APOIO TÉCNICO E DE SECRETARIADO Conceição Martins (APRH) André Cardoso (APRH)
Comissão Especializada de Águas Subterrâneas Núcleo Regional do Sul
É v o r a , 9 e 1 0 d e a b r i l d e 2 0 1 5 | U n i v e r s i d a d e d e É v o r a
INTERPRETATION OF AN INJECTION TEST IN A LARGE
DIAMETER WELL IN SOUTH PORTUGAL AND CONTRIBUTION TO
THE UNDERSTANDING OF THE LOCAL HYDROGEOLOGY
Luís R.D. COSTA1, José Paulo MONTEIRO1, Manuel M. OLIVEIRA2, João Paulo LOBO FERREIRA2, Teresa E. LEITÃO2, Tiago CARVALHO3, José MARTINS DE CARVALHO3, Rui AGOSTINHO3
1. Centro de Ciências e Tecnologias da Água, Universidade do Algarve, Campus de Gambelas, 8005-139 Faro, [email protected], [email protected]
2. Laboratório Nacional de Engenharia Civil (LNEC), Av. do Brasil, 101, 1700-066 Lisboa, [email protected],
[email protected], [email protected]
3. Terra, Ambiente e Recursos Hídricos (TARH), Rua Forte Monte Cintra 1B3, Sacavém, [email protected], [email protected], [email protected]
ABSTRACT
This paper refers to the interpretation of an injection test in a traditional large diameter well in Querença-Silves aquifer, south Portugal, under the scope of the project FP7-ENV-2013-WATER-INNO-DEMO MARSOL. Hydraulic parameter estimates were found within a high level of uncertainty regarding aquifer and well configuration. Given the injection test results together with the knowledge acquired on the field and from previous well logs and pumping tests on this aquifer section, it seems plausible to assume that the water injected in the well is locally flowing to an opposite direction to the regional aquifer flow. This forcing could possibly be caused by the existence of a local confinement or aquitard separating the injection well from the regional aquifer, or simply due to local scale heterogeneities and fracturation patterns.
Palavras-Chave: Injection test; Hydraulic parameter estimation; Managed aquifer recharge; karstic aquifer. 1. INTRODUCTION
Managed Aquifer Recharge (MAR) or artificial aquifer recharge is a solution more commonly used when tackling water scarcity and quality issues. Dillon et al. (2009) defines MAR as the purposeful recharge of water to aquifers for subsequent recovery or environmental benefit. MAR is achieved through artificial recharge engineered systems where water is put either on or in the ground for infiltration into aquifers. These systems aim to augment groundwater resources, reduce seawater intrusion or land subsidence, store water, improve the quality of the water through soil-aquifer treatment, use soil-aquifers as water conveyance systems, and to make groundwater out of surface water where groundwater is traditionally preferred over surface water for drinking (Bouwer, 2002).
In Portugal, under the scope of the European project FP7-ENV-2013-WATER-INNO-DEMO MARSOL, initiated at December 1st 2013, it is intended to advance the use of MAR as a sound, safe and sustainable strategy to improve water security by demonstrating that MAR is a key solution to water scarcity in Portugal and in the Mediterranean regions. In this perspective, several MAR tests have been performed at the MARSOL project demo site. One of this tests was performed in the Portuguese demo site PT2_6 Cerro do Bardo (CB), where a large diameter traditional well is located in the karst Querença-Silves (QS) aquifer in Algarve, south Portugal. The aim of this demo site is to increase the groundwater storage using MAR by infiltrating surplus of surface water during wet years into a large diameter well and dam facility, thus, contributing to increase the water availability in dry years.
Within this paper it is intended to summarize the added knowledge acquired during the MARSOL project regarding the hydrogeological behaviour and the conceptual model of the CB well – groundwater system. Furthermore, previous knowledge regarding the hydrogeological setting and aquifer parameters based on well logs and pumping tests are analysed and compared with the recent knowledge acquired during MARSOL activities, particularly through the contact with local inhabitants, execution of an injection test and the interpretation and determination of the aquifer’s parameters based on this injection test.
2. SITE DESCRIPTION
The karst aquifer system QS is one of the most important freshwater reservoirs in the Algarve. This region is characterized by a Mediterranean climate, with hot dry summers and cold wet winters, average temperature around 17.5 ºC and annual precipitation varying from 650 to 740 mm. QS aquifer system is set in early and middle Jurassic
É v o r a , 9 e 1 0 d e a b r i l d e 2 0 1 5 | U n i v e r s i d a d e d e É v o r a
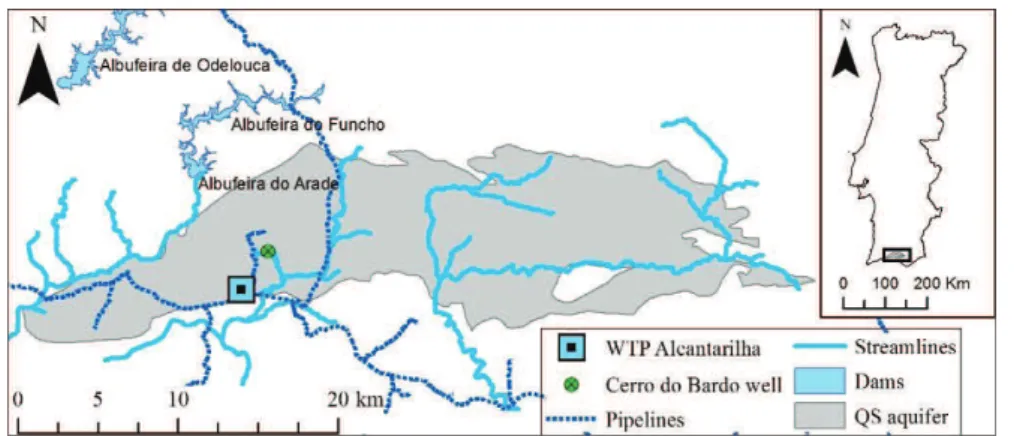
“PT2_6 poço do Cerro do Bardo” is located in the Weastern sector of the QS aquifer, close to the villages of Alcantarilha and Algoz (Figure 1). In order to obtain early estimates for the well infiltration rate capacity, an infiltration test with 40 m3 of water was performed in the large diameter well at CB. The source water was provided by the Municipal Firefighters from the city of Silves.
Figure 1. Location of CB well and other infrastructures of interest to the demo site PT2_6.
APA-ARH Algarve supplied a database of well logs and pumping tests in this region. A total number of 23 well logs and 46 pumping tests within 8 km radius from CB well were found and analysed.
The well logs analysis aimed to study the possibility of existing a confining or lower permeability layer where CB well is located. According to this analysis, 2 well logs to Southeast were found with a clay layer formation on the surface. Clay layers in depth were found in well logs to East-Northeast. The remaining well logs indicated limestone layer formations in general. This information is unable to give a confident geological setting at the CB, though there is possibly a lower permeability layer of clay which is getting deeper from Southwest to Northeast. In this case, the local water flow direction could follow this same direction, opposite to the observed regional flow.
The available data for pumping tests were analysed and their transmissivity estimated according to Logan’s simplification for confined aquifers (Logan, 1964). The arithmetic average transmissivity for the 46 pumping tests is 2580.26 m2/day, with a median of 904.06 m2/day and minimum and maximum values of 6.76 and 36892.80 m2/day respectively. Within these values, the closest wells to the CB present transmissivities of 2386 and 1413 m2/d, and are at a distance of around 500 and 1000 m respectively.
3. INJECTION TEST AND FIELD WORK RESULTS Local inhabitants
Local inhabitants with wells living within a 750 meters radius from the CB well were contacted in order to obtain a better understating of the local piezometry and hydrogeology through the behaviour of their wells. According to all the locals contacted, upon the drilling of the well water was first found at around 30 to 40 meters depth with very low pressure. Beyond this depth, the water pressure would then increase, indicating the existence of a confining or lower transmissivity layer at that depth. It was also found that during heavy rainfall events, the abstractions to East and Northeast of the CB well present a silty/turbid water as opposed to what happens with the abstractions to South and West, suggesting there is a local flow in this same direction.
Injection Test
CB well has a depth of 32 meters and a diameter of 2 meters. In order to obtain early estimates for the well infiltration rate capacity, an infiltration test with a flow of 125.20 m3/h and 40 m3 of water was performed on the well (during approximately 19 minutes). The injection of water has produced a maximum water rise of 6.38 m though stabilization of the water level has not been achieved. The injection test is thoroughly described in Leitão et al. (2015). Table 1 summarizes the estimated infiltration rate for the recovery period of the injection test.
Table 1 Results of the recovery period from the injection test. Water displacement and infiltration rate.
Time (hours) 1 2 3 4 5 6 7
Δh (m) 3.28 0.88 0.51 0.36 0.26 0.18 0.14
É v o r a , 9 e 1 0 d e a b r i l d e 2 0 1 5 | U n i v e r s i d a d e d e É v o r a
As can be seen from Figure 2 results indicate an expected relation between the infiltration rate and the hydraulic load in the well (i.e. water level in the well).
Figure 2. LEFT: Records for water displacement in the well as a function of time. RIGHT: Scatter plot between hydraulic load and infiltration rate and its linear fits.
Two different phases can be evidenced from Figure 2-Right in the relation between the infiltration rate and the hydraulic load. The first one is set by lower hydraulic load (up to around 3.25 m), in which infiltration rate can reach up to 25 m/d. The second phase, for higher hydraulic loads (above 3.25 m) originates infiltration rates higher than 25 m/d, reaching, in this test, a maximum of 211 m/d, at 6.35 m. The two linear fits identified could possibly be associated with the existence of a double porosity system, to the wellbore storage, or to existing infiltrating conditions inside the well above 3.25 m displacement elevation.
Parameter estimation with MLU software
When working on problems of groundwater flow, the geologist or engineer has to find reliable values for the hydraulic characteristics of the geological formations which control the groundwater flow. Pumping tests have proved to be one of the most effective ways of obtaining such values (Kruseman et al., 1990). Detailed insight and methodologies on solution methods for different configuration pumping tests can be found in bibliography. Injection tests are considered conceptually identical to pumping tests, except that flow is into the well rather than out of it (Horne, 1990; Kruseman et al., 1990). Notwithstanding, there is generally a tendency to increase hydraulic conductivity when extracting and to decrease hydraulic conductivity during injection. Extraction removes fines whereas injection may create clogging. In order to better understand the factors controlling the infiltration of water in the well into the aquifer and estimate aquifer parameters (transmissivity and storage) and well parameters (storage and skin factor), an aquifer parameter analysis was performed with the support of the aquifer test analysis software MLU version 2.25.63 (Hemker & Post, 2014), which consists of an analytical groundwater modelling tool to compute drawdowns, analyse well flow and aquifer test data based on a single analytical solution technique for well flow which can be applied on multi-layered aquifer systems.
Due to the high level of uncertainty regarding both the aquifer and the well configuration, a sensitivity analysis was performed, considering several possible aquifer and well configurations. From the sensitivity analysis, transmissivity values were found ranging from 14.99 to 36.64 m2/day and storage coefficient from 7.09x10-02 to 6.38x10⁻¹. The configuration that shows the best fit between the calculated and observed data is the one which considers the well is installed on an upper unconfined aquifer with thickness 10.75 m (being equal to the total saturated height inside the well). For this configuration, transmissivity for the top layer is estimated as 18.45 m2/d with a standard deviation of 2.518 m2/d. Figure 3 shows the correlation between the observed and calculated drawdown data of the injection test for this configuration.
É v o r a , 9 e 1 0 d e a b r i l d e 2 0 1 5 | U n i v e r s i d a d e d e É v o r a
4. CONCLUSIONS
There lies a high degree of uncertainty regarding the Cerro do Bardo well characteristics, the local aquifer geometry and the connection between the well and the aquifer. On one hand, the information supplied by the local inhabitants suggests that flow in the area is from West to East, opposing to the regional flow. Also, it appears there is a confining or lower permeability layer at around 30 to 40 meters depth, which coincides with the Cerro do Bardo wells depth. This probably means the well is not in direct contact with the regional aquifer or any of its karst conduits. With the support of MLU software several possible aquifer and well configurations were simulated, achieving transmissivity values ranging from 14.99 to 36.64 m2/day. The best suited fit was achieved at transmissivity value of 18.45 m2/day. Although the results obtained from the analytical models for interpreting pumping tests suggest Cerro do Bardo well is locally separated from the regional aquifer by an implicit local aquitard or a confining layer, we do understand that the non-uniqueness of the factors contributing for the observed hydraulic responses, as well as preliminary geophysics experimental results gathered by LNEC at the test site, allows us to have doubts related to the non-connectivity in localized areas. In these areas the regional aquifer and the top aquifer would be in direct contact. If this is the case, then the MAR into the well would be directly incorporated in the regional aquifer, for later use down-gradient. Further experiments are foreseen at Cerro do Bardo, during MARSOL project, to overcome these doubts.
ACKNOWLEDGMENTS
The research leading to these results has received funding from the European Union Seventh Framework Programme (FP7/2007Ǧ2013) under grant agreement no 619120 (Demonstrating Managed Aquifer Recharge as a Solution to Water Scarcity and Drought – MARSOL). We thank Agência Portuguesa do Ambiente (APA-ARH Algarve) and Águas do Algarve (AdA) for all their support during this project. Special thanks to C. J. Hemker, for the support on using MLU (Hemker CJ, Post V, 2014) and the advices and feedback given on the interpretation of the well injection test.
BIBLIOGRAPHIC REFERENCES
Bouwer H (2002) Artificial recharge of groundwater: hydrogeology and engineering. Hydrogeology Journal, 10:121-142.
Dillon P, Pavelic P, Page D, Beringen H, Ward J (2009) Managed Aquifer Recharge: An Introduction.
Waterlines Report No 13. National Water Commission. Disponível em
http://archive.nwc.gov.au/__data/assets/pdf_file/0011/10442/Waterlines_MAR_completeREPLACE.pdf Hemker CJ, Post V (2014) MLU for Windows. Well flow modeling in multilayer aquifer systems. MLU Users
Guide, 2014. Available at www.microfem.com
Horne RN (1990) Modern Well Test Analysis: A Computer-Aided Approach. Petroway Inc., Palo Alto, USA, 185.
Hugman R, Stigter T, Monteiro JP (2013) The importance of temporal scale when optimizing abstraction volumes for sustainable aquifer exploitation: a case study in semi-arid South Portugal. Journal of Hydrology. Available online 13 March 2013.
Kruseman GP, De Ridder NA, Verweij JM (1990) Analysis and evaluation of pumping test data (2nd ed.). International Institute for Land Reclamation, 377p.
Leitão TE, Lobo Ferreira JP, Oliveira MM, Martins T, Henriques MJ, Carvalho TM, Martins de Carvalho J, Agostinho R, Monteiro JP, Costa LRD (2015) Deliverable 4.2 South Portugal MARSOL Demonstration Sites Characterisation. EU MARSOL Projet - Demonstrating Managed Aquifer Recharge as a Solution to Water Scarcity and Drought, 78 pp.
Logan J (1964) Estimating transmissivity from routine production tests of water wells. Groundwater, 2: 35-37. Monteiro JP, Vieira J, Nunes L, Younes F (2006) Inverse Calibration of a Regional Flow Model for the
Querença-Silves Aquifer System (Algarve-Portugal). Integrated Water Resources Management and Challenges of the Sustainable Development. International Association of Hydrogeologists, IAH. Marrakech. pp 44, doc. Elect. CD-ROM - 6pp.
Monteiro JP, Ribeiro L, Reis E, Martins J, Matos Silva J (2007) Modelling Stream-Groundwater Interactions in the Querença-Silves Aquifer System. XXXV AIH Congress. Groundwater and Ecosystems. Lisbon. Portugal. pp 41-42, doc. Elect. in CD Rom. 10pp