U m in ho | 2 01 3 A n a R ib e ir o 3 -B ro m op yr uv at e as a n an ti ca nc er a ge nt in b re as t ca nc er c el l l in es : e xp lo ri ng t he r ol e of m on oc ar bo xy la te t ra ns po rt er s Outubro de 2013 Escola de Ciências
Ana Luísa Ferreira Ribeiro
3-Bromopyruvate as an anticancer agent in breast
cancer cell lines: exploring the role of
monocarboxylate transporters
Mestrado em Genética Molecular
Trabalho realizado sob a orientação de:
Professora Doutora Margarida Casal
Professora Doutora Ana Preto
Ana Luísa Ferreira Ribeiro
Outubro de 2013
3-Bromopyruvate as an anticancer agent in breast
cancer cell lines: exploring the role of
monocarboxylate transporters
Mestrado em Genética Molecular
Trabalho realizado sob a orientação de:
Professora Doutora Margarida Casal
Professora Doutora Ana Preto
Nome: Ana Luísa Ferreira Ribeiro
Endereço electrónico: ribeiro.aluisa@gmail.com Nº do Bilhete de Identidade: 13539435 Título da Dissertação de Mestrado:
3-Bromopyruvate as an anticancer agent in breast cancer cell lines: exploring the role of monocarboxylate transporters
Orientadores:
Professora Doutora Margarida Casal Professora Doutora Ana Preto
Instituição de Acolhimento:
Centro de Biologia Molecular e Ambiental (CBMA)
Ano de Conclusão: 2013 Designação do Mestrado:
Mestrado em Genética Molecular
É AUTORIZADA A REPRODUÇÃO PARCIAL DESTA DISSERTAÇÃO, APENAS PARA EFEITOS DE INVESTIGAÇÃO, MEDIANTE DECLARAÇÃO ESCRITA DO INTERESSADO, QUE A TAL SE COMPROMETE.
Universidade do Minho, 31 de Outubro de 2013 ____________________________________________ Ana Luísa Ferreira Ribeiro
iii
Agradecimentos
Expresso a minha gratidão a todas as pessoas que, direta ou inderetamente, contribuiram para a concretização deste trabalho. Gostaria de registar o meu sincero agradecimento:
Às minhas orientadoras, Professora Doutora Margarida Casal e Professora Doutora Ana Preto, pela oportunidade única de desenvolver este trabalho nos seus grupos de investigação. Pela orientação, partilha do rigor científico, disponibilidade e ensinamentos transmitidos. Quero agradecer ainda a revisão crítica desta dissertação. O meu muito obrigada por tudo.
Ao João, por toda a disponibilidade, paciência e sugestões diárias na realização do trabalho experimental. Quero ainda agradecer a leitura e crítica desta dissertação. Muito obrigada pela preciosa ajuda durante todo este ano de trabalho.
À Professora Doutora Fátima Baltazar, à Doutora Céline Pinheiro e à Dra. Filipa Santos, pela constante disponibilidade. Muito obrigada.
A todos os meus colegas dos laboratórios de Biotecnologia Molecular e Biologia Animal, pelo excelente ambiente de trabalho, momentos de boa disposição e ensinamentos. Um obrigada para o Raul, André, Mário, Margarida, Joana, Telma e Pedro do LBM e para a Lisandra, Eugénia, Cristina, Carla, Dalila, Ana Luísa, Joana, Rogério, Filipa, Odete e Teresa do LBA. Um agradecimento muito especial à Suellen por toda a disponibilidade, ensinamentos transmitidos e todo o cuidado. Ao Artur Ribeiro, pela disponibilidade e dicas para a realização deste trabalho.
A todos os Professores, investigadores e funcionários do Departamento de Biologia pela disponibilidade em qualquer situação. Muito obrigada.
A todos os meus amigos por estarem sempre presentes. Muito obrigada Paula, Marina, Claúdia, David, Rafael, Hugo e Ângela.
A toda a minha Família pelos valores transmitidos, em especial aos meus pais pelo amor, incentivo, orientação e acima de tudo por acreditarem sempre em mim. A eles dedico este trabalho.
v
3-Bromopyruvate as an anticancer agent in breast cancer cell lines: exploring the role of monocarboxylate transporters
Abstract
The development of a tumor is marked by several metabolic alterations mainly at the glycolytic level. The Warburg effect is reflected into the ability of tumor cells to produce most of their energy from glycolysis even in the presence of oxygen (aerobic glycolysis), leading to an increased production of lactate. The monocarboxylate transporters (MCTs) play a central role in maintenance of high glycolytic rates allowing the efflux of lactate to extracellular environment, which contribute to acidic microenvironment important in the maintenance and tumor progression. The pyruvate analogue, 3-bromopyruvate (3-BP), whose transport can be mediated by MCTs, is an alkylating agent able to inhibit the action of metabolic enzymes, leading to ATP depletion and consequent cell death. In a previous work, our group demonstrated that pre-incubation of breast cancer cell lines with butyrate increased the cytotoxic effect of 3-BP, especially in the ones more resistant to 3-BP, by inducing localization of MCT1 in the plasma membrane, as well as upregulation of MCT4 expression. In the present study, we aimed to characterize the effect of butyrate alone or in simultaneous with 3-BP, in four breast cancer cell lines with different sensibilities to 3-BP and evaluated the expression of MCTs in these conditions. Our results showed that the four human breast cancer cell lines, namely two luminal subtype (ZR-75-1 and MCF-7), one basal subtype (MDA-MB-231) and one HER2+ subtype
(SK-BR-3) presented a distinct basal expression pattern of MCTs. Butyrate induced cell death dependent on its concentration and also increased the expression of MCT4 but not MCT1, more evident in the cell lines more sensitive, namely ZR-75-1 and MCF-7. Regarding the simultaneous treatment, the presence of low dose of butyrate contributed to cytotoxic effect of 3-BP, while the high dose led to an inhibition effect in the ZR-75-1 and MCF-7 cell lines. These results were correlated with increased expression of MCT2 in these conditions. Higher dose of butyrate alone or in combination with 3-BP, increased the number of cells in G1-phase of the cell cycle in the cell line MDA-MB-231, sensitizing cells to the cytotoxic effect of 3-BP. Moreover, we observed that 3-BP reduced the amount of actin in ZR-75-1. In order to understand the role of MCTs in response to 3-BP we started the optimization of the conditions for siRNA-mediated silencing of MCT1 and MCT4 in ZR-75-1, MCF-7 and SK-BR-3 cell lines. The results obtained in this study intend to contribute towards a better understanding of molecular mechanisms of the 3-BP action, and open novel therapeutic possibilities for breast cancer.
vii
3-Bromopiruvato como agente anticancerígeno em linhas celulares de cancro da mama: explorando o papel dos transportadores de monocarboxilatos
Resumo
O desenvolvimento do tumor é marcado por alterações metabólicas principalmente ao nível da glicólise. O efeito de Warburg traduz-se na capacidade das células tumorais produzirem a maior parte da sua energia a partir da glicólise mesmo na presença de oxigénio (glicólise aeróbica), levando à produção aumentada de lactato. Os transportadores de monocarboxilatos (MCTs) desempenham um papel central na manutenção da elevada taxa glicolítica permitindo o efluxo do lactato para o meio extracelular, que contribui para o microambiente acídico importante na manutenção e progressão do tumor. O análogo do piruvato, 3-Bromopiruvato (3-BP), cujo transporte pode ser mediado por MCTs, é um agente alquilante capaz de inibir a ação de enzimas metabólicas, levando à depleção de ATP e consequente morte celular. Num trabalho anterior, o nosso grupo demonstrou que em linhas celulares de cancro da mama a pré-incubação com butirato aumentou o efeito citotóxico do 3-BP, especialmente na linha celular mais resistente, induzindo a localização do MCT1 na membrana plasmática, assim como um aumento da expressão do MCT4. No presente estudo, procurou-se caracterizar o efeito do butirato aplicado sem ou com o 3-BP em simultâneo, em quatro linhas celulares de cancro da mama com diferentes sensibilidades para o 3-BP, e avaliar a expressão dos MCTs nestas condições.
Os resultados mostraram que as quatro linhas celulares humanas de cancro da mama, nomeadamente duas subtipo luminal (ZR-75-1 e MCF-7), uma subtipo basal (MDA-MB-231) e uma subtipo HER2+ (SK-BR-3), apresentaram um padrão de expressão basal de MCTs muito
distinto. O butirato induziu morte celular dependente da concentração, e também aumentou a expressão do MCT4, mas não do MCT1, mais evidente nas linhas celulares mais sensíveis, nomeadamente ZR-75-1 e MCF-7. Relativamente ao tratamento simultâneo, a baixa dose de butirato contribuiu para o efeito citotóxico do 3-BP, enquanto que a elevada dose levou a uma inibição do seu efeito nas linhas celulares ZR-75-1 e MCF-7. Estes resultados foram correlacionados com o aumento da expressão do MCT2 nestas condições. A elevada dose de butirato, aplicado sozinho ou em combinação com o 3-BP, induziu um aumento do número de células em fase G1 do ciclo celular na linha celular MDA-MB-231, sensibilizando as células para o efeito do 3-BP. Além disso, observou-se que o 3-BP reduziu a quantidade de actina nas ZR-75-1. A fim de compreender o papel dos MCTs na resposta ao 3-BP foram optimizadas as condições para o silenciamento mediado por siRNA do MCT1 e MCT4 nas linhas celulares ZR-75-1, MCF-7 e SK-BR-3. Os resultados obtidos neste estudo pretendem contribuir para uma melhor compreensão dos mecanismos moleculares de ação do 3-BP, e abrir novas possibilidades terapêuticas para o cancro da mama.
ix Index Agradecimentos ... iii Abstract ... v Resumo ... vii Index……… ix Abbreviations ... xi Index of Figures ...xv
Index of Tables ... xvii
1. Introduction ... 1
1.1. Hallmarks of cancer ... 3
1.2. Reprogramming the energy metabolism in cancer cells ... 4
1.2.1. Warburg effect in cancer cells ... 4
1.2.2. Molecular mechanisms driving Warburg effect ... 10
1.3. Monocarboxylate transporters ... 11
1.3.1. Function and expression of MCT family ... 14
1.3.2. Genetic regulation of MCT family ... 15
1.3.3. The role of MCTs in cancer ... 16
1.4. Metabolic targeting strategies for cancer therapy ... 17
1.4.1. 3-Bromopyruvate as an anticancer agent ... 20
1.5. Butyrate anti-carcinogenic potential in cancer cells ... 22
1.6. Breast cancer ... 23
2. Rationale and Aims ... 25
3. Materials and Methods ... 30
3.1. Cell lines and culture conditions ... 31
3.2. Preparation of carboxylic acid solutions ... 31
3.3. Treatment conditions ... 32
3.4. Trypan Blue exclusion assay ... 32
x
3.5.1. Total protein extraction ... 33
3.5.2. Protein Quantification ... 33
3.5.3. Western Blot assay ... 34
3.6. Cell cycle analysis ... 35
3.7. Fluorescence microscopy: actin evaluation... 36
3.8. Silencing of MCTs by RNA interference assay ... 37
3.8.1. Optimization of RNAi transfection conditions ... 37
3.8.2. MCT1 and MCT4 silencing by RNAi ... 38
3.9. Statistical analysis ... 38
4. Results ... 39
4.1. Basal expression profile of MCTs and ancillary proteins in breast cancer cell lines ... 41
4.2. Effect of butyrate and 3-BP treatment on cell viability ... 42
4.3. Effect of butyrate and 3-BP treatment on MCTs expression ... 45
4.4. Effect of 3-BP on actin structure ... 48
4.5. Optimization of MCT1 and MCT4 silencing by RNA interference ... 49
4.6. Effect of butyrate and 3-BP treatment on the cell cycle ... 55
5. Discussion ... 57
5.1. MCTs basal expression profile ... 59
5.2. Lower dose of butyrate potentiates the effect of 3-BP in cell lines more sensitive ... 60
5.3. 3-BP induces MCT2 expression in cell lines more sensitive ... 62
5.4. 3-BP reduces the amount of actin in most sensitive cell line ... 63
5.5. Optimization of RNAi conditions for MCT1 and MCT4 silencing ... 63
5.6. Highest dose of butyrate increases the number of cells on G1 phase in MDA-MB-231 cell line... 64
6. Final Remarks and Future Perspectives ... 67
xi
Abbreviations
3-BP - 3-bromopyruvate 5-FU - 5-fluorouracil
18FDG-PET - [18F]-fluorodeoxyglucose positron emission tomography
ACL - ATP citrate lyase AE1 - Anion exchanger 1 AGO2 - Argonaute 2
AIF - Apoptosis-inducing factor Akt - Protein kinase B
AMP - Cyclic adenosine monophosphate AMPK - AMP-activated protein kinase APS - Ammonium persulfate
Ara-C - Cytarabine
ATCC - American Type Culture Collection ATP - Adenosine triphosphate
BCA - Bicinchoninic acid Bcl-2 - B-cell CCL/lymphoma 2 BSA - Bovine serum albumin BRCA1 - Breast cancer 1 gene BRCA2 - Breast cancer 2 gene
BRAF - V-raf murine sarcoma viral oncogene homolog B CA9 - Carbonic anhydrase 9
CG - Core glycosylated
CHC - α-cyano-4-hydroxycinnamate COX - Cytochrome c oxidase
CPE - Choroid plexus epithelia DAPI - 4’,6-Diamidino-2-Phenylindole DCA - Dichloroacetate
DIDS - 4,4’-diisothiocyanostilbene-2,2’-disulphonate DNA - Deoxyribonucleic acid
xii
EMMPRIN - Extracellular Matrix Metalloproteinase Inducer ER - Estrogen receptor
FBS - Fetal bovine serum
FDG - 2-(18F)-fluoro-2-deoxy-D-glucose
FG - Fully glycosylated G6P - Glucose-6-phosphate
G6PD - Glucose-6-phosphate dehydrogenase
GAPDH - Glyceraldehyde-3-phosphate dehydrogenase GLUT - Glucose transporter
HATs - Histone acetyltransferases HCl - Hydrochloric acid
HDAC - Histone deacetylase
HER-2 - Human epidermal growth factor receptor-2 HIF - Hypoxia inducible factor
HIF-1 - Hypoxia inducible factor-1 HK II - Hexokinase II
IC50 - Half maximal inhibitory concentration
IGF-1 - Insulin like growth factor 1 LDHA - Lactate dehydrogenase isoform A MCTs - Monocarboxylate transporters MDBK - Madin Darby Bovine Kidney cells MMP - Matrix metalloproteinases
mRNA - Messenger RNA
mTOR - Mammalian target of rapamycin
NADH - Nicotinamide adenine dinucleotide reduced NADPH - Nicotinamide adenine dinucleotide phosphate
NF-κB - Nuclear factor kappa-light-chain-enhancer of activated B cells NHE - Na+/H+ exchanger
NMR - Nuclear magnetic resonance
NPPB - 5-nitro-2-(3-phenyl-propylamino)-benzoate OMM - Outer mitochondrial membrane
xiii
OXPHOS - Oxidative phosphorylation
pCMBS - p-chloromercuribenzene sulphonate PBS - Phosphate-buffer saline
PBS-T - Phosphate-buffer saline tween-20 PDH - Pyruvate dehydrogenase
PDK1 - Pyruvate dehydrogenase kinase 1 PEP - Phosphoenolpyruvate
PET - Positron emission tomography PFA - Paraformaldehyde
PFK-1 - Phospho-fructokinase-1 PGK - 3-phosphoglycerate kinase PI - Propidium iodide
Pi - Inorganic phosphate
PI3K - Phosphatidylinositol 3-kinase
PIP3 - Phosphatidylinositol-3,4,5-triphosphate PK - Pyruvate kinase
PPP - Pentose phosphate pathway PR - Progesterone receptor
PTEN - Phosphatase and tensin homolog PVDF - Polyvinylidene difluoride
RAS - Rat sarcoma viral oncogene homolog Rib-5-P - Ribose-5-phosphate
RISC - RNA-induced silencing complex RNA - Ribonucleic acid
RNAi - RNA interference ROS - Reactive oxygen species RPE - Retinal pigment epithelium rpm - Rotation per minute
RPMI - Roswell Park Memorial Institute SCFA - Short-chain fatty acid
SCO2 - Cytochrome c oxidase 2 SDS - Sodium dodecyl sulphate
xiv
SEM - Standard error of the mean
SERCA - Sarco/endoplasmic reticulum calcium Ca2+- ATPase
siRNA - Small interfering RNA
siRNA-AF - siRNA non-target labeled with Alexa Fluor SLC16 - Solute Carrier Family 16
SMCTs - Sodium-linked monocarboxylate transporters T3 - Triiodothyronine
T4 - Thyroxine
T25 flasks - 25 cm2 polystyrene culture flasks
TCA (cycle) - Tricarboxylic acid cycle TDLUs - Terminal ductal lobular units
TEMED - N,N,N’,N’-tetramethyl-ethylene-1,2-diamine TIGAR - TP53-induced glycolysis and apoptosis regulator TMDs - Transmembrane domains
TSA - Trichostatin A
TUNEL - Terminal dUTP Nick-End Labeling V-ATPase - Vacuolar-type H+-ATPase
VDAC - Voltage Dependent Anion Channel VEGF - Vascular endothelial growth factor
xv
Index of Figures
Figure 1. Integrative view of the ten hallmarks of cancer... 4 Figure 2. Schematic representation of glucose metabolism in differentiated tissues (left panel),
normal proliferative tissues and tumor cells (right panel) ... 6
Figure 3. Schematic representation of the cell-microenvironment interactions associated with
the carcinogenesis process.. ... 7
Figure 4. Schematic overview of cancer cells metabolism ... 9 Figure 5. Schematic representation of the molecular mechanisms driven the Warburg effect in
cancer cells ... 11
Figure 6. Role of MCTs in cancer cells metabolism. ... 17 Figure 7. Schematic representation of metabolic targeting tumor strategies ... 19 Figure 8. Main targets of 3-bromopyruvate molecule in cancer cells: (1) hexokinase II and (2)
ATP synthasome ... 21
Figure 9. Schematic overview of butyrate dual function in energetics and epigenetics in normal
and cancerous colonocytes in the intestinal lumen ... 23
Figure 10. Expression analysis of MCT1, MCT4, CD147, CD44 and AE1 in ZR-75-1, MCF-7,
MDA-MB-231 and SK-BR-3 breast cancer cell lines at basal conditions ... 41
Figure 11. Effect of butyrate (0.5 mM and 10 mM) alone or in combination with 3-BP IC50 on
cell viability of ZR-75-1, MCF-7, MDA-MB-231 and SK-BR-3 breast cancer cell lines, after 16 hours of incubation ... 43
Figure 12. Analysis of cellular confluence of ZR-75-1, MCF-7, MDA-MB-231 and SK-BR-3 breast
cancer cell lines at 16 hours, after treatment with butyrate (0.5 and 10 mM) alone or in combination with 3-BP IC50... 44
Figure 13. Expression analysis of MCT1, MCT2, MCT4 and CD147 in ZR-75-1 breast cancer
cell line after treatment with butyrate (0.5 mM and 10 mM) alone or in combination with 3-BP IC50 for 16 hours ... 45
Figure 14. Expression analysis of MCT2, MCT4 and CD44 in MCF-7 breast cancer cell line after
treatment with butyrate (0.5 mM and 10 mM) alone or in combination with 3-BP IC50 for 16
hours ... 46
Figure 15. Expression analysis of MCT1, MCT2 and MCT4 in MDA-MB-231 breast cancer cell
line after treatment with butyrate (0.5 mM and 10 mM) alone or in combination with 3-BP IC50 for 16 hours ... 47
Figure 16. Expression analysis of MCT1, MCT2, MCT4 and CD147 in SK-BR-3 breast cancer
cell line after treatment with butyrate (0.5 mM and 10 mM) alone or in combination with 3-BP IC50 simultaneously for 16 hours ... 48
Figure 17. Actin structural alterations in ZR-75-1 and SK-BR-3 cell lines, after treatment with
3-BP IC50 for 16 hours ... 49
Figure 18. Optimization of RNAi reverse transfection conditions with Lipofectamine RNAiMAX
transfection reagent in ZR-75-1, MCF-7 and SK-BR-3 cell lines using non-target siRNA labeled with Alexa Fluor 488 (5 nM).. ... 51
xvi
Figure 19. Expression analysis of MCT1 protein after siRNA-mediated silencing with siRNA
target MCT1 in ZR-75-1 breast cancer cell line in the fourth and fifth days of transfection.. 52
Figure 20. Expression analysis of MCT4 protein after siRNA-mediated silencing with siRNA
target MCT4 in ZR-75-1 breast cancer cell line in the fourth and fifth days of transfection.. 53
Figure 21. Expression analysis of MCT1 protein after siRNA-mediated silencing with siRNA
target MCT1 in SK-BR-3 breast cancer cell line in the fifth day of transfection ... 54
Figure 22. Expression analysis of MCT1, MCT4 and CD147 after siRNA-mediated silencing with
siRNA target MCT4 in SK-BR-3 breast cancer cell line in the fifth day of transfection ... 55
Figure 23. Analysis of the effect of butyrate (0.5 and 10 mM) alone or in combination with 3-BP
IC50 on cell cycle of MDA-MB-231 breast cancer cell line, after 16 hours by flow cytometry..
xvii
Index of Tables
Table I. The human Monocarboxylate Transporter Family... 13 Table II. IC50 values of 3-bromopyruvate for the breast cancer cell lines ZR-75-1, MCF-7,
MDA-MB-231 and SK-BR-3 used in this study ... 32
3
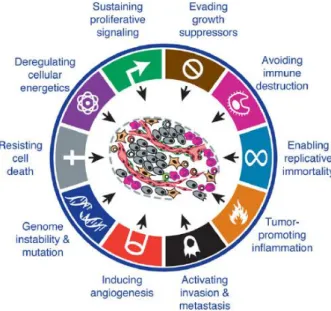
1.1. Hallmarks of cancer
Normal cells from living organisms establish a network that allows them to function, proliferate and die in a balanced environment. Several factors can contribute to the imbalance of the system such as alterations in environmental factors (e.g. radiation, chemical) and accumulation of genetic mutations in somatic cells (Pharoah, Dunning et al. 2004). These alterations can induce damage in DNA that can escape to the DNA repair mechanisms and lead to mutations and possibly disease. Neoplasia results from an uncontrolled cell proliferation that depends on the capability of malignant cells to invade surrounding tissues or metastasize to distant areas of the body (Hanahan and Weinberg 2000).
Carcinogenesis is a multifactorial and a multistep process that requires the acquisition of many biological capabilities in evolution of a normal cell to a malignant state (Hanahan and Weinberg 2000). Most of the alterations observed during carcinogenesis have been postulated as hallmarks of cancer and comprise alterations at molecular, biochemical and functional level. These alterations result in a particular cellular behavior that allow cancer cells limitless replicative potential, which results in an exponential growth by activation of telomerase; capacity to escape programmed cell death; sustained proliferative signaling by activation of oncogenes such as RAS and BRAF genes; insensitivity to growth-inhibitory signals by inactivation of tumor suppressor genes, such as p53, and activation of invasion/metastasis by loss of E-cadherin (Hanahan and Weinberg 2000). Moreover, cancer cells can induce angiogenesis leading to the formation of new blood vessels from an avascular system in a tumor cell mass induced by vascular endothelial growth factor (VEGF). Neovascularization is essential to cancer cells survival allowing the availability of oxygen and nutrients, as well as the release of cellular residual metabolites and carbon dioxide (Hanahan and Weinberg 2000).
Recently were proposed new hallmarks important for carcinogenesis, such as the inflammatory microenvironment, genome instability leading to increase the genetic alterations, the ability to escape immune system and the reprogramming of cellular energy metabolism (Hanahan and Weinberg 2011) (Figure 1). The first two new capabilities, referred as enabling characteristics, contribute to tumor progression by the accumulation of mutations and by inducing an inflammatory response. Finally, the last two capabilities named emerging hallmarks have received some attention given the importance of cancer cell metabolism in proliferation and tumor progression (Hanahan and Weinberg 2011).
4
The interaction of each one of the ten hallmarks in the tumor context provides favorable conditions to accelerate tumorigenesis by promoting proliferation, progression and resistance to defense mechanisms and, therefore leading to a malignant phenotype.
Figure 1. Integrative view of the ten hallmarks of cancer (Hanahan and Weinberg 2011).
1.2. Reprogramming the energy metabolism in cancer cells
Similar to normal cells the metabolism of cancer cells is essential for cell maintenance and proliferation (Vander Heiden, Cantley et al. 2009). Most cancer cells exhibit a peculiar high glycolytic metabolism even in the presence of oxygen which allows adaptation to intermittent hypoxia conditions, higher proliferative rates and resistance to oxidative damages induced by oxidative phosphorylation. Moreover, the end-product of “aerobic glycolysis”, lactate is important to create an extracellular acidic environment that favors the maintenance and progression of the tumor cell mass.
1.2.1. Warburg effect in cancer cells
The survival of multicellular organisms requires a constant supply of nutrients. In mammals, cell proliferation is regulated by growth factors that control the uptake of nutrients from the extracellular environment (Vander Heiden, Cantley et al. 2009).
5
Among all the nutrients, glucose occupies a central position in cell metabolism both as energy source and as a versatile carbon precursor for biosynthetic reactions. Glycolysis, allows the extraction of energy retained in the six-carbon glucose molecule by its oxidation into two three-carbon molecules of pyruvate. In glucose metabolism are involved several enzymes that participate in a series of degradation reactions (catabolic reactions) generating two molecules of NADH (nicotinamide adenine dinucleotide (NAD+) reduced), two molecules of adenosine
triphosphate (ATP) and two molecules of pyruvate per molecule of glucose.
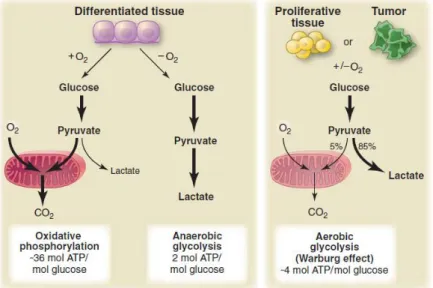
In aerobic conditions, most differentiated tissues acquire cellular energy through the oxidative phosphorylation (OXPHOS), which occurs in the mitochondria (Figure 2). In OXPHOS, pyruvate is completely oxidized to carbon dioxide through the enzymes of the tricarboxylic acid (TCA) cycle associated to maximal ATP production through the respiratory chain in the mitochondria. The free energy resulting from this process is driven to ATP synthasome (ATP Synthase/Pi Carrier/Adenine Nucleotide Carrier complex) to generate ATP from ADP and inorganic phosphate (Pi) in the presence of Mg2+. This process occurs exclusively in aerobic
conditions because oxygen is the final electron acceptor of the respiratory chain. In the absence of oxygen (anoxia) or under low oxygen conditions (hypoxia), differentiated cells are unable to support OXPHOS therefore pyruvate is converted to lactate via lactate fermentation in the cytosol (Figure 2). In anaerobic metabolism, pyruvate is reduced to lactate by lactate dehydrogenase isoform A (LDHA), accepting electrons from NADH and regenerating NAD+ needed to maintain
glycolysis (Munoz-Pinedo, El Mjiyad et al. 2012). The lactate formed is secreted into the extracellular environment by monocarboxylate transporters (MCTs) (Gatenby and Gillies 2004).
The energetic yield of glucose metabolism via OXPHOS generates 36 molecules ATP per molecule glucose, whereas lactate fermentation generates only 2 molecules ATP per molecule glucose (Vander Heiden, Cantley et al. 2009). According to the energetic yield, the presence of adequate oxygen levels inhibits lactate fermentation and the glucose metabolism is driven to OXPHOS which is the process energetically more efficient. This metabolic shift was first demonstrated by Louis Pasteur, who observed in yeast cells reduced fermentation of glucose in the presence of oxygen (Pasteur effect) (Racker 1974).
In contrast to normal differentiated tissues, most cancer cells rely more on glycolysis for ATP production independently on the oxygen availability in the extracellular microenvironment (Figure 2). The high glycolytic rates of cancer cells even in the presence of oxygen was first demonstrated by Otto Warburg (Warburg 1956). The first explanation of this phenomenon termed
6
Warburg effect or “aerobic glycolysis” was given by him who suggested that irreversible damage in the mitochondrial function in cancer cells limited the oxidative phosphorylation and therefore glucose metabolism occurred exclusively by the glycolytic pathway and it was causally involved in the development of tumors (Warburg 1956). However, it was later found that mitochondrial function is not altered in all cancer cells that exhibits Warburg effect and this would be not the reason for the typical phenotype of cancer cells (Schulze and Harris 2012). Recent studies have shown that glycolytic switch in cancer cells is also promoted by activation of oncogenes as Ras and inhibited by tumor suppressor genes, such as pVHL, indicating that it is intrinsically associated to carcinogenesis process (Koppenol, Bounds et al. 2011).
Figure 2. Schematic representation of glucose metabolism in differentiated tissues (left panel),
normal proliferative tissues and tumor cells (right panel). In differentiated tissue the presence or absence of oxygen determine two different pathways for glucose metabolism: oxidative phosphorylation and anaerobic glycolysis, respectively. In normal proliferative tissues and tumor cells, glucose metabolism is mainly driven to lactate fermentation even in the presence of oxygen (Warburg effect or aerobic glycolysis) (Vander Heiden, Cantley et al. 2009).
The metabolic reprogramming typical of cancer cells raises many questions: Why cancer cells produce energy by glycolysis under aerobic conditions? What are the advantages of glycolysis for cancer cells? Understanding the role of cell-environment interactions in tumor evolution is the key for these answers.
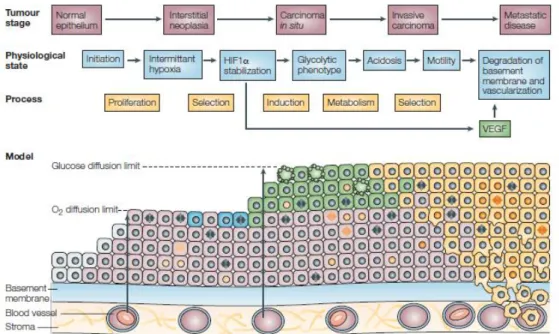
The hyperproliferative state of cancer cells leads to a development from a normal epithelium to an interstitial neoplasia characterized by uncontrolled cell proliferation that
7
progresses to a carcinoma in situ (Figure 3). In an intratumoral hypoxic environment, cancer cells achieved the oxygen diffusion limit which induces one of the two cell responses: adaptation to anaerobic glycolysis for ATP production which allows cells to survive or cell death. The metabolic adapted cancer cells acquire the ability of motility that leads to basement membrane breakdown and consequent access to blood vessels and lymphatic vasculature progressing the carcinoma in situ to an invasive state (Gatenby and Gillies 2004). However, some cancer cells remain glycolytic even oxygen availability is restored in oxygenated regions, producing most of ATP by glycolysis (Mathupala, Colen et al. 2007).
Figure 3. Schematic representation of the cell-microenvironment interactions associated with the
carcinogenesis process. Normal epithelial (grey), hyperproliferative (pink), hypoxic (blue), glycolytic (green) and motile cells (yellow) (Gatenby and Gillies 2004).
The rapid proliferation of cancer cells requires cellular energy in form of ATP obtained by glycolysis and supported by high increased of glucose uptake (Vander Heiden, Cantley et al. 2009). The upregulation of glycolysis metabolism generates metabolic intermediates that can be converted into anabolic reactions, such as synthesis of nucleic acids, lipids and proteins, increasing the availability of important biosynthetic precursors for cell growth and proliferation (Figure 4). For instance, the metabolism of glycolytic intermediate glucose-6-phosphate (G6P) through the pentose phosphate pathway (PPP) generates ribose-5-phosphate (Rib-5-P), an important intermediate in nucleotide biosynthesis. The oxidative pathway of PPP can also
8
produce nicotinamide adenine dinucleotide phosphate (NADPH), which supplies reducing equivalents for both nucleotide and fatty acid biosynthesis (Jones and Thompson 2009). Cancer cells can also take advantage of high glycolytic rates since the lactate efflux creates an extracellular acidic micro-environment which favors the process of invasion/metastasis, by activation of proteases that are involved in degradation of the extracellular matrix and basement membranes, such as metalloproteinases (MMP), (Pedersen 2007; Kroemer and Pouyssegur 2008), activation of proteins as hyaluronan and its receptor CD44, which are molecules involved in invasion and metastization (Stern, Shuster et al. 2002) and also contributes to the evasion from the immune system by blocking the glycolytic pathway of lymphocytes T (Frauwirth and Thompson 2004; Fischer, Hoffmann et al. 2007). Moreover, the exported lactate promotes angiogenesis by increasing vascular endothelial growth factor (VEGF) levels associated with the tumor aggressiveness (Hirschhaeuser, Sattler et al. 2011). On the other hand, the residual rate of OXPHOS metabolism provides protection to DNA damaging induced by reactive oxygen species (ROS) mainly produced in mitochondrial respiratory chain by complex I and III (Kroemer and Pouyssegur 2008). The “aerobic glycolysis” of cancer cells allows the metabolism of glucose in intermittent hypoxia conditions, which is important for the maintaining of the metabolism under different oxygen levels (Lopez-Lazaro 2008).
The interest in the peculiar metabolism of cancer cells led to the discovery of an hexokinase isoform which is overexpressed in cancer cells (Nakashima, Mangan et al. 1986). The enzyme hexokinase II (HK II) catalyzes the formation of glucose-6-phosphate (G6P) from glucose and ATP in the first irreversible step of the glycolysis (Wilson 1995; Wilson 1997). This hexokinase isoform is associated with outer mitochondrial membrane via Voltage Dependent Anion Channel Protein (VDAC) allowing both direct access to intramitochondrial ATP synthetized in the ATP synthasome to phosphorylate glucose, and protection from feedback inhibition by its product G6P (Nakashima, Mangan et al. 1986). The interaction of HK II with the complex ATP synthasome also keeps VDAC in the open state which counteracts with outer mitochondrial membrane (OMM) permeabilization involved in intrinsic pathway of apoptosis blocking binding sites for pro-apoptotic Bcl-2 family proteins in the OMM (Gogvadze, Zhivotovsky et al. 2010).
The high increase of glucose uptake by cancer cells is the basis for imaging technique that allows detection of tumors. In this detection system, namely positron emission tomography (PET), is used a glucose analogue tracer 18fluorodeoxyglucose (FDG) which is phosphorylated by
9
The accumulation of the radioactive glucose analogue is detected by [18F]-fluorodeoxyglucose
positron emission tomography (18FDG-PET) (Gatenby and Gillies 2004). FDG-PET imaging is used
as a non-invasive method to cancer diagnosis, as well as to monitor therapeutic response, and also allows the quantification of glucose uptake that is correlated with tumor aggressiveness (Gatenby and Gillies 2004). However, the sensitivity of FDG-PET imaging is lowered for tumors with small size (<0.8 cm3), and specificity is lowered because immune cells are also capable to
trapped FDG (Gatenby and Gillies 2004). Nuclear magnetic resonance (NMR) spectroscopy has been explored as a non-invasive method for the detection of selected metabolites such as glutamine and acetate in tumors in vivo and can provide an insight into metabolic response to therapy (Schulze and Harris 2012).
Although glycolysis is the mainly pathway responsible for ATP production in cancer cells, there are other metabolic pathways upregulated, such as glutaminolysis, lipid synthesis, ketone oxidation and serinolysis (Figure 4) (Vander Heiden, Cantley et al. 2009). Glycolysis and glutaminolysis are the most important pathways in the context of tumor. Glutaminolysis is an alternative pathway for ATP production upregulated in MYC-transformed cells (Wise, DeBerardinis et al. 2008). In this pathway, glutamine is converted to glutamate by glutaminase enzyme and generates intermediates of the TCA cycle redirected into biosynthetic reactions important to cell growth and proliferation (Vander Heiden, Cantley et al. 2009).
10
1.2.2. Molecular mechanisms driving Warburg effect
Many of the mutations observed in tumors are related to metabolism control (Figure 5) (Vogelstein and Kinzler 2004). The high glycolytic phenotype of cancer cells can be driven by alterations in signaling pathways that include transcription factors, such as hypoxia inducible factor (HIF) and MYC, and kinases such as mTOR and phosphatidylinositol 3-kinase (PI3K) (Kroemer and Pouyssegur 2008).
A principal regulator of cell metabolism is the PI3K, a lipid kinase that regulates the phosphorylation levels of phosphatidylinositol (PIP3) at the plasma membrane (Jones and Thompson 2009). Activation of PI3K leads to the activation of downstream effectors including mammalian target of rapamycin (mTOR) and the protein kinase B (Akt) that regulate metabolic activities involved in cellular biosynthesis (Jones and Thompson 2009). In normal cells, PI3K activation is high controlled by dephosphorylation of PIP3 by the phosphatase PTEN, a tumor suppressor. The pathway is deregulated in cancer through a diversity of mechanisms, including PTEN loss or activating mutations in PI3K (Jones and Thompson 2009). PI3K/Akt signaling promotes glycolysis through Akt-dependent stimulation by upregulation and membrane localization of glucose transporters (GLUT1 and GLUT4); activity and mitochondrial localization of hexokinase and phosphofructokinase; and enhanced protein translation through Akt-dependent mTOR activation (Edinger and Thompson 2002).
The survival of cancer cells in hypoxia is achieved by activation of the transcription factor hypoxia inducible factor-1 (HIF-1), a heterodimer composed of a constitutive HIF-1β subunit and a labile HIF-1α subunit (Tennant, Duran et al. 2010). Under anoxia conditions, the activation of HIF-1α increases the upregulation of genes involved in glycolysis including glucose transporter 1 and 3 (GLUT 1 and GLUT3), Hexokinase II (HK II, which catalyze the initial step of glycolysis), and lactate dehydrogenase A (LDHA), as well as involved in angiogenesis as VEGF and hematopoietic factors (erythropoietin) that accelerate tumorigenesis (Brahimi-Horn, Chiche et al. 2007; Semenza 2008). HIF1 also promotes the induction of pyruvate dehydrogenase kinase 1 (PDK1), a negative regulator of pyruvate dehydrogenase (PDH) that catalyzes the conversion of pyruvate to acetyl-CoA. This upregulation reduces electron flux through OXPHOS and subsequently reduces oxidative stress resulted from mitochondrial metabolism (Semenza 2008).
Oncogenic c-Myc is a regulator of metabolic pathways essential for tumor progression, such as glycolysis and glutaminolysis (Dang, Kim et al. 2008). MYC promotes aerobic glycolysis
11
by enhanced the expression of GLUT1 and LDHA (Shim, Dolde et al. 1997). The transcription factor MYC is also important in regulation of proliferation and cell cycle entry (Schulze and Harris 2012).
Inactivation of a tumor suppressor gene p53 also promotes glycolysis in cancer cells by both decreased a glycolysis inhibitor TIGAR (TP53-induced glycolysis and apoptosis regulator) expression, and the synthesis of the protein cytochrome c oxidase 2 (SCO2) required for the correct assembly of the cytochrome c oxidase (COX) complex of the electron chain in the mitochondria. The loss of p53 protein activity also increases glucose uptake and HIF-1 levels (Vander Heiden, Cantley et al. 2009).
1.3. Monocarboxylate transporters
Lactate is the monocarboxylic acid that can be formed as end-product of glycolysis and its intracellular accumulation results in acidification of the cytosol and inhibition of phospho-fructokinase-1 (PFK-1) and consequently glycolysis (Halestrap and Price 1999). Therefore, the transmembrane transport of monocarboxylic acids is an essential mechanism for pH homeostasis in mammalian cells, and is catalyzed by monocarboxylate transporters (MCTs) (Halestrap and Price 1999). The efflux of lactate is particularly important for high glycolytic cells
Figure 5. Schematic representation of the molecular mechanisms driven the Warburg effect in
12
such as most cancer cells, white and red blood cells, and tissue skeletal muscle (Merezhinskaya and Fishbein 2009).
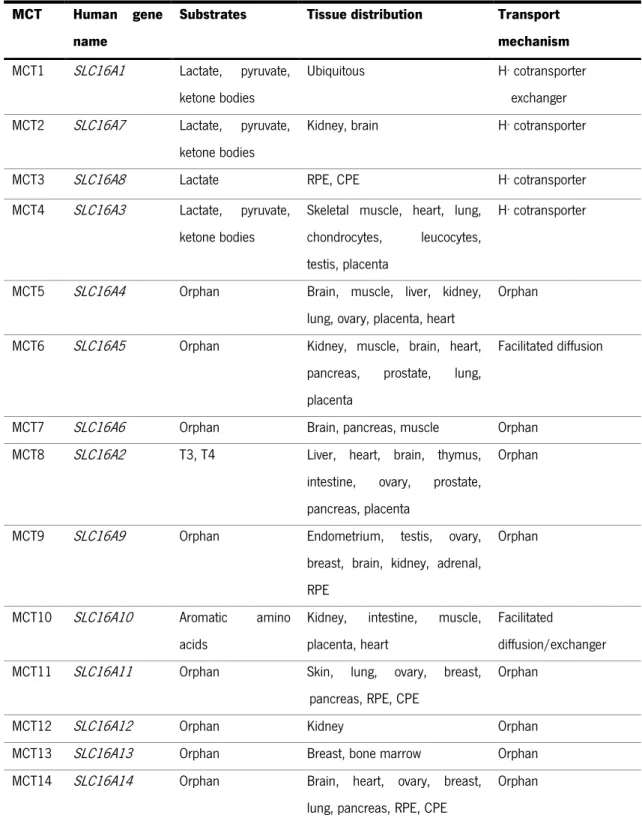
Actually, are described fourteen human MCT members belonging to the MCTs family encoded by the SLC16 gene family of solute carriers (Table I) (Halestrap and Meredith 2004; Halestrap and Wilson 2012). The predicted topology of these transporters showed 12 alpha-helical transmembrane domains (TMDs) with an intracellular N- and C-terminus and a large intracellular loop between TMDs 6 and 7 (Poole, Sansom et al. 1996). Based on amino acid sequence and functional similarities, the heterogenic MCTs family can be divided into three main clusters, where MCT1-4 cluster is responsible for the H+-linked transport of endogenous
monocarboxylic acids, such as pyruvate, lactate and ketone bodies across the plasma membrane with different tissue distribution, regulation and substrate/inhibitor affinity (Pinheiro, Longatto-Filho et al. 2012). In MCT1-4 cluster, both influx and efflux of monocarboxylates are cotransporter couple to protons in a equimolar manner by a simport mechanism according to substrate concentration and pH gradient between intracellular and extracellular environment (Halestrap and Wilson 2012). MCTs 5-7, 9 and 11-14 are described as orphan transporters whose substrates are unknown and their functional role is not characterized (Morris and Felmlee 2008). MCT8 and MCT10 have a wide tissue distribution and are thyroid hormones triiodothyronine (T3)/thyroxine (T4) and aromatic aminoacids transporters, respectively. Both MCT8 and MCT10 isoforms have been demonstrated to transport their substrates in a H+- and
Na+- independent manner (Morris and Felmlee 2008)
Recently has been described two members of Na+-linked monocarboxylate transporters
(SMCTs) solute carrier transporter family, the SLC5A8 (SMCT1) and SLC5A12 (SMCT2) present in the plasma membrane able to transport monocarboxylates across the plasma membrane (Li, Myeroff et al. 2003). SMCTs mediate the active transport of a variety of monocarboxylic acids against its chemical gradient using the energy released by the translocation of Na+ in favor of its
concentration gradient (Miyauchi, Gopal et al. 2004). These transporters demonstrate a more restricted distribution in thyroid gland, kidney, colon, retina and brain, while MCTs show a more ubiquitous distribution (Paroder, Spencer et al. 2006; Ganapathy, Thangaraju et al. 2008; Thangaraju, Cresci et al. 2008). In the intestine SMCT1 transporter mediates the uptake of butyrate from the lumen into colonocytes (Gupta, Martin et al. 2006; Ganapathy, Thangaraju et al. 2008; Thangaraju, Cresci et al. 2008). SMCT1 also function as a tumor suppressor gene in both gliomas and colon cancer (Li, Myeroff et al. 2003).
13
Table I. The human Monocarboxylate Transporter Family (adapted from Halestrap and Meredith
2004; Morris and Felmlee 2008). T3 – triiodothyronine; T4 – thyroxine; CPE – choroid plexus epithelium; RPE – retinal pigment epithelium
MCT Human gene name
Substrates Tissue distribution Transport mechanism
MCT1 SLC16A1 Lactate, pyruvate, ketone bodies
Ubiquitous H+ cotransporter
exchanger MCT2 SLC16A7 Lactate, pyruvate,
ketone bodies
Kidney, brain H+ cotransporter
MCT3 SLC16A8 Lactate RPE, CPE H+ cotransporter
MCT4 SLC16A3 Lactate, pyruvate, ketone bodies
Skeletal muscle, heart, lung, chondrocytes, leucocytes, testis, placenta
H+ cotransporter
MCT5 SLC16A4 Orphan Brain, muscle, liver, kidney, lung, ovary, placenta, heart
Orphan MCT6 SLC16A5 Orphan Kidney, muscle, brain, heart,
pancreas, prostate, lung, placenta
Facilitated diffusion
MCT7 SLC16A6 Orphan Brain, pancreas, muscle Orphan MCT8 SLC16A2 T3, T4 Liver, heart, brain, thymus,
intestine, ovary, prostate, pancreas, placenta
Orphan
MCT9 SLC16A9 Orphan Endometrium, testis, ovary, breast, brain, kidney, adrenal, RPE
Orphan
MCT10 SLC16A10 Aromatic amino acids
Kidney, intestine, muscle, placenta, heart
Facilitated
diffusion/exchanger MCT11 SLC16A11 Orphan Skin, lung, ovary, breast,
pancreas, RPE, CPE
Orphan
MCT12 SLC16A12 Orphan Kidney Orphan
MCT13 SLC16A13 Orphan Breast, bone marrow Orphan MCT14 SLC16A14 Orphan Brain, heart, ovary, breast,
lung, pancreas, RPE, CPE
14
1.3.1. Function and expression of MCT family
MCT1 has an ubiquitous distribution and catalyzes the cellular uptake and efflux of monocarboxylates such as pyruvate (Km 0.6-1 mM), L-lactate (Km 2.2-4.5 mM), proprionate (Km
1.5 mM), acetate (Km 3.7 mM), acetoacetate (Km 5.5 mM), L-β-hydroxybutyrate (Km 8.1-11.4 mM)
and D-β-hydroxybutyrate (Km 8.1-10.1 mM) (Halestrap and Meredith 2004; Pinheiro,
Longatto-Filho et al. 2012). MCT1 is mostly responsible for lactate uptake for oxidation in red skeletal muscles and heart or efflux in glycolytic cells, such as erythrocytes, according to the substrate concentration and pH gradient (Halestrap and Meredith 2004). MCT1 isoform is also associated with the transport of butyrate and proprionate in human colonocytes (Cuff, Lambert et al. 2002). MCT1 function as a proton-dependent cotransporter/exchanger and transport across the membrane occurs by ordered sequential binding with association of a proton followed by lactate binding (Juel and Halestrap 1999). The isoform MCT2 was characterized by heterologous expression in Xenopus laevis oocytes and is expressed in gluconeogenic tissues (kidney, liver and brain) where catalyzes with higher affinity the uptake of L-lactate (Km 0.7 mM),
D-β-hydroxybutyrate (Km 1.2 mM), pyruvate (Km 0.08 mM) and acetoacetate (Km 0.8 mM) than MCT1
(Broer, Broer et al. 1999; Pinheiro, Longatto-Filho et al. 2012). MCT3 has a very restricted distribution in the basolateral membrane of the retinal pigment epithelium (RPE) and the choroid plexus epithelia (CPE), and catalyzes the L-lactate export in the retina (Bergersen, Johannsson et al. 1999). Finally, the isoform MCT4 is predominantly expressed in highly glycolytic cells such as white blood cells (leucocytes), white skeletal muscle fibers and astrocytes, exhibiting the highest Km values for most substrates that MCT1 and MCT3, such as L-lactate (km 28.0-34.0) and
pyruvate (Km 153.0) (Dimmer, Friedrich et al. 2000; Pinheiro, Longatto-Filho et al. 2012). The
physiologic function of MCT4 is the efflux of lactate of glycolytic cells (Halestrap and Meredith 2004).
Recent studies have shown that MCTs1-4 are heteromeric transporters composed of an catalytic α-subunit (MCT) and an accessory β-subunit (CD147) (Philp, Ochrietor et al. 2003). The expression and functional activity of MCTs1-4 is associated with ancillary proteins that are involved in correct trafficking and anchoring to the plasma membrane. MCT1, 3 and 4 require association with the mature glycosylated form of CD147 protein also known as Extracellular Matrix Metalloproteinase Inducer (EMMPRIN) or basigin (Kirk, Wilson et al. 2000; Gallagher, Castorino et al. 2007; Pinheiro, Reis et al. 2010) in the endoplasmatic reticulum, while MCT2
15
isoform requires the association with integral membrane glycoprotein gp70 or EMBIGIN (Gallagher, Castorino et al. 2007). MCT4 expression regulates the maturation of CD147 in a high invasive breast cancer cell line MDA-MB-231, supporting the high glycolytic rates and consequent increase in efflux of lactate (Gallagher, Castorino et al. 2007).
1.3.2. Genetic regulation of MCT family
The regulation of MCTs expression can be driven by a variety of stimuli including hormones, exercise and monocarboxylic acids like butyrate and lactate (Kennedy and Dewhirst 2010). MCTs expression undergoes transcriptional, post-transcriptional and post-translational regulation and appears to be regulated in a tissue-specific manner (Morris and Felmlee 2008). Several studies have shown that in skeletal muscle MCT1 levels increase in response to chronic stimulation (e.g. chronic electrical stimulation) or exercise in rats and humans mediated by calcium and cyclic adenosine monophosphate (AMP) that activate calcineurin and AMP-activated protein kinase (AMPK) (Coles, Litt et al. 2004; Halestrap and Wilson 2012). Thyroid-stimulating hormone has also been associated with the upregulation of MCT1 and MCT4 expression in skeletal muscle (Halestrap and Wilson 2012). Treatment with testosterone resulted in an increase of MCT1 protein expression without alteration in MCT1 mRNA level suggesting an post-transcriptional regulation (Enoki, Yoshida et al. 2006). Others studies have shown that butyrate stimulate MCT1 promoter activity in both colon cancer cell line Caco-2 and colonic epithelial cell line AA/C1 via NF-κB pathway suggesting a transcriptional regulation mechanism (Cuff, Lambert et al. 2002; Borthakur, Saksena et al. 2008). Recently were suggested that GPR109A, a luminal short-chain fatty acid (SCFA) sensor, mediates the effects of SCFA substrates in MCT1 membrane localization and function (Borthakur, Priyamvada et al. 2012). High concentrations of lactate have been reported to increase MCT1 mRNA and protein levels in L6 myoblasts cells via NF-κB pathway (Hashimoto, Hussien et al. 2007). Trichostatin A (TSA), a histone deacetylase (HDAC) inhibitor can also induce the activity of MCT1 promoter in human intestinal epithelial cells (Borthakur, Saksena et al. 2008). Post-translational regulation of MCT1 by microRNAs has also been observed were miR-29a and miR-29b contribute to silence MCT1 expression in pancreatic β-cell-specific (Pullen, da Silva Xavier et al. 2011) and miR-124, a microRNA in the mammalian nervous system, regulates MCT1 expression in medullobastoma cells (Li, Pang et al. 2009). MCT1 gene is reported to be hypermethylated (Hussien and Brooks 2011).
16
The isoform MCT2 has been reported to be regulated by post-translational mechanisms (Halestrap and Wilson 2012). In brain, MCT2 expression is enhanced by noradrenaline, insulin and insulin like growth factor 1 (IGF-1) by translational activation (Halestrap and Wilson 2012). Obesity has also been associated with the upregulation of MCT2 mRNA expression levels in the brain of a rat OVX+E2 model (Matsuyama, Ohkura et al. 2009).
MCT4 is mainly upregulated by hypoxia conditions through a HIF-1α-dependent mechanism, which is in accordance with the role of this transporter in lactate export from glycolytic cells (Ullah, Davies et al. 2006). Butyrate has also reported to increase the expression of MCT4 and the localization of MCT1 at the plasma membrane in the human breast cancer cell line SK-BR-3 (Queiros, Preto et al. 2012). MCT4 silencing is achieved by promoter methylation (Huang, Plass et al. 2011).
1.3.3. The role of MCTs in cancer
High levels of MCTs expression have been associated with carcinogenesis given the increase of lactate production due to Warburg effect (Pinheiro, Longatto-Filho et al. 2008; Pinheiro, Albergaria et al. 2010). The efflux and influx of lactate is mainly mediated by MCT4 and MCT1 isoforms, respectively (Semenza 2008). The presence of MCT4 in the plasma membrane of cancer cells plays a dual function allowing the efflux of intracellular lactate and pH regulation since the efflux of lactate is coupled to the output of a proton, important to prevent intracellular acidification and consequently apoptosis (Figure 6) (Pinheiro, Longatto-Filho et al. 2012). The maintenance of an appropriate intracellular pH is also ensured by others pH regulatory systems in the plasma membrane, such as Na+/H+ exchanger (NHE) family, carbonic anhydrase 9 (CA9)
and anion exchanger 1 (AE1) (Chiche, Brahimi-Horn et al. 2010).
MCT isoforms are differently upregulated in tumors including colon cancinoma, lung cancer, high grade gliomas, breast cancer, prostate cancer and gastric adenocarcinomas (Pinheiro, Longatto-Filho et al. 2012). MCT1 is upregulated in breast cancer (Pinheiro, Albergaria et al. 2010), colorectal (Pinheiro, Longatto-Filho et al. 2008) and cervical cancer (Pinheiro, Longatto-Filho et al. 2008) associated to poor prognosis. MCT4 is upregulated in cervical (Pinheiro, Longatto-Filho et al. 2008), colorectal (Pinheiro, Longatto-Filho et al. 2008) and prostate cancer (Pertega-Gomes, Vizcaino et al. 2011) and downregulated in gastric cancer (Pinheiro, Longatto-Filho et al. 2009). In a particular aggressive subtype of breast cancer
(basal-17
like) were observed high expression of MCT1 in the cytosol and in the plasma membrane compared to normal breast epithelium (Pinheiro, Albergaria et al. 2010; Pinheiro, Reis et al. 2010). Moreover, the expression of MCT2 was only present in the cytoplasm at similar levels to normal tissue (Pinheiro, Reis et al. 2010) and MCT4 showed a significant increase in cytoplasm expression compared to normal epithelium (Pinheiro, Albergaria et al. 2010) with no differences in plasma membrane expression. In fact, this study concluded that the high expression of MCT1 alone or in co-expression with CD147 is associated with tumor aggressiveness in breast cancer (Pinheiro, Albergaria et al. 2010).
Figure 6. Role of MCTs in cancer cells metabolism (Chiche, Brahimi-Horn et al. 2010).
1.4. Metabolic targeting strategies for cancer therapy
Since metabolic phenotype of cancer cells is the basis for several mechanisms of tumor resistance to traditional therapy it had been explored several anticancer strategies targeting tumor metabolism. Metabolic strategies include indirect targets that consist in signaling pathways that regulates cellular metabolism altered in cancer, and direct targets such as metabolic enzymes (Tennant, Duran et al. 2010) (Figure 7).
The first antimetabolites were designed to inhibiting DNA synthesis. These drugs include 5-fluorouracil (5-FU) and cytarabine (Ara-C) that target the final stages of nucleotide synthesis
18
pathway, leading to incomplete DNA synthesis and cell death unspecific to cancer cells (Ewald, Sampath et al. 2008).
The aberrant glycolytic phenotype of cancer cells has been explored as a target for direct inhibitors with agents targeting key enzymes of this metabolic pathway (Pelicano, Martin et al. 2006; Tennant, Duran et al. 2010). Glucose transporter 1 (GLUT1) overexpressed in cancer cells, is a target for the agent phloretin (Cao, Fang et al. 2007) with promise results in cell growth inhibition in vitro (Devi and Das 1993) and in vivo (Nelson and Falk 1993). The first glycolytic enzyme, hexokinase, can be inhibited by both lonidamine and a glucose analog 2-deoxyglucose, currently in clinical trials in combination with others chemotherapeutic agents (Tennant, Duran et al. 2010). Another glycolytic inhibitor is Imatinib or Gleevec that limits hexokinase and glucose-6-phosphate dehydrogenase (G6PD) activity in leukemia cells (Boren, Cascante et al. 2001; Gottschalk, Anderson et al. 2004). The final enzyme of glycolytic pathway is pyruvate kinase (PK) which converts phosphoenolpyruvate (PEP) into pyruvate and an inhibitor of PK, termed TLN-232 has been used in Phase II clinical trials (Tennant, Duran et al. 2010). In lactate fermentation, pyruvate is reduced to lactate by lactate dehydrogenase (LDHA) and pyruvate dehydrogenase kinase 1 (PDHK1) regulates the activity of pyruvate dehydrogenase (PDH) complex. PDHK1 is inhibited by dichloroacetate (DCA) which increased PDH activity and promote switch from glycolysis to OXPHOS reacting mitochondrial function and generation of free radicals which were toxic to tumor growth. Although DCA is not a specific inhibitor for cancer cells (Stockwin, Yu et al. 2010) it induces a decrease in tumor proliferation (Bonnet, Archer et al. 2007).
Several small molecules are known to inhibit the function of MCTs important to support glycolytic metabolism by exporting lactate. MCTs inhibitors can be group into three categories: (i) bulky or aromatic monocarboxylates that act as competitive inhibitors, such as phenyl-pyruvate α-cyano-4-hydroxycinnamate (CHC) (Halestrap 1976); (ii) amphiphilic compounds as flavoniods (quercetin and phloretin) and anion exchanger (AE) inhibitors, such as 5-nitro-2-(3-phenyl-propylamino)-benzoate (NPPB) (Halestrap and Meredith 2004); (iii) stilbene disulphonates as 4,4’-diisothiocyanostilbene-2,2’-disulphonate (DIDS) (Poole and Halestrap 1991). These inhibitors are not specific for one MCT isoform, for instance CHC is a potent inhibitor of MCT1 but can also inhibit MCT2 (Halestrap and Price 1999). Recently, AstraZeneca developed a specific and high affinity inhibitor for MCT1 (AR-C155858) that is a potent immunosuppressive drug inhibiting T lymphocyte proliferation and were subsequently shown to bind to MCT1 and MCT2, but not MCT4 in in vitro and in vivo (Murray, Hutchinson et al. 2005). The inhibition of MCT1 occurs by
19
binding to intracellular site involving transmembrane helices 7-10 (Ovens, Davies et al. 2010) and MCT2 inhibition is modulated by association to ancillary protein (Ovens, Manoharan et al. 2010).
MCTs have been also explored as potential gateways to drug delivery particularly drugs with a carboxyl group in their chemical structure (Halestrap and Price 1999; Enerson and Drewes 2003). 3-bromopyruvate (3-BP) has been further explored due to it potential as a metabolic inhibitor that inhibits energy production in form of ATP at both glycolysis and oxidative phosphorylation levels. Animal models showed that 3-BP has been efficient in eradication of tumors of advanced liver cancers in vivo when the compound was delivery by local infusion and intravenously, without apparent cytotoxicity effects to normal cells (Geschwind, Ko et al. 2002; Ko, Smith et al. 2004). Moreover, recently was reported a first human translational study that demonstrate 3-BP efficacy and specificity in eradication of tumor, being in preclinical trials (Pelicano, Martin et al. 2006; Tennant, Duran et al. 2010; Ko, Verhoeven et al. 2012).
Figure 7. Schematic representation of metabolic targeting tumor strategies (Tennant, Duran et
al. 2010). 5-FU – 5-fluorouracil; αKG – α-ketoglutarate; ACLY – ATP citrate lyase; CA – carbonic anhydrase; CINN – α-cyano-4-hydroxycinnamate; DCA – dichloroacetate; FASN – fatty acid synthase; G6P – glucose-6-phosphate; Glut – glucose transporter; HK – hexokinase; IGF1 – insulin-like growth receptor 1; IGF1R – IGF1 receptor; LDH – lactate dehydrogenase; Mal – malate; MCT – monocarboxylate transporter; NHE1 – Na+/H+ exchanger 1; OAA –
oxaloacetate; PDH – pyruvate dehydrogenase; PDK – pyruvate dehydrogenase kinase; PEP – phosphoenol pyruvate; PK – pyruvate kinase; R5P – ribose 5-phosphate; TCA – tricarboxylic acid cycle
20
1.4.1. 3-Bromopyruvate as an anticancer agent
3-bromopyruvate (3-BP) is a pyruvate analog with anticancer activity (Ko, Pedersen et al. 2001; Pedersen 2012; Shoshan 2012). This molecule is an alkylating agent able to inhibit the enzymatic function of several proteins by its pyruvylation at a -SH group of cysteine residue (Ko, Verhoeven et al. 2012). 3-BP suppresses both glycolysis and oxidative phosphorylation capacity decreasing the production of intracellular ATP and subsequently cause cell death (Ko, Pedersen et al. 2001).
The most relevant targets of 3-BP to tumor metabolism are the glycolytic enzyme HK II, responsible for the phosphorylation of glucose to glucose-6-phosphate, and the mitochondrial ATP synthasome located in the inner mitochondrial membrane responsible for the generation of ATP (Ko, Pedersen et al. 2001; Ko, Smith et al. 2004; Chen, Zhang et al. 2009; Mathupala, Ko et al. 2009) (Figure 8). 3-BP covalently modify modifies the HKII, leading to its dissociation from the mitochondria and the release of apoptosis-inducing factor (AIF) and cell death (Chen, Zhang et al. 2009).
Several studies have shown that 3-BP also inhibits others glycolytic enzymes such as glyceraldehyde-3-phosphate dehydrogenase (GAPDH) (Ganapathy-Kanniappan, Geschwind et al. 2009; Ganapathy-Kanniappan, Vali et al. 2010), 3-phosphoglycerate kinase (PGK) (Pereira da Silva, El-Bacha et al. 2009), pyruvate kinase (PK) (Acan and Ozer 2001) and non-glycolytic enzymes such as vacuolar-type H+-ATPase (V-ATPase) (Dell'Antone 2006), 4-aminobutyrate
aminotransferase (Blessinger and Tunnicliff 1992), sarco/endoplasmic reticulum calcium Ca2+-
ATPase (SERCA) type 1 (Jardim-Messeder, Camacho-Pereira et al. 2012), histone deacetylases (HDAC1 and HDAC3) (Thangaraju, Karunakaran et al. 2009) and mitochondrial succinate dehydrogenase (Pereira da Silva, El-Bacha et al. 2009). Therefore, the effect of 3-BP include alteration in mitochondria dynamic by mitochondrial depolarization, decrease in cellular ATP levels from glycolysis and mitochondrial respiration (Pedersen 2007; Ihrlund, Hernlund et al. 2008), induction of apoptosis pathway by release of apoptosis-inducing factor (AIF) (Kim, Ahn et al. 2008) and induction of endoplasmatic reticulum stress which inhibits protein synthesis (Ganapathy-Kanniappan, Geschwind et al. 2010) that lead to cell death. Although 3-BP targets have been identified, the precise mechanism of its uptake into cancer cells is poorly understood. Transport studies in Xenopus laevis oocytes expressed human SLC5A8 (SMCT1) and ectopic expression of SMCT1 in human breast cancer cell line MCF7 demonstrated that SMCT1 is involved in the transport of 3-BP into cells (Thangaraju, Karunakaran et al. 2009). Moreover, a
21
recent haploid cell genetic screening study performed in human leukemia cell line KBM7 showed that MCT1 is also involved in the transport of 3-BP (Birsoy, Wang et al. 2013).
Some studies demonstrated that 3-BP eradicate several types of tumors of advanced cancers. 3-BP anticancer effect was reported in human breast cancer by our group and others (Buijs, Vossen et al. 2009; Queiros, Preto et al. 2012), in rabbit VX2 model of hepatocarcinomas (Ko, Smith et al. 2004), in rabbit liver cancer (Ko, Pedersen et al. 2001; Geschwind, Ko et al. 2002; Vossen, Buijs et al. 2008), in lung cancer (Zhang, Pan et al. 2012) and in mesothelioma (Philippe, Xiao-Dong et al. 2012). Moreover, 3-BP in combination with chemotherapeutic drugs induced a dose-dependent effect. 3-BP has a significant combinatory effect with cisplatin and oxaliplatin in HCT116 colon carcinoma cell line (Ihrlund, Hernlund et al. 2008). Combination with rapamycin show highly synergistic effect in both killing leukemia and lymphoma cells (Xu, Pelicano et al. 2005). The action of these two agents promotes the depletion of cellular ATP, and caused dephosphorylation of the mTOR downstream target molecules. In C6 glioma cells, the combination of 3-BP with citrate (inhibitor of phosphofructokinase) deplete ATP and block migratory capacity (El Sayed, El-Magd et al. 2012). More recently, it was also reported a first human patient case with fibrolamellar hepatocellular carcinoma known to treated with 3-BP, that demonstrate the eradication of tumor without apparent cytotoxicity to normal cells (Ko, Verhoeven et al. 2012). Several in vitro and in vivo studies with 3-BP demonstrates its potential clinical use as an anticancer agent.
Figure 8. Main targets of 3-bromopyruvate molecule in cancer cells: (1) hexokinase II and (2)
22
1.5. Butyrate anti-carcinogenic potential in cancer cells
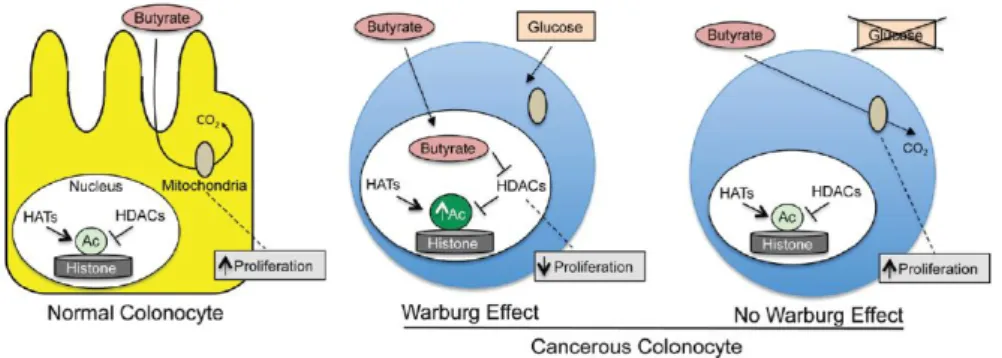
Short-chain fatty acids (SCFAs), proprionate, acetate and butyrate are produced by colonic bacterial fermentation of dietary fiber in the intestinal lumen (Hamer, Jonkers et al. 2008). The production of butyrate is important for the maintenance of colonic homeostasis by inducing cell maturation, differentiation and apoptosis pathways (Gupta, Martin et al. 2006). Butyrate is a major primary energy source for colonocytes (Fleming, Fitch et al. 1991). At high levels (2-5 mM) function as a inhibitor of histone deacetylases (HDAC) resulting in hyperacetylation of histones and consequent decrease in their affinity for binding DNA and hence increases the accessibility for transcription genes silenced at epigenetic level (Donohoe, Collins et al. 2012). At low doses (0.5-1 mM) butyrate is metabolized in the mitochondria to acetyl-CoA by β-oxidation followed by TCA cycle to yield citrate. Citrate is exported to the cytosol and converted to acetyl-CoA by the enzyme ATP citrate lyase (ACL). In the nucleus, acetyl-CoA is a cofactor and acetyl-group donor for histone acetyltransferases (HATs) that promotes acetylation of histones (Figure 9) (Donohoe, Collins et al. 2012).
As all weak carboxylic acids, SCFAs are partially ionized in solution. SCFAs have a pKa value approximately of 4.8, and more than 90% exist in the anionic form (dissociated form), ionized in physiologic conditions in the lumen (Hamer, Jonkers et al. 2008). Butyrate can be transported across the colonocyte apical membrane by simple diffusion of the undissociated form that is lipid soluble (Velazquez, Lederer et al. 1997), bicarbonate exchanger SCFA/HCO3
-(Kawamata, Hayashi et al. 2007) and also by active transport of dissociated form by MCT1 (Cuff, Dyer et al. 2005) and SMCT1 (Gupta, Martin et al. 2006; Thangaraju, Cresci et al. 2008)
The role of butyrate in intestinal lumen has been associated to inflammatory and anti-tumor activity (Inan, Rasoulpour et al. 2000; Hamer, Jonkers et al. 2008). In normal colonocytes low doses of butyrate (0.5-1 mM) promotes cell proliferation by HAT activity, in contrast to its effects on cancerous colonocytes. This opposite effect has been referred as “Butyrate paradox” and is poorly understood. The fact that butyrate at high levels can act as an HDAC inhibitor has been recently linked to this inhibitory growth effect in cancerous colonocytes (Donohoe, Collins et al. 2012). The upregulation of glycolysis in cancerous colonocytes due to the Warburg effect, results in accumulation of butyrate non metabolized in the nucleus where function as HDAC inhibitor to regulate genes that inhibited cell proliferation and promoted apoptosis (Donohoe, Collins et al. 2012).
23
Recently, our group demonstrated that pre-incubation with butyrate enhanced significantly 3-BP cytotoxicity effect, especially in the most resistant human breast cancer cell line, SK-BR-3. Butyrate induced localization of MCT1 in the plasma membrane, as well as overexpression of MCT4 and its chaperon CD147 which were accompanied by an increased sensitivity to 3-BP cytotoxic effect (Queiros, Preto et al. 2012).
Figure 9. Schematic overview of butyrate dual function in energetics and epigenetics in normal
and cancerous colonocytes in the intestinal lumen. Butyrate is a primary energy source for normal colonocyte and is metabolized by β-oxidation to acetyl-CoA which is a cofactor for histone acetyltransferases (HATs) that regulate gene expression in the nucleus. In cancerous colonocyte that exhibit Warburg effect, butyrate accumulates in the nucleus where function as histone deacetylases inhibitor (HDACs) regulating (Donohoe, Curry et al. 2013).
1.6. Breast cancer
Breast cancer is the most diagnosed malignancies and the leading cause of death related to cancer in women (Jemal, Bray et al. 2011). The incidence and mortality of this disease is growing and in 2008, were diagnosed 23% new cases of breast cancer and 14% of deaths related to cancer worldwide (Jemal, Bray et al. 2011). There are several factors that contribute to the risk of development breast cancer, such as environmental, hormonal, lifestyle, and genetic factors. The lifestyle related factors include late age of first pregnancy, oral contraceptive, hormone therapy after menopause, obesity and alcohol (Jemal, Center et al. 2010). Breast cancer family history is also an important risk factor, being BRCA1 and BRCA2 genes (breast cancer genes 1 and 2) the most predominant genetic mutations in hereditary breast cancer (King, Marks et al. 2003).